Theoretical Concepts and Applications of Turbulent Flow Chromatography
LCGC North America
Turbulent flow chromatography is often used for on-line sample cleanup of biological matrices in liquid chromatography–mass spectrometry applications.
Turbulent flow chromatography is often used for on-line sample cleanup of biological matrices in liquid chromatography–mass spectrometry applications. However, the general mechanisms are not well represented in the literature and there is a lot of misunderstanding of turbulent flow chromatography's basic principles. This column installment will explore the technique's theoretical concepts, explain how they can be applied, and discuss common practice through examples in the literature.
Turbulent flow was first defined over 100 years ago by British physicist Osborne Reynolds (1). Reynolds discovered that the flow of a fluid through a conduit becomes turbulent when the momentum of the fluid exceeds its resistance to flow by a factor of 2000–3000. The ratio of these opposing forces, known as the Reynolds number (Re), is expressed in equation 1:

The momentum, which is a certain amount of mass moving at a certain velocity (v), takes into account the fluid's density (ρ) and the diameter of the tube (Df). We can increase the fluid's momentum by increasing its velocity or by increasing the diameter of the tube, or both. The resistance to flow is expressed as the absolute or dynamic viscosity of the fluid (η), which is in units of grams per centimeter-second, or centipoise (cP). The transition from laminar to turbulent flow occurs as Re increases past a critical value between 2000 and 3000 in a straight tube with a smooth internal surface.
In the case of a tube packed with particles, such as a chromatographic column, the diameters of all of the flow paths cannot be measured, but the average diameter of the packing particles (dp) can be measured. The spaces between particles are proportional to the average size of the particles. Therefore, columns packed with large particles hold a greater mass of mobile phase than those packed with small particles. Equation 2 describes a special case (Re') of the Reynolds number for columns packed with particles:

where ε0 is the external porosity.
According to equation 2, turbulence occurs more readily in columns packed with large particles — 35–75 µm — than those packed with small particles — 3–10 µm. Experimental observations of solute band broadening relative to column retention have indicated that the transition from laminar to turbulent flow occurs as Re' increases beyond a value greater than 1 and that virtually all of the flow paths within a column become turbulent as Re' exceeds a value of 10 (2).
Solute band broadening relative to column retention is measured as the height equivalent to a theoretical plate (H). Typically, H increases from a minimum as the mobile phase velocity increases as long as the flow remains laminar. As the flow becomes turbulent through more and more channels in the packed column, H begins to decrease and reaches a minimum when all of the flow paths in the column become turbulent. Compared to flow through a straight hollow tube, transition from laminar to turbulent flow is much more gradual in a packed column as the flow rate increases.
General Chromatography Considerations
Early attempts to decrease the analysis time in chromatography have been thwarted by the existence of an apparent optimum mobile-phase velocity, and consequently a perceived fixed analysis time (3–7). Increasing the mobile-phase velocity above this optimum reduces the performance of the chromatographic system, which is not always acceptable (3). Experimental evidence and a sound theoretical understanding of the processes of band broadening that occurs within a chromatographic system have meant that these ideas were never seriously challenged, leaving chromatographers with a very limited range of flow rates that could be utilized around an optimum linear flow velocity.
To better understand why it was assumed an optimum flow rate existed for performing a chromatographic separation it is necessary to identify the varying band broadening processes that can occur. As early as 1956, van Deemter (4) identified the three major contributing factors that result in band broadening in chromatography. These factors, which resulted in poor resolution of components due to broader peak shapes, were encapsulated within the van Deemter equation. This equation is a theoretical treatment of the peak broadening within a chromatographic column:

where h is the reduced plate height, a dimensionless measure of the band broadening; A, B, and C are constants; and v is the reduced velocity, given by

where

is the average mobile-phase velocity; t0 is the time for unretained totally permeating peak; and Dm is the diffusion coefficient of analyte in the mobile phase.
This equation is clearly dependent on the reduced velocity through the column with an optimum value being obtained when

which on rearrangement and assigning suitable boundary conditions produces the following equation (8):

This relationship assumes that the three constants are independent of the reduced velocity. There have been numerous investigations into the band-broadening processes involved within a chromatographic system. Although many authors have advanced the understanding beyond that of the original work of van Deemter, this does provide an ideal starting point to further the understanding of how the hydrodynamics of the mobile phase affect the performance of the chromatographic system.
The A term is generally referred to as the tortuosity factor and relates to the various paths that are available through a packed bed (9–11). It accounts for the variable, unequal pathways around the stationary phase particles or support material. This term is affected by the particle size with smaller, more uniform particles producing less band broadening. The A term can be reduced by better packing processes and by using smaller uniform particles, as these give less variation in the pathlength.
The B term relates to the diffusion of the molecules in a longitudinal direction and describes the band-broadening processes resulting from the random motion of the solute molecules in the mobile phase as they travel through the column (12). The effect of the B term is flow dependent and also is reliant on the nature of the mobile phase and the analyte under study. At lower flow rates the effect of longitudinal diffusion is more pronounced, resulting in a greater band broadening of the peak.
The C term relates to the mass transfer of the analyte through the mobile phase and to the stationary phase, and any subsequent diffusion on the surface. Much theoretical work has been performed on the exact determination of this phenomenon (2,13–15). In the original text, van Deemter proposed that this was a single term related solely to the mass transfer to the stationary phase. Subsequent investigations have shown that this term can be split into two distinct processes: mass transfer through the mobile phase and mass transfer from the mobile phase to the stationary phase. Application of the C term is responsible for the sample cleanup properties associated with turbulent flow chromatography.
To understand the turbulent flow process one starts by evaluating Golay's equation (16), which is used for dispersion in an open tubular system. The general equation is given by

where h is the reduced plate height, a measure of the spreading of the analyte component in the column; B is a diffusionally-related constant; Cm is a mass transfer constant relating to effects occurring in the mobile phase; and Cs is a mass transfer constant relating to the effects occurring on or near the stationary phase.
Golay's equation defines the behavior of an open-tubular chromatographic system under laminar flow conditions. Under these conditions a parabolic radial velocity profile can be assumed. Diffusional processes dominate mass transfer within the mobile phase. These fundamental concepts form the basis of Golay's treatment of the band-broadening phenomenon seen within an open tubular system. However, under turbulent conditions the radial velocity profile is no longer parabolic but becomes velocity dependent (17) and radial transfer is reliant on convection because of the spontaneous formation of eddies, although diffusional processes still do occur within this environment. There have been several studies of band dispersion in turbulent flow (18–20). Early work indicated how turbulence affected the mass transfer (21), and although computational models have developed substantially since these early days, they are still applicable and give a good understanding of how mass transfer effects are substantially reduced by moving to a turbulent flow regime.
To account for turbulent effects it is necessary to expand the two mass transfer terms:


where I11, I12, and I13 are integrals relating to the parabolic radial flow profile of the mobile phase; and k is the capacity factor, a dimensionless quantity proportional to retention time.
There has been much discussion relating to the exact nature of the terms (2,16–18) in Golay's equation, but it is generally agreed that it forms a reasonable representation of events in a laminar and in a turbulent flow open tubular system (22).
Unlike a laminar flow system where it is relatively easy to define an exact equation for the parabolic flow profile and the integrals are a well-known solution (16), in a turbulent system this is more difficult to do. As the flow rate increases, the flow profile changes. The flow profile describes variation in the dispersion coefficients of the analyte, and the variation in velocity profile, radially. In a turbulent flow system the velocity profile is much flatter than in laminar form and so is the dispersion variation. This results in greater mass transfer within the mobile phase, which reduces band broadening. It does not affect the mechanism of band dispersion caused by stationary phase effects, and for turbulent flow chromatography to be effective, stationary phase interactions must be kept small (23).
Theoretical Application
Examination of the van Deemter equation (4) shows that at higher flow rates, under laminar flow conditions, band broadening is increased due to mass transfer effects. This term in the equation can be expanded to include two distinct phenomena; the transport of mass across the fluid flow, and the diffusion into and out of the pores at the surface of the stationary phase. Under turbulent conditions there is an increase in the ability of the mobile phase to transport mass radially. Experimental evidence (10,11,32) has shown that this effect is observable under experimental conditions, and that band broadening can be reduced with increasing flow. The diffusion of the various sample components into the pores is considered a separate process to the transport within the bulk of the mobile phase in turbulent conditions. Because this is a diffusional process, bulk flow turbulence will not be felt within the pores and adjacent to the surface of the stationary phase. In this case, the driving force for mass transfer will be the concentration gradient coupled with the molecular mass of the compound diffusing across the concentration gradient.
According to Fick's law (24) of diffusion, the number of molecules moving across the concentration gradient in a radial direction, r, is given by

where J is the flux of molecules to the surface of the stationary phase and D is the diffusion coefficient.

is the concentration gradient in the vicinity of the stationary phase. And where a reasonable approximation of the diffusion coefficient (25) is given by

where k is a constant incorporating temperature effects and a collision cross section. However, this term does not incorporate any bonding interactions. m is the mass and D is the diffusion coefficient.
It can be seen from the turbulent flow profile that the concentration close to the surface varies considerably, and that there will be a significant concentration gradient. Because this is one of the driving forces for the diffusion of molecules to the surface of the stationary phase, initial conclusions imply that under turbulent flow conditions, not only is there efficient mass transfer in the bulk flow, resulting from the existence of turbulent eddies, but that the increase in concentration gradient also ensures that there is better mass transfer at the surface and within the pores. Increasing the mass will reduce the flux of molecules across the boundary layer and into the pores. Thus, small molecules, like pharmaceutical drugs, will cross the boundary layer quicker than large molecules such as proteins. Optimal choice of the hydrodynamic conditions will ensure that there is sufficient time in the column for diffusion of smaller molecules into the pores and to the surface, whereas much larger molecules will not have the time to diffuse across the boundary layer into the pores before being eluted from the column.
Experiment Applications
Quinn (26–28) was the first to take advantage of the theory outlined above. Quinn recognized that by constructing a column with the proper particle size and internal diameter and running at the right flow rate, one would be able to separate small molecules from the large macromolecules. The small macromolecules would be retained on the stationary phase because they had high enough mass transfer coefficients to overcome the eddies created in the turbulent flow, and the large macromolecules would not be able to move into the pores of the station phase before being washed to waste. Because primary matrix interferences in a biological system are caused by the large amount of proteins present, the separation of proteins in the biological matrix from the analyte of interest is the goal of on-line sample cleanup methods.
To achieve turbulent flow velocities at reasonable flow rates, the turbulent flow columns (TurboFlow, Thermo Fisher Scientific) contain larger particle size than those used in normal high performance liquid chromatography (HPLC) columns. Particle sizes range from 50 to 80 µm depending on whether polymer or silica is used. The original turbulent flow columns had dimensions of 50 mm × 1 mm and needed flow rates of 4–5 mL/min to achieve turbulent flow. However, 50 mm × 0.5 mm columns are available that achieve turbulent flow at 1–2 mL/min flow rates and are the most common size used today. The stationary-phase choice should be based on the analyte of interest and covers the most common ones found in the literature. A list of available turbulent flow columns is shown in Table I. (The TurboFlow columns are only available for use on Transcend TLX systems with Aria OS [Thermo Fisher Scientific]).
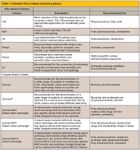
Table I: Turbulent flow column stationary phases
Although the calculations would be quite labor intensive to predict the actual molecular weight one would expect to be excluded from the pores of any given column, a simple empirical approach was taken to evaluate what to expect from turbulent flow columns. Nine proteins ranging in size from 1000 to 70,000 Da were injected onto a turbulent flow column connected to a six-port valve. During sample cleanup the flow was made turbulent and was washed to waste. After the cleanup step was complete, the valve was switched and the mobile phase was backflushed onto an analytical column where a gradient from 0 to 100% organic solvent was used to measure the amount of protein retained on the column using a UV detector. A union was used instead of the turbulent flow column to measure the signal from 0% retention. The three most common turbulent flow columns found in the literature (Cyclone-P, C18 XL, and C8 XL) were used and the experiment was conducted at pH 3.5 and pH 8.5. Figure 1 illustrates the percent of compound excluded from a turbulent flow column as a function of molecular weight for the nine proteins as a function of flow rate. A cumulative Gaussian fit was used to extrapolate the point where 99% exclusion from the column occurs. For flow rates of 2.0, 1.75, 1.5, 1.25, and 1.0 mL/min, the calculated molecular weights where 99% exclusion occurs are 8.7, 12.1, 13.0, 13.6, and 15.0 kDa respectively. The correlation coefficients (r2 ) ranged from 0.9408 to 0.9934. The data clearly demonstrate that as the flow rate increases, compounds with lower molecular weights are excluded from the column; just as the theory predicts. The data represent a composite of all the measurements because, within experimental error, there were no differences observed. The fact that the stationary phase chosen did not impact the observed exclusion demonstrate that the result is due to the turbulent flow and not the stationary-phase composition.
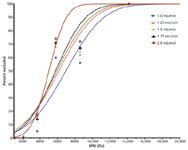
Figure 1: Percentage of compound excluded from a turbulent flow column as a function of flow rate (29).
Unfortunately, one of the biggest misunderstandings involving the use of turbulent flow chromatography came from the way it was portrayed in the literature. Most users were quite familiar with extraction techniques so it was easier to define turbulent flow columns that way. However, while from a strict syntax point of view this is correct, extraction in scientific terms is defined as a partitioning between two phases governed by a thermodynamic equilibrium that is described by the partition coefficient between the phases for a given analyte. Turbulent flow chromatography is a two-dimensional chromatographic separation in which one dimension is the same as normal HPLC and the second is based on mass as a consequence of the turbulent flow. Because of this difference turbulent flow chromatography is often compared directly to other extraction methods even though the processes are completely different. To illustrate this point the same experiment was conducted on a solid-phase extraction (SPE) column (Oasis HLB, Waters, Milford, Massachusetts) and a restricted access media (RAM) column (Shim-pak -ODS[G], Shimadzu, Columbia, Maryland). The SPE column uses partitioning between the mobile and stationary phase to achieve separation but anything with similar characteristics to the analyte of interest will not be separated and the molecular weight of the compound is irrelevant. RAM columns should perform similarly because they use restricted pores to effect a size exclusion from the stationary phase. Figure 2 compares the molecular weight exclusion of the various on-line cleanup columns run under the same conditions (1.5 mL/min). The data clearly demonstrate that turbulent flow chromatography is the most efficient method for removing matrix proteins. In fact, reading the literature one often finds that the users of SPE and RAM columns state that the columns work much better at elevated flow rates (>2 mL/min). We believe that the higher flow rates achieve turbulent flow in these columns and, as a consequence, they perform better. However, the turbulent flow columns achieve this at normal flow rates (1 mL/min) because that is what they are designed to do.
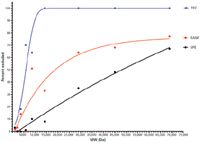
Figure 2: Comparison of turbulent flow chromatography (TFC), restricted access media (RAM), and solid-phase extraction (SPE) cleanup columns as a function of the molecular weight excluded during sample clean-up (29).
Another often used mechanism for removing proteins from a biological matrix is to perform a protein precipitation or crash by the addition of organic solvent or changes in pH. The samples that result from this procedure must be filtered, or centrifuged and the supernatant removed, before the samples are injected onto an HPLC system. This adds additional steps to the process because it cannot be done on line. In addition, there are still many components that can cause interference remaining in solution after the crash has occurred. However, the biggest concern when conducting LC–mass spectrometry (MS) quantitation no matter what cleanup method is used is the amount of ion suppression observed. Ion suppression during an LC–MS run can easily be identified by adding the analyte of interest postcolumn and injecting neat matrix that has been subjected to whatever sample preparation is going to be used through the system. Figure 3 compares the amount of ion suppression observed after protein precipitation, SPE, and turbulent flow chromatography (30) for K252a, a kinase inhibitor. It is clear that protein precipitation leaves many ion suppressors behind and that although SPE is very good, turbulent flow chromatography is the cleanest.
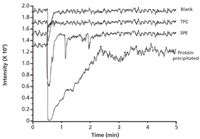
Figure 3: Ion suppression effects from, blank injection (50:50 methanolâwater), injection of protein precipitated rat plasma (4:1 methanolâplasma, centrifuged), injection of extracted rat plasma in 50:50 methanolâwater, and turbulent flow chromatography of neat rat plasma (31).
Although turbulent flow chromatography is extremely good at removing compounds above 8000–10,000 Da and the majority of matrix interference comes from these compounds (like serum albumin in plasma), there are still many bad actors within a biological matrix to be concerned about. For example, fatty acids are also a major concern in LC–MS and are small enough not to be removed by turbulent flow chromatography. Fatty acids need to be handled though the second dimension of the turbulent flow column, which is the choice of stationary and mobile phases and follows typical HPLC separation dynamics.
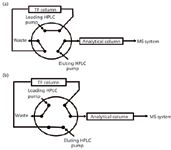
Figure 4: Dual-column method configuration: (a) sample load and cleanup and (b) sample elute (30).
Practical Applications
Because turbulent flow columns are designed with larger particles to promote the formation of turbulence, they have lower theoretical plate numbers then normal HPLC columns and do not give the best chromatographic separations. For this reason, two column methods are preferred in most cases, though single-column methods exist. For two-column approaches, sample matrices are injected directly onto the HPLC system and samples are cleaned up on-line; the analyte is retained on the turbulent flow column and the unretained material is washed to waste. After the analyte of interest has been removed from the sample matrix, the analyte is eluted to a second analytical column for analysis. Careful pairing of the retentive properties of the turbulent flow and analytical columns — so that the mobile-phase composition elutes the sample from the turbulent flow column but captures the sample on the analytical column — is needed to take advantage of the analytical column. These on-line methods have the advantage of direct injection and elution of the analyte, which removes the time-consuming off-line steps of evaporation, reconstitution, and preparation. Therefore, on-line methods are more efficient, fully automated and require far less consumables then their off-line counterparts. An example of a two-column on-line turbulent flow configuration is shown in Figure 4. An example of the improved data quality produced by turbulent flow columns is shown in Table II (32). Using the same columns, mobile phases and gradient elution, either a union or a Cyclone-P 50 mm × 0.5 mm turbulent flow column was used before a C18 analytical column to measure the standard curve of K252a from three replicate injections. Rat plasma was spiked with K252a at 1 mg/mL and serially diluted with rat plasma to make each calibrator. The samples were then spiked 2:1 with acetonitrile containing internal standard, vortexed, centrifuged, and 10 µL was injected for analysis. A 30-s cleanup step at 1.5 mL/min with 100% aqueous solvent was used before gradient elution from 0% to 95% acetonitrile over 2 min at a flow rate of 700 µL/min. It is easy to see that the additional cleanup of sample provided by the turbulent flow column greatly enhanced the quality of the data.
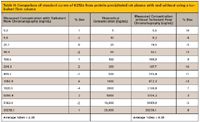
Table II: Comparison of standard curves of K252a from protein-precipitated rat plasma with and without using a turbulent flow column
Isocratic focusing is often used to gain better peak shape with dual-column methods. In this case the organic solvent used to elute sample from the cleanup column is connected via a tee into an aqueous LC flow from a second pump to reduce the amount of organic solvent the analytical column sees during the transfer step. The samples are focused at the head of the analytical column by the isocratic aqueous makeup flow from the second pump, which makes hydrophilic compounds easier to capture. Figure 5 illustrates the configuration used for "isocratic focusing." The advantage of the isocratic focusing approach is that the turbulent flow and analytical columns can have the same stationary phase, which makes methods far easier to develop; however, it needs more-complex valving and a second HPLC pump. An example of the improvement in the chromatographic data achieved with and without a turbulent flow column using isocratic focusing is shown in Table III (32). In this case, using the same columns and mobile phases to evaluate K252a in rat plasma as before, 10 replicate injections over the lifetime of the turbulent flow column were made and compared to no isocratic focusing at the beginning. When no isocratic focusing was used, a gradient from 0% to 100% acetonitrile over 2 min with a flow rate of 700 µL/min was used to elute sample from the turbulent flow column directly into the analytical column after a 30-s sample cleanup step at 100% aqueous mobile phase with a 1.5 mL/min flow rate. Isocratic focusing was performed with 60:40 acetonitrile–water at a 200-µL/min flow rate to elute analytes from the turbulent flow column, which was connected by a tee to a 100% aqueous flow at 500 µL/min for 1 min after the same 30-s cleanup step; then the same 0–100% acetonitrile gradient over 2 min was used to elute sample from the analytical column. Even after 1000 injections the percent relative standard deviation (%RSD) for isocratic focusing was half that of obtained when isocratic focusing was not used.
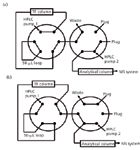
Figure 5: Isocratic focusing method configuration: (a) sample cleanup, (b) sample transfer, and (c) sample elute (30).
Another advantage of the two-column methods is that they allow the use of multiplexing, which takes advantage of the time spent cleaning one sample to elute another. Two or more injections are staggered in time, and the setup can have either a selection valve that can divert multiple HPLC systems to a single MS system or two cleanup columns; with two cleanup columns, one is flowing to waste (cleanup) while the other is flowing either directly to the MS system or to the MS system through an analytical column (analysis). Figure 6 illustrates how multiple injections can be staggered in time to increase sample throughput. Samples are eluted to the mass spectrometer only during the part of the run when the analyte of interest is being eluted. During the HPLC method, when the samples are being cleaned, columns are being washed, or the systems are being equilibrated, flows from other streams are directed to the MS system to take advantage of the time needed to perform these functions while not wasting any time on the mass spectrometer acquiring data when there is no analyte of interest being eluted.

Table III: Comparison of 10 replicate injections of 100-ng/mL K252a over time with and without isocratic focusing
There are several good reviews of turbulent flow chromatography for those interested in a more detailed account of how it is used in the literature (30,31). A representative sampling of the literature that demonstrates the wide acceptance of turbulent flow methods for pharmaceuticals, clinical, toxicology, food safety, and environmental applications is listed in Table sI (available on-line at www.chromatographyonline.com/SamplePrepMarch2012).

Table IV: Selected applications from the literature using turbulent flow chromatography

Table IV-c
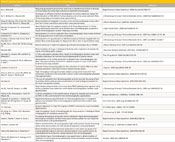
Table IV-b
Conclusion
Turbulent flow chromatography is a widely used on-line sample preparation technique for the LC–MS analysis of biological samples. The mechanism of sample cleanup is a two-dimensional chromatographic separation in which one dimension is the same as in normal HPLC and the second is based on mass as a consequence of the turbulent flow. The molecular weight removal is dependent on flow rate, particle size, and the internal diameter of the column and ranges from 8 to 12 kDa (99% exclusion) with commercially available turbulent flow columns.
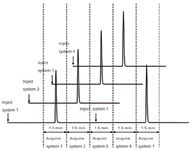
Figure 6: Staggered multiple inlet methodology (multiplexing) of several HPLC systems to a single mass spectrometer using a Transcend TLX-4 system (Thermo Fisher Scientific).
Joseph Herman is the manager of Thermo Fisher Scientific's LC–MS Clinical/Toxicology Methods Development Applications Laboratory at West Chester University of Pennsylvania. He has 25 years of experience in MS of which the last 20 years has been spent on bioanalytical LC–MS. He spent his first 20 years in the pharmaceutical industry performing structural elucidation in support of medicinal chemistry. With the development of LC–MS methodologies in the early 1980s, he became one of the lead investigators in the use of turbulent flow chromatography. In the past five years he has researched clinical applications of LC–MS employing the same approaches he pioneered using turbulent flow chromatography.

Joseph Herman
Tony Edge is currently the technical manager for the chromatography consumables division of Thermo FisherScientific. Tony has over 10 publications in refereed journals including a book chapter on turbulent flow chromatography. In 2008 he was awarded the Desty memorial lecture for his contributions to innovating separation science, and in the same year he also received a clinical excellence award from AstraZeneca. Tony's current interests include improving the extraction process and high temperature chromatography.

Tony Edge
Ronald E. Majors "Sample Prep Perspectives" Editor Ronald E. Majors is a Senior Scientist in the Columns and Supplies Division at Agilent Technologies in Wilmington, Delaware, and is a member of LCGC's editorial advisory board. Direct correspondence about this column via e-mail to lcgcedit@lcgcmag.com.

Ronald E. Majors
References
(1) J.C. Sternberg and R.E. Poulon, Anal. Chem. 36, 1492-1502 (1964).
(2) J.J. van Deemter, 2nd Informal Symposium of the Gas Chromatography Discussion Group Cambridge, 1957, quoted in Gas Chromatography, J.H. Purnell, Ed. (Wiley London, 1962), p. 128.
(3) J.J. van Deemter, F.J. Zuiderweg, and A. Klinkenberg, Chem. Eng. Sci. 5, 271 (1956).
(4) G. Guiochon, Anal. Chem. 52, 2002 (1980).
(5) J.H. Knox and M. Saleem, J. Chromatogr. Soc.7, 614 (1969).
(6) R.A. Hartwick and D.D. Dezaro, in Microcolumn High Performance Liquid Chromatography, P. Kucera, Ed. (Elsevier, Amsterdam, 1984).
(7) J.H. Knox, J. Chem. Soc., 433 (1961).
(8) J.C. Giddings, Unified Separation Science (Wiley-InterScience publications, 1991), p. 283.
(9) J.C. Giddings, Anal. Chem. 34, 1186 (1962).
(10) J.H. Knox, J. Chromatogr.A 831, 3 (1999).
(11) J.H. Knox and R.P.W. Scott, J. Chromatogr. 282, 297 (1983).
(12) G.I. Taylor, Proc. Royal Soc. A219, 186 (1953).
(13) J.C. Giddings, Anal. Chem. 35, 1338 (1963).
(14) J.C. Giddings, Dynamics of Chromatography, Part 1 (Marcel Dekker, New York, London, 1965).
(15) M. Golay, in Gas Chromatography, D. Desty, Ed. (Butterworth, London, 1958), p. 35.
(16) R.B. Bird, W.E. Steward, and E.N. Lightfoot, Transport Phenomena (Wiley, New York, 1960), Chapters 5 and 6.
(17) R. Aris, Proc. Roy. Soc. A235, 67 (1956).
(18) L.J. Tichacek, C.H. Barkelew, and T. Baron, A.I.Ch.E. J. 3, 439 (1957).
(19) R. Aris, Proc. Roy. Soc. A252, 538 (1959).
(20) T. Pretorius, and T.W. Smuts, Anal. Chem. 38, 1 (1966).
(21) J.C. Giddings, W.A. Manwaring, and M.N. Myers, Science 154, 146 (1966).
(22) C.J. Oberhauser, A.E. Niggebrugge, D. Lachance, J.J. Takarewski, M.M. Pegram, and H.M. Quinn, LCGC 18, 716 (2000).
(23) A.E. Fick, Annalen der Physik (Leipzig) 170, 59 (1855).
(24) P.W. Atkins, Physical Chemistry 2nd Edition (Oxford University Press), p. 879.
(25) H.M. Quinn and J.J. Takarewski, U.S. Patent 5,772,874, 30 June 1998.
(26) H.M. Quinn, R.A. Menapace, and C.J. Oberhauser, U.S. Patent 5,795,469, 30 August 1998.
(27) H.M. Quinn and J.J. Takarewski, U.S. Patent 5,919,368, 6 July 1999.
(28) J.L. Herman, A. Dayana Argoti, and S.J. Fair, "Molecular Weight Exclusion of Proteins Using Turbulent Flow Chromatography," Proceedings of Mass Spectrometry Applications to the Clinical Laboratory 2011.
(29) J.L. Herman, Encyclopedia of Mass Spectrometry, Volume 8, "Turbulent Flow LC-MS in Bioanalysis, Principles and Applications," W. Niessen, Ed. (Elsevier, Oxford, UK, 2006).
(30) J.L. Herman and J.M. Di Bussolo, Mass Spectrometry in Drug Metabolism and Pharmacokinetics, R. Ramanathan, Ed. (Wiley & Sons, Hoboken, New Jersey, 2008), Chapter 6.
(31) M. Martin and G Guiochon, Anal. Chem. 831(1), 3–15 (1999).
(32) J.L. Herman, Inter. J. Mass Spec., Special Issue: Drug Discovery 238(2), 107–117 (2004).

New Method Explored for the Detection of CECs in Crops Irrigated with Contaminated Water
April 30th 2025This new study presents a validated QuEChERS–LC-MS/MS method for detecting eight persistent, mobile, and toxic substances in escarole, tomatoes, and tomato leaves irrigated with contaminated water.
University of Tasmania Researchers Explore Haloacetic Acid Determiniation in Water with capLC–MS
April 29th 2025Haloacetic acid detection has become important when analyzing drinking and swimming pool water. University of Tasmania researchers have begun applying capillary liquid chromatography as a means of detecting these substances.

.png&w=3840&q=75)

.png&w=3840&q=75)


.png&w=3840&q=75)


.png&w=3840&q=75)


