Why Does an Improvement Make Things Worse?
LCGC North America
Changing to a "better" liquid chromatography column may not always produce the expected results.
Many workers today are trying to reduce the cost of liquid chromatography (LC) analyses. A change in the column size and flow rate are two adjustments that often can achieve the desired results. Shorter columns packed with smaller particles can generate the same separation in less time and save solvent costs. A smaller column diameter coupled with a drop in the flow rate also can save solvent costs. Both of these changes can increase peak height because peak volumes are reduced. Some column changes are rather benign, whereas others can cause unexpected problems, as we'll see in this month's discussion.
Reasonable Expectations
The separation, or resolution (Rs), of analytes in our sample is one important factor for a successful separation. This means that if we make changes in the chromatographic conditions, we do not want to reduce resolution. Resolution sometimes is expressed as

where N is the column plate number, or efficiency, k, is the retention factor of the first peak of interest in a peak pair, and α is the selectivity. Recall that k is calculated from the column dead time, tO, or solvent front and the retention time, tR:

Selectivity is simply the ratio of k-values for two adjacent peaks, k1 and k2:

As long as we don't change the chemistry of the system (k and α) or reduce the plate number (N), we should maintain resolution. The mobilephase chemistry (solvent composition), column chemistry and column temperature are the major factors controlling chemistry in reversedphase separation. This means that if we substitute one column for another, it needs to have the same chemistry — that is, the same packing material from the same manufacturer, although the size of the particles can be changed. Similarly, no changes in the mobilephase composition or temperature can be made. Flow-rate changes will not have a major effect on resolution in most cases. These changes are fairly straightforward for isocratic separations, but when gradients are used more care needs to be taken because unless compensating changes are made, a change in column dimensions or flow rate can change the separation for a gradient method. We will assume isocratic separations here — those with a constant mobile-phase composition.
So, what can we change when all these restrictions are in place? As long as N is kept constant (or increased), the resolution should not be reduced if the chemistry factors are kept constant. From a practical standpoint, N is most influenced by the column length and the particle size of the packing material. This means that we can often speed up the separation by using a shorter and smaller-particle column with the same plate number as the original one. Because the separation time is shortened, less solvent will be used if the flow rate is the same. Another easy change is to adjust the column diameter. If the flow rate is reduced in proportion to the reduction in the crosssectional area of the column, retention and resolution should stay constant, but the solvent consumption should be reduced.
Ideally . . .
First, let's look at what can happen if everything works as planned. For this we'll compare the results from the most widely used column configuration, a 150 mm × 4.6 mm column packed with 5-µm particles, with a shorter, smallerparticle column of the same diameter (a 100 mm × 4.6 mm, 3-µm column) and with a narrowerdiameter version of the 3-µm column (100 mm × 2.1 mm, 3 µm). I've used DryLab software (Molnar Institute, Berlin, Germany) to model the results with these columns with anthracene as a solute. These columns give approximately the same plate numbers of ≈ 10300 for the 5-µm column and ≈ 13800 for the 3-µm counterparts; with the same column and mobile-phase chemistry, we should expect the resolution to be approximately the same.

Table 1: Influence of extracolumn band-broadening on different column configurations.
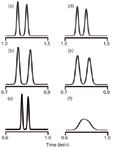
I've chosen peaks with k-values of 0.5, 1, 2, 5 and 10 for comparative purposes and summarized some results in Table 1. When the 150 mm × 4.6 mm, 5-µm column is replaced by the 100 mm × 4.6 mm, 3-µm column at the same flow rate (2 mL/min), we expect the retention times to be reduced by the ratio of the column lengths. Thus 100 mm/150 mm = 0.67, so the retention time of the last peak should change from 8.4 min to (8.4 × 0.67) = 5.6 min, and that is what we see in Table 1. This means that we save about one-third of the run time and one-third of the solvent expense with no penalty in resolution. To compare resolution for the different columns, I've chosen a worst-case scenario by using the k = 0.5 peak and added a peak just after it with a retention time adjusted so that RS = 2.0 under ideal conditions. You can see in Figures 1(a) (150 mm, 5 µm) and 1(b) (100 mm, 3 µm) that the separations are all the same, with a small section of flat baseline between the peaks, as is expected for RS = 2.0 (note that the time scale differs between columns).

Figure 1
The second change is to reduce the column diameter from 4.6 mm to 2.1 mm. When a columndiameter change is made, it is best to adjust the flow rate to keep the linear velocity constant; if this is done correctly, the retention times and pressure should not change. The linear velocity of the solvent passing through the column will be proportional to the crosssectional areas of the two columns, or the square of the ratio of the diameters. Therefore, the ratio of (4.6 mm/2.1 mm)2 = 4.8 should be used to adjust the flow rate. For practical purposes you can round this to a value of 5, which is easy to remember, but here I used the factor of 4.8. So the original 2 mL/min flow rate should be adjusted to 2.0/4.8 = 0.42 mL/min. (If you are trying to reproduce any of the calculations presented here, please realize that I've rounded the values in the text for clarity.) Figure 1(c) shows a similar separation under these conditions. Also, note that the retention times in Table 1 for the 100 mm × 4.6 mm and 100 mm × 2.1 mm column are the same, confirming that we've made the adjustment correctly. There is no time savings with the diameter change, but we do save solvent. The last peak with k = 10 is eluted at 5.6 min (Table 1), thus 5.6 min × 2 mL/min = 11.2 mL of solvent is used for the separation on the 4.6 mm column, but only 5.6 × 0.42 = 2.4 mL on the 2.1-mm column, a reduction in solvent consumption of 4.8 times.
Unfortunately . . .
Ideal doesn't exist in most of our laboratories, so we need to consider what can happen under realistic conditions. Column manufacturers have refined their column-preparation techniques so that it is reasonable to expect very similar column chemistry between columns of different dimensions and packing particle sizes from the same series of packing material. Also, if you are careful, you can control the mobile-phase chemistry and column temperature so these variables should not be an issue. One factor that often appears as a problem when scaling columns is extracolumn volume contributed by the LC system hardware. This volume comprises the volume contributed by the connecting tubing between the autosampler and column, between the column and the detector, any "unswept" volumes in the flow path, the injection volume (and sometimes the injection solvent) and the detector cell volume; the detector time constant and data system data-acquisition rate are also factors in scaling columns. For the present discussion, we'll combine these into one number, the extracolumn volume, σec. For conventional LC systems that are normally used with 150 mm × 4.6 mm, 5-µm columns, we can assume a value of σec = 15 µL as fairly typical if reasonable care is taken with the plumbing.
In simple terms, we observe a total peak width in the chromatogram, wT, measured at the baseline between tangents drawn to the sides of the peak, or sometimes at half the peak height. This total width has two major contributions — the broadening that takes place inside the column, generating the column contribution to width, wc, and the contribution to peak width by extracolumn effects, wec. The peak width can be calculated as

Let's see if a calculated value of wT agrees with observations; I'll use the k = 1 peak for the 100 mm × 4.6 mm, 3-µm column from Table 1 as an example. First, we need to convert σec = 15 µL into time units by adjusting for the flow rate: 0.015 mL/(2 mL/min) = 0.0075 min. We'll also assume that the peak is Gaussian in shape, so the width between tangents at baseline is 4σ, so wec = 4 × 0.0075 = 0.03 min. The peak width in the absence of extracolumn effects is 0.035 min (Table 1), so wT = (0.0352 + 0.032 )0.5 = 0.046 min, which is just what we observe in Table 1. (Please realize that this "proof" is a bit circular, because DryLab used the same procedure to generate the widths of the broadened peaks, but the same procedure works with real chromatograms too.)
As you might expect, when peak volumes get smaller, the effect of a constant extracolumn volume will be more significant. You can see this by comparing data in Table 1 in two different ways. For each column listed, there are peaks with five different k-values. The larger the k-value, the wider the peak, because of normal band-broadening processes that go on inside the column. As wc gets larger, the influence of a constant wec is less, so the percentage increase in peak width drops as peaks are more strongly retained (right-hand column of data in Table 1). Or another way of looking at this is that early-eluted peaks are much more susceptible to extracolumn bandbroadening; one way to minimize such problems is to make sure the first peak of interest is well-retained. The second way that peaks are influenced more strongly by extracolumn effects is if the peak is made narrower by reducing the column volume, thereby reducing the peak volume. This is seen in Table 1 for both the shortening of the column from 150 mm to 100 mm and the reduction of the column diameter from 4.6 mm to 2.1 mm. These effects are readily observed by comparing the chromatograms on the right side of Figure 1 with the ideal separations on the left side. The normal σec = 15 µL has only minor detrimental effects for the 4.6-mm i.d. column because the peak volumes are still fairly large. In the case of the 2.1-mm i.d. column, there is a drastic reduction in normal peak volume, and for the k ≈ 0.5 peak pair, the separation is completely lost because of peak broadening. You can now understand why columns < 100 mm, particle sizes < 3 µm and column diameters < 4.6 mm, either alone or in combination, can be particularly difficult to obtain optimum results on unless equipment modifications are made or a new low-volume LC system is purchased.
Measuring Extracolumn Volume
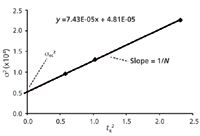
Although a value of σec = 15 µL is "typical," it is a good idea to know what σec is for your LC system. The measurement is not difficult, but it does take a bit of work. First, you need to obtain data, such as that of Table 1, with peaks at different retention times. This should be done with a well-behaved sample, such as aromatic compounds without ionic functional groups; here, I adjusted the percent acetonitrile in the mobile phase to get data for anthracene at different retention times. Then make a plot of retention-time squared versus σ2, as in Figure 2. Recall that the standard deviation of the peak, σ, can be obtained from the peak width: wT = 4σ if wT is the baseline peak width measured between tangents drawn to the sides of the peak. The y-intercept is σec2 and the slope of the line is 1/N. (I'll leave you to do the math here, but N = 16 (tR/wT)2 = (tR/σ)2 .) The regression equation shown in Figure 2 is for the 100 mm × 4.6 mm, 3-µm column, using all five data points; for visual clarity, the plot itself is only drawn for k = 0.5, 1.0 and 2.0. In this case, the data from the y-intercept give us σec = (4.81 × 10⁻⁵ )0.5 = 0.0069 min × 2 mL/min = 14 µL. This is very close to the σec = 15 µL used to generate the data. And from the slope, N = 1/(7.43 × 10-5 ) = 13460; the average value of N reported by DryLab for these data was 13830, a trivial difference. You can perform a similar exercise based on data obtained from your LC system and estimate σec for your LC hardware.

Figure 2
Conclusions
Sometimes the results we obtain from "improvements" in chromatographic conditions can be a bit baffling. In this discussion, we've seen how extracolumn volume in the LC system can broaden peaks in the chromatogram. This is especially a problem when the peaks have small volumetric peak widths, such as those obtained with short, narrow, or smallparticle columns. The examples shown here were for common columns of 150- or 100mm length, 4.6- or 2.1mm internal diameter and 5- or 3-µm particle diameter. The negative impact of extracolumn volume will be amplified even more when shorter, narrower or smallerparticle columns are used, as might be the case for ultrahighpressure LC (UHPLC) conditions. Sometimes extracolumn volume can be reduced to an acceptable amount by plumbing adjustments, but in other cases, a new LC system with lower inherent extracolumn volume may be required.
"LC Troublshooting" editor, John W. Dolan, is vice president of LC Resources in Walnut Creek, California, USA. He is also a member of LCGC's editorial advisory board. Direct correspondence about this column should go to "LC Troubleshooting", LCGC Europe, 4A Bridgegate Pavilion, Chester Business Park, Wrexham Road, Chester, CH4 9QH, UK or email the editor, Alasdair Matheson, at amatheson@advanstar.com

Detecting Hyper-Fast Chromatographic Peaks Using Ion Mobility Spectrometry
May 6th 2025Ion mobility spectrometers can detect trace compounds quickly, though they can face various issues with detecting certain peaks. University of Hannover scientists created a new system for resolving hyper-fast gas chromatography (GC) peaks.
University of Oklahoma and UC Davis Researchers Probe Lipidomic Profiles with RP-LC–HRMS/MS
May 6th 2025A joint study between the University of Oklahoma Health Sciences Center (Oklahoma City, Oklahoma) and the UC Davis West Coast Metabolomics Center (Davis, California) identified differentially regulated lipids in type 2 diabetes (T2D) and obesity through the application of reversed-phase liquid chromatography-accurate mass tandem mass spectrometry (RP-LC-accurate MS/MS).
Automated Sample Preparation (ISO 20122) for MOSH/MOAH in Seasoning Oils
May 6th 2025This work presents an Automated Sample Preparation procedure for MOSH/MOAH analysis of Seasoning Oils. We compare results from a manual epoxidation procedure compliant with DIN 16995 with results based on fully automated sample preparation (epoxidation and saponification) compliant with ISO 20122. In both cases, online clean-up via activated aluminum oxide (AlOx) are used to remove interfering n-alkanes from the MOSH fraction during the HPLC run. Automated data evaluation using a dedicated software (GERSTEL ChroMOH) is presented.

.png&w=3840&q=75)

.png&w=3840&q=75)


.png&w=3840&q=75)


.png&w=3840&q=75)


