Speciation Analysis of Mercury in Sediments by Using HPLC Hyphenated to Vapor Generation Atomic Fluorescence Spectrometry Following Microwave-Assisted Extraction
LCGC North America
This validated method is faster and simpler than other approaches, and detection limits are comparable.
A method using high performance liquid chromatography (HPLC) coupled with vapor generation atomic fluorescence spectrometry (VGAFS) has been developed for the separation and determination of mercury species in sediment samples. The method is based on the extraction of samples using 0.1% (v/v) 2-mercaptoethanol as the only extractant. The separation and determination of mercury species was achieved by direct injection of the extractant to the HPLC–VGAFS system. Extraction conditions were optimized, and extraction efficiency was validated against an established method, with RSD below 8%. Three mercury species including inorganic mercury (Hg2+), methylmercury (MeHg+), and ethylmercury (EtHg+) were baseline separated using reversed-phase C18 columns with a mobile phase of 3% (v/v) acetonitrile containing 60 mM ammonium acetate-acetic acid (pH 4.5) and 0.1% (v/v) 2-mercaptoethanol pumped at 2.0 mL/min-1. At optimized conditions, the limit of detection was 0.58 ng/g for MeHg+, 1.1 ng/g for EtHg+ and 0.48 ng/g for Hg2+. The average recoveries were 96.2% (MeHg+), 88.7% (EtHg+), and 95.8% (Hg2+) by spiking three concentration levels of mercury species into samples. The developed method was validated by the determination of certified reference materials and was further applied in analyses of sediment samples from the Sichuan area in China.
It is well known that the toxicity, biogeochemical behavior, and transportation of mercury in the environment are heavily dependent on its chemical form (1,2). Methylmercury (MeHg+), the most toxic among mercury species, has been found in sediments from areas polluted by mercury because many micro-organisms are involved with sulfate-reducing bacteria and have the ability to methylate the inorganic mercury. The determination of mercury species in sediments is among the most required analysis in environmental studies, not only because of the toxicity of mercury, but also because it is a good indicator of anthropogenic pollution sources (3) and enables scientists to identify locations where MeHg is formed. Our research is focused on the development of simple, fast, and robust methods for the analysis of mercury species in sediment samples.
The most common methods of mercury speciation are gas chromatography (GC) (2,4), high performance liquid chromatography (HPLC) (2,4–6), ion chromatography (IC) (7–9), and capillary electrophoresis (CE) (10,11) coupled with a mercury-specific detector, such as atomic absorption spectrometry (AAS) (2,4,5,12,13), atomic fluorescence spectrometry (AFS) (2,4,5,14–17), inductively coupled plasma–mass spectrometry (ICP-MS) (7,16,18,19), inductively coupled plasma–atomic emission spectrometry (ICP-AES) (20,21), and microwave-induced plasma atomic emission spectrometry (MIP-AES) (2,4,22). Only a few mercury speciation techniques have been reported that do not incorporate chromatographic separation procedures into these atomic spectrometry techniques (23–25).
Even though GC has been used to separate inorganic and organic mercury, this technique requires chemical derivatization of mercurials into nonpolar, volatile, and thermally stable derivatives before GC separation, which is laborious and time-consuming. In addition, interconversion of mercury species resulting from the high column temperature also may provide erroneous results (26). CE combines rapid separation with high efficiency and very small sample volumes. However, sample requirements and inferior detection limits render it unsuitable for analyzing most real-world samples (27). HPLC using reversed-phase chromatography (26,28–30), which is based on the introduction of complexing agents, such as sodium, ammonium pyrrolidine dithiocarbamate, or sulfhydryl-containing modifiers to the mobile phase (31–35), has been developed in both isocratic and gradient modes for the separation of inorganic and organic mercury. Therefore, HPLC is considered the method that is least prone to species conversion and that allows the most expedient separation of these mercurial species.
The determination of ultratrace levels of mercury using atomic optical or mass spectrometry methods requires the assistance of vapor generation (VG) techniques to separate the analyte from the complex matrix, reduce interferences, and improve detection sensitivity and selectivity (36). Among the reported chemical VG methods, SnCl2 and NaBH4 are the most frequently used reductants for the determination of mercury. However, according to Bramanti and colleagues (37,38), the vaporization efficiency of Hg2+ could be severely suppressed because of the formation of thiol complexes and a molar excess of NaBH4. To minimize the adverse effects resulting from a thiol-containing effluent, Bramanti (39) suggested using an oxidation system to convert various mercurial thiol complexes to Hg2+ before NaBH4 reduction. Presently, chemical oxidation and UV irradiation techniques for on-line postcolumn oxidation of mercury compounds have been reported using various oxidants, including KBr/KBrO3 (40), K2S2O8 (41,42), and K2Cr2O7 (43–45).
Despite the excellent sensitivity and selectivity provided by most of the analytical techniques, sample preparation has been, and continues to be, the primary concern in mercury speciation analysis. A reliable, simple, and rapid extraction method for the determination of mercury species in complex matrices is of considerable interest. Although complexes of mercury species with 2-mercaptoethanol are widely used in reversed-phase separation because of its chemical structure, until now the reagent was not solely used for extraction of mercury species in any solid sample.
The aim of this study was to develop a simple, sensitive, and robust analytical method that would enable the speciation and analysis of inorganic mercury (Hg2+), methylmercury (MeHg+), and ethylmercury (EtHg+) in sediments. The extraction procedure was performed in a closed-vessel microwave-assisted extraction (MAE) system using 2-mercaptoethanol as the only extractant. The separation and determination of mercury species was achieved by direct injection of the extractant to a HPLC–VGAFS system. The application of 2-mercaptoethanol for mercury species extraction from sediments has been found to be a very advantageous idea. This method was much more simple and rapid compared with others. The accuracy of the method was tested against a set of certified reference materials, and its applicability was validated against a wide number of natural sediments collected from Sichuan, China.
Experimental
Instrumentation
A schematic view of the HPLC–VGAFS system used in this work is presented in Figure 1, including a reversed-phase HPLC system for the separation of different mercury species and a VGAFS system for element-specific detection. Samples were injected using a Rheodyne model 7725i injection valve with a 500-µL sample loop (Rheodyne, now part of IDEX Health & Science, Oak Harbor, Washington), and the mobile phase was delivered by an LC-20AT HPLC pump (Shimadzu, Kyoto, Japan). The HPLC separation of mercury species was achieved using a 150 mm × 4.6 mm, 5-µm Venusil MP-C18 reversed-phase column (Bonna-Agela Technologies Inc., Wilmington, Delaware) at room temperature under isocratic conditions. The separated mercury species eluted from the HPLC column were oxidized to inorganic mercury by wet chemical oxidation (potassium persulfate) and UV irradiation (UV-C lamp, 15 W, Huadeng, Taipei, China) in an oxidation reaction coil. The reducing agent (potassium borohydride) and the carrier solution (hydrochloric acid) were pumped and mixed with the solution flowing from the oxidation reaction coil into the reduction reaction coil. The mixture was then pumped to a gas–liquid separator cell. An argon stream as a carrier flow stripped the elemental mercury from the solution, into the AFS detector (AFS-9130, Titan, Beijing, China). The experimental conditions for the HPLC–VGAFS method are listed in Table I.

Figure 1: Schematic diagram of the HPLCâVGAFS system employed for the speciation analysis of mercury in sediments.
Sediment samples were extracted using a microwave system (Discovery S, CEM, Matthews, North Carolina). The microwave system used a noncontact, infrared sensor to measure temperature, which was programmable from 0 °C to 300 °C.
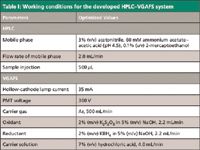
Table I: Working conditions for the developed HPLCâVGAFS system
Reagents
All reagents were of the highest available purity and at least of analytical grade. All solutions were prepared in ultrapure water with a resistivity of 18.2 MO·cm obtained from a Milli-Q Integral 3 system (Millipore, Bedford, Massachusetts).
2-Mercaptoethanol (≥98%) was purchased from Beyotime (Haimen, China). Acetonitrile, ammonium acetate, acetic acid, and n-butanol (HPLC grade) were purchased from Tedia (Fairfield, Ohio). Hydrochloric acid (GR), potassium borohydride (KBH4) (AR), sodium hydroxide (GR), and potassium persulfate (K2S2O8) (AR) were purchased from Kelong (Chengdu, China). A 10-mg/L Hg2+ standard solution in 10% (v/v) HNO3 was obtained from Merck (Darmstadt, Germany). Methylmercury chloride (MeHg+) and ethylmercury chloride (EtHg+) were purchased from Dr. Ehrenstorfer (Augsburg, Germany). Standard solutions of MeHg+ and EtHg+ (10 mg/L) were prepared in methanol. Calibration solutions were prepared daily by sequential dilution of the standard solutions.
Glassware and microwave vessels used for the analysis were first dusted lightly with sulfur powder on the surface, eliminating the possible volatilization of Hg, then cleaned with tap water and left in a 50% nitric acid bath for at least 24 h. Afterwards, they were thoroughly rinsed with deionized, ultrapure water before use.
Sediment Samples and Certified Reference Materials
Freeze-dried sediment material taken from the estuary of Jiangyang (Luzhou, China) collected in 2010 at the Tuo River (a tributary of the upper Yangtze River) was used to prepare the sediment sample used in the study. After grinding and sieving, fractions with a particle size less than 63 µm were taken. The samples were stored in brown glass bottles at -18 °C to prevent transformation, usually methylation of Hg2+, of mercury species during storage. Spiked portions of this prepared sample were used for optimization of the method. Two certified reference materials were used to evaluate the accuracy of the whole analytical procedure: IAEA-405 and ERM-CC580.
Procedures
A 0.2-g sample of the spiked sediment was accurately weighed into the microwave vessel. After that, 3 mL of 0.1% (v/v) 2-mercaptoethanol was added. A magnetic stirring bar was put into the microwave vessel before the extraction vessel was closed; 2 min of prestirring was necessary for equilibrating with the matrix. Extractions were performed at 40 °C for 8 min. After extraction was complete, the vessels were allowed to cool to room temperature before they were opened. Then the vessels were centrifuged at 1500 rpm for 3 min. The supernatants were then filtered through a 0.22-µm glass fiber filter and transferred into precleaned 2-mL screw-cap vials. The samples were stored in dark at 4 °C until analysis.
Results and Discussion
Mobile Phase
The pH value influenced the stability of mercury species–2-mercaptoethanol complexes (MeHg+ for MeHg-RS, EtHg+ for EtHg-RS, and Hg2+ for RS-Hg-RS). According to Margetinova and colleagues (46), the complexes were stable for more than 10 h at pH 3–5. In this work, an ammonium acetate–acetic acid buffer was used in the mobile phase. Keeping the concentration of ammonium acetate at 60 mM, the pH of mobile phase was investigated in the range from 3.0–5.0. A pH 4.5 mobile phase was found to have relatively high sensitivity for detection and appropriate buffer capacity. In addition, reducing the pH in the mobile phase shortened the retention time of the mercury species. When the pH was below 4.0, an inferior resolution of MeHg+ and Hg2+ was observed.
The amount of acetonitrile in the mobile phase could obviously influence the retention time of mercury compounds. The mobile-phase flow rate was kept at 2 mL/min and different amounts of acetonitrile (1–60%) were investigated to obtain the highest resolution of the mercury species and the shortest time of chromatographic analyses. As shown in Figure 2, the best resolution of all peaks was obtained by using an isocratic mobile phase containing 3% acetonitrile.
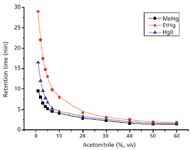
Figure 2: Effect of acetonitrile concentration on the retention time of mercury species. Other experimental conditions are given in Table I.
Theoretically, any addition of 2-mercaptoethanol into the mobile phase is not necessary because the thiol complexation of mercury species already occurred during the extraction. However, this will lead to the use of an excessive amount of 2-mercaptoethanol in the extraction. To completely eliminate the use of 2-mercaptoethanol in the mobile phase, at least 2.0% (v/v) 2-mercaptoethanol was required in the extraction. And if a certain concentration of 2-mercaptoethanol was added in the mobile phase, as well as in the extraction process, the amount of 2-mercaptoethanol will decrease by an order of magnitude (keeping 2-mercaptoethanol used in the mobile phase and extraction process with the same concentration). The amount of 2-mercaptoethanol used will be discussed later.
Optimization of the Extraction Process
Several variables could potentially affect the extraction efficiency, including extraction time, temperature, and the amount of extractant (2-mercaptoethanol). The effect of irradiation time on the extraction efficiency of Hg2+, MeHg+, and EtHg+ was evaluated from 2 to 30 min. Complete extraction was achieved when the irradiation lasted for 8 min, and no higher recoveries could be observed by prolonging the irradiation time. To shorten the sample preparation time, an 8-min extraction time was adopted.
Because temperature is one of the most important experimental parameters in MAE, a series of extractions was performed at temperatures ranging from 20 °C to 120 °C. As shown in Figure 3, when the temperature was increased from 40 °C to 120 °C the recovery of EtHg+ decreased dramatically from 87.9% ± 6.4% to 31.4% ± 7.1%. The recovery of MeHg+ also decreased when the temperature increased from 80 °C to 120 °C. However, the mean recovery of Hg2+ increased from 92.3% ± 5.3% to 128.5% ± 8.8%. These results indicate that MeHg+ and EtHg+ begin to degrade and convert to Hg2+ at temperatures higher than 80 °C and 40 °C, respectively. Consequently, milder heating at 40 °C was selected for the extraction of mercury species because it has the lowest conversion between species.
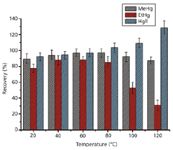
Figure 3: Effect of irradiation temperature on MeHg+, EtHg+, and Hg2+ recoveries in sediment sample spiking with 20 ng (n=3). Extraction solvent: 0.1% (v/v) 2-mercaptoethanol; sample amount: 0.2 g; irradiation time: 8 min.
2-Mercaptoethanol acted as the only extractant in this work and its concentration influenced the extraction efficiency, retention time, and peak shape of the mercury species. 2-Mercaptoethanol concentrations from 0.001% to 1% (v/v) were investigated to obtain the highest extraction recovery and resolution, as well as the best peak shape. As shown in Figure 4, recoveries of Hg2+ increased dramatically from 62.4% ± 4.4% to 97.8% ± 2.5% when the concentration of 2-mercaptoethanol was increased from 0.001% to 0.1%. Also, MeHg+ and EtHg+ could be fully extracted at a lower 2-mercaptoethanol concentration. However, increasing the concentration of 2-mercaptoethanol decreased the resolution of mercury species. When the concentration of 2-mercaptoethanol reached 0.5% (v/v), resolution of MeHg+ and Hg2+ was no longer acceptable. In addition, bifurcate and broad peaks were discovered when the concentration of 2-mercaptoethanol was no more than 0.01% (v/v). This can be understood as a decrease of the 2-mercaptoethanol concentration resulting in an increase of the k values of thiol complexation of mercury species. However, this phenomenon disappeared when the 2-mercaptoethanol concentration was higher than 0.05% (v/v), and higher 2-mercaptoethanol concentrations did not improve the peak shape. Therefore, a 0.1% (v/v) 2-mercaptoethanol concentration was considered optimal.
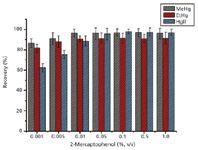
Figure 4: Effect of 2-mercaptoethanol concentration on MeHg+, EtHg+, and Hg2+ recoveries in sediment sample spiking with 20 ng of each mercury species (n = 3). Sample amount: 0.2 g; irradiation time: 8 min; irradiation temperature: 40 °C.
Stability of the Extracted Samples
To evaluate the stability of the extracted samples, the same sample was analyzed at different time intervals after extraction (Table II). As can be seen in the results, EtHg+ recovery began to decrease after 12 h of extraction, and MeHg+ and Hg2+ recoveries observably decreased after 36 h of extraction. After that, the concentration remained constant until 120 h. In addition, a high centrifugation speed for a long time after the sample was extracted also caused a slight decrease of mercury species concentration, which means that the complexes of mercury species and 2-mercaptoethanol may be adsorbed on the glass wall of the vessel, and even back in the sample under a great centrifugal force. This result suggests that the sample should be centrifuged at a speed of no more than 1500 rpm for no longer than 3 min, and the analysis of extracted samples should be achieved within 12 h.
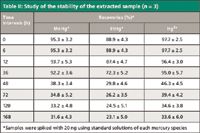
Table II: Study of the stability of the extracted sample (n = 3)
Validation of the Extraction
The application of 2-mercaptoethanol for mercury species extraction from sediments has been found to be a very advantageous idea. The extraction process is simple, rapid, and uses a single extractant, which shows a lower toxicity compared with other organic solvents. To validate this novel extraction method, results obtained by the proposed method and the method described in reference 47 were compared by analyzing both the certified reference materials and natural samples. The results of the proposed method were in good agreement with those obtained by the method described (47). The RSD of these two methods was no more than 8% (shown in Table III).
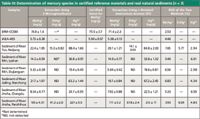
Table III: Determination of mercury species in certified reference materials and real natural sediments (n = 3)
Optimization of VGAFS
K2S2O8 was selected as an oxidant to convert mercurial thiol complexes into Hg2+ under UV irradiation before KBH4 reduction. The concentration of K2S2O8 had a significant effect on method sensitivity. Low concentrations of K2S2O8 could not decompose organic mercury completely under UV irradiation and excess concentrations of K2S2O8 would react with KBH4 in the subsequent reduction step, resulting in lower sensitivity (48). K2S2O8 concentrations from 0.01% to 3% (m/v) were investigated. As shown in Figure 5, the highest sensitivity was obtained when 2% K2S2O8 was used. Therefore, 2% K2S2O8 was adopted as optimum.
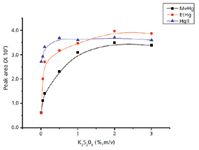
Figure 5: Effect of the K2S2O8 concentration on the fluorescence intensity of mercury compounds. Sample was spiked with 20 ng of each mercury species. Other experimental conditions are given in Table I.
All mercurial thiol complexes were oxidized to Hg2+ before KBH4 reduction, so they share almost the same characteristics in the reduction process. Using MeHg+ as a model compound, the concentration of KBH4 was investigated from 0.5% to 3.5% (m/v). As shown in Figure 6, the sensitivity of the mercury increased when the concentration of KBH4 increased up to 2% (m/v). However, the peak area decreased considerably when the KBH4 concentration exceeded 2% (m/v). In addition, bifurcate peaks and an inferior baseline were observed when the KBH4 concentration was under 1% (m/v) or above 2.5% (m/v). An excessive amount of KBH4 generated a significant amount of hydrogen gas which disturbed the effective penetration and mixing of the sample and reagent zones (49), caused significant background signal, and destroyed the ruggedness of the measurement. Consequently, the KBH4 concentration was selected as 2% (m/v).
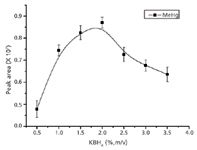
Figure 6: Effect of the KBH4 concentration on the fluorescence intensity of mercury compounds. Sample was spiked with 20 ng of MeHg+ (n = 3). Other experimental conditions are given in Table I.
The presence of HCl provided an acidic medium for the vapor generation. Not enough hydrogen gas was generated when using a low HCl concentration, resulting in lower sensitivity. However, excessive hydrogen gas was generated when the HCl concentration exceeded 7% (v/v) and dramatically affected the ruggedness of the measurement. Additionally, HCl concentration and its purity may significantly influence the blank of mercury species. A 7% (v/v) concentration of HCl perfectly combined good sensitivity with relatively low blank response. And the Hg blank response could be reduced by using a higher purity of HCl. As a result, a 7% (v/v) HCl concentration was chosen as optimum. The optimized results of VGAFS are shown in Table I.
Analytical Figures of Merit
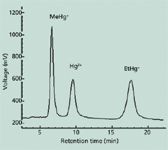
Figure 7 shows the chromatogram of a spiked sample of MeHg+ and EtHg+ at 10 µg/L levels and Hg2+ at the 5-µg/L level, obtained with the optimized conditions. Table IV shows the main analytical figures of merit of the method. The limit of detection was calculated as three times the standard deviation of six reagent blanks divided by the slope of the calibration curve and taking into account the dilution factor. Absolute limits of detection (LODs) were determined from 500-µL injections were 6.5 pg for MeHg+, 11 pg for EtHg+, and 5.5 pg for Hg2+. Table V provides a comparison of the detection limits obtained by other HPLC-hyphenated techniques for mercury speciation. The detection limits of the present method are comparable with other HPLC-hyphenated techniques. The RSD (Table IV) was the value obtained in the analysis of six samples, all of which were spiked with 20 ng of each mercury species. Additionally, recovery experiments were carried out, spiking samples before the microwave-assisted extraction with standard solutions of mercury species and following the proposed method. As shown in Table IV, the recoveries for 5, 20, and 40 ng were quantitative, and no species conversions were observed.
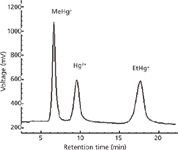
Figure 7: Chromatogram of three mercury species using the developed HPLCâVGAFS method. MeHg+ and EtHg+ were spiked at 10-µg/L levels and Hg2+ was spiked at the 5-µg/L level.
Validation of the Method and Application
To validate the accuracy of the method, the proposed procedure was applied for extraction and determination of MeHg+ in two certified reference materials: IAEA-405 and ERM-CC580. As shown in Table III, the determined results were in agreement with the certified value.
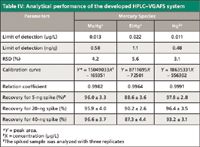
Table IV: Analytical performance of the developed HPLCâVGAFS system
The extraction and determination of MeHg+, EtHg+, and Hg2+ in sediment by HPLC coupled with VGAFS were applied to a set of six natural sediment samples collected from different sites in the Sichuan province in China. One was from the Tuo River, one was from the Jialing River, two were from the Min River, and two were from the Jinsha River, all of which are the major tributaries of the upper Yangtze River. Table III shows the results obtained. And, as shown, MeHg+ and Hg2+ were detected in all of the natural samples. Relatively high concentrations of MeHg+ and Hg2+ were found in sediment collected on the river bed of the Jinsha River, Panzhihua. This is probably because the sampling site was located downstream of a refinery. The refinery, which is one of the oldest oil refineries of Panzhihua, is located west of the urban areas and is considered one of the largest anthropogenic Hg pollution sources of the Jinsha River. EtHg+ was found in only two natural sediment samples. This indicated that methylation dominated mercury species conversion in sediments.
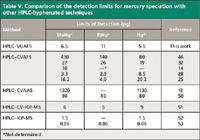
Table V: Comparison of the detection limits for mercury speciation with other HPLC-hyphenated techniques
Conclusions
The proposed method, which combines microwave-assisted extraction of samples with an HPLC–VGAFS determination, provides a sufficiently low detection limit to determine MeHg+, EtHg+, and Hg2+ in sediment samples. The selection of 2-mercaptoethanol as the only extractant for mercury species extraction from sediments is an advantageous idea. The separation and determination of mercury species was achieved by direct injection of the extractant into the HPLC–VGAFS system. The method was faster and simpler than other methods. The detection limits of the three mercury species were comparable with other HPLC-hyphenated techniques. The proposed method has been successfully applied to determine MeHg+, EtHg+, and Hg2+ in natural sediments from the Sichuan area in China. The major drawback of the proposed method was the broadening of the peaks, especially EtHg+, caused by the system itself. This effect probably could be improved by using more capable pumps to optimize the oxidant and reductant delivery.
Acknowledgments
The authors are grateful to the Department of Science, Technology and Standards of Ministry of Environment Protection of the Peoples Republic of China for financial support.
Ping Yang is with the Sichuan Environmental Monitoring Center in Chengdu, China.
Geng Leng, Li Feng, Shao-Bo Li, and De-Zhong Dan are with the Department of Environmental Science and Engineering at Sichuan University in Chengdu, China. Direct Correspondence about this article to: dandezhong@sina.com.
References
(1) L. Clevenger, B.W. Smith, and J.D. Winefordner, Crit. Rev. Anal. Chem.27, 1–26 (1997).
(2) J.E.S. Uria and A.S. Medel, Talanta47, 509–524 (1998).
(3) M. Hoch, Appl. Geochem.16, 719–743 (2001).
(4) A.M. Carro and M.C. Mejuto, J. Chromatogr. A882, 283–307 (2000).
(5) C.F. Harrington, Trends Anal. Chem.19, 167–179 (2000).
(6) C.W. Shade, Environ. Sci. Technol.42, 6604–6610 (2008).
(7) K.J. Chena, I.H. Hsua, and Y.C. Suna, J. Chromatogr. A1216, 8933–8938 (2009).
(8) C.W. Shade and R.J.M. Hudson, Environ. Sci. Technol.39, 4974–4982 (2005).
(9) B.R. Vermillion and R.J.M. Hudson, Anal. Bioanal. Chem.388, 341–352 (2007).
(10) Z.F. Fan and X.J. Liu, J. Chromatogr. A 1180, 187–192 (2008).
(11) B.Y. Deng, Y. Xiao, X.S. Xu, P.C. Zhu, S.J. Liang, and W.M. Mo, Talanta79, 1265–1269 (2009).
(12) A. Diego, C.M. Tseng, T. Stoichev, D. Amouroux, and O.F.X. Donard, J. Anal. At. Spectrom.13, 623–629 (1998).
(13) S.R. Segade and C. Bendicho, Talanta48, 477–484 (1999).
(14) E. Ramalhosa, S.R. Segade, E. Pereira, C. Vale, and A. Duarte, Anal. Chim. Acta448, 135–143 (2001).
(15) K.C. Bowles and S.C. Apte, Anal. Chem.70, 395–399 (1998).
(16) H.E.L. Armstrong, W.T. Corns, P.B. Stockwell, G. O'Connor, L. Ebdon, and E.H. Evans, Anal. Chim. Acta390, 245–253 (1999).
(17) R. Falter and G. Ilgen, Fresenius J. Anal. Chem.358, 401–406 (1997).
(18) A. Prange and E. Jantzen, J. Anal. At. Spectrom.10, 105–109 (1995).
(19) C.C. Wan, C.S. Chen, and S.J. Jiang, J. Anal. At. Spectrom. 12, 683–687 (1997).
(20) C. Gerbersmann, M. Heisterkamp, F.C. Adams, and J.A.C. Broekaert, Anal. Chim. Acta350, 273–285 (1997).
(21) I.S. Krull, D.S. Bushee, R.G. Schleicher, and S.B. Smith, Analyst111, 345–349 (1986).
(22) J.C. Fernandez, F. Lunzer, R.P. Garcia, A.S. Medel, and N.B. Garcia, J. Anal. At. Spectrom.10, 1019–1025 (1995).
(23) S.R. Segade and C. Bendicho, Ecotox. Environ. Safety42, 245–252 (1999).
(24) S.R. Segade and J.F. Tyson, Spectrochim. Acta B58, 797–807 (2003).
(25) C.G. Zheng, Y. Li, Y.H. He, Q. Ma, and X.D. Hou, J. Anal. Atom. Spectrom.20, 746–750 (2005).
(26) A.J. Percy, M. Korbas, G.N. George, and J. Gailer, J. Chromatogr. A1156, 331–339 (2007).
(27) B. Michalke, Electrophoresis26, 1584–1597 (2005).
(28) Y.G. Yin, J.F. Liu, B. He, J.B. Shi, and G.B. Jiang, J. Chromatogr. A1181, 77–82 (2008).
(29) A. Castillo, A.F.R. Navarro, and O.J. Pozo, Anal. Chim. Acta577, 18–25 (2006).
(30) B. Palenzuela, L. Manganiello, A. Rios, and M. Valcarcel, Anal. Chim. Acta511, 289–294 (2004).
(31) S.C. Hight and J. Cheng, Anal. Chim. Acta 567, 160–172 (2006).
(32) Y. Li, X.P. Yan, L.M. Dong, S.W. Wang, Y. Jiang, and D.Q. Jiang, J. Anal. At. Spectrom.20, 467–472 (2005).
(33) J. Qvarnström and W. Frech, J. Anal. At. Spectrom. 17, 1486–1491 (2002).
(34) R. Rai, W. Maher, and F. Kirkowa, J. Anal. At. Spectrom.17, 1560–1563 (2002).
(35) J. Morton, V.A. Carolan, and P.H.E. Gardiner, J. Anal. At. Spectrom.17, 377–381 (2002).
(36) R.E. Sturgeon, X. Guo, and Z. Mester, Anal. Bioanal. Chem.382, 881–883 (2005).
(37) E. Bramanti, A. D'Ulivo, L. Lampugnani, G. Raspi, and R. Zamboni, J. Anal. Atom. Spectrom.14, 179–185 (1999).
(38) E. Bramanti, R. Cavallaro, M. Onor, R. Zamboni, and A. D'Ulivo, Talanta74, 936–943 (2008).
(39) E. Bramanti, C. Lomonte, M. Onor, R. Zamboni, A. D'Ulivo, and G. Raspi, Talanta66, 762–768 (2005).
(40) P.B. Stockwell, W.T. Corns, and D.W. Bryce, "On-line Speciation of Mercury in Flue Gas Using Amalgamation Atomic Fluorescence Spectrometry" presented at Pittcon 2000.
(41) H. Hintelmann and R.D. Wilken, Appl. Organomet. Chem.7, 173–180 (1993).
(42) E. Munaf, H. Haraguchi, D. Ishii, T. Takeuchi, and M. Goto, Anal. Chim. Acta 235, 399–404 (1990).
(43) C. Schickling and J.A.C. Broekaert, Appl. Organomet. Chem.9, 29–36 (1995).
(44) W.J.C. Gaston, Spectrosc. Lett.24, 681–697 (1991).
(45) F. Palmisano, P.G. Zambonin, and N. Cardellicchio, Fresenius' J. Anal. Chem. 346, 648–652 (1993).
(46) J. Margetinova, P.H. Pelcova, and V. Kuban, Anal. Chim. Acta615, 115–123 (2008).
(47) J.S. Santos, M. Guárdia, A. Pastor, and M.L.P. Santos, Talanta80, 207–211 (2009).
(48) L.N. Liang, G.B. Jiang, J.F. Liu, and J.T. Hu, Anal. Chim. Acta477, 131–137 (2003).
(49) S. Farias, R.E. Rodriguez, A. Ledesma, D.A. Batistoni, and P. Smichowski, J. Microchem. 73, 79–88 (2002).
(50) R. Falter and H.F. Schöler, J. Chromatogr. A675, 253–256 (1994).
(51) C. Chiou, S. Jiang, and K.S.K. Danadurai, Spectrochim. Acta B 56, 1133–1142 (2001).
(52) I. Cattani, S. Spalla, G.M. Beone, A.A.M. Del Re, R. Boccelli, and M. Trevisan, Talanta74, 1520–1526 (2008).
(53) Y.G. Yin, M. Chen, J.F. Peng, J.F. Liu, and G.B. Jiang, Talanta 81, 1788–1792 (2010).

Determining the Effects of ‘Quantitative Marinating’ on Crayfish Meat with HS-GC-IMS
April 30th 2025A novel method called quantitative marinating (QM) was developed to reduce industrial waste during the processing of crayfish meat, with the taste, flavor, and aroma of crayfish meat processed by various techniques investigated. Headspace-gas chromatography-ion mobility spectrometry (HS-GC-IMS) was used to determine volatile compounds of meat examined.

.png&w=3840&q=75)

.png&w=3840&q=75)


.png&w=3840&q=75)


.png&w=3840&q=75)


