Retention Factor Is Independent of Pressure in LC, Right?
Column: LC Troubleshooting
The retention factor (k) is a valuable measure of retention in chromatography because it is independent of several method variables, including flow rate and column length. In reversed-phase liquid chromatography (LC), the retention factor is also nominally independent of operating pressure for small non-polar molecules at low pressure. However, as the field moves in the direction of routine use of pressures well above 400 bar, and biomolecule separations become more prevalent, the effect of pressure on retention should not be overlooked. Understanding when the effect is likely to be large enough to affect resolution is valuable for troubleshooting unexpected results that arise during both method development and the execution of established methods.
In the first few decades of the development of high performance liquid chromatography (HPLC), there was quite a lot of theoretical consideration given to the relationship between pressure and analysis time in LC. Several researchers, including Knox (1), Poppe (2) and Guiochon (3), provided us with ways to think about optimizing the speed of LC separations—for a given maximum pressure that can be generated by a LC pump, what are the best choices for parameters such as particle size, column length, and flow rate? During this same time period, however, there was very little discussion of the effect of operating pressure on retention in LC. It wasn’t until the 1990s that researchers started looking at this relationship closely, but the introduction of commercial LC instrumentation that could reliably operate well above 400 bar in the early 2000s led to many published studies in this area over the past 15 years or so. In my own laboratory, we increasingly are encountering situations where the effect of pressure on retention cannot be ignored, in part because we are doing more work these days with large biomolecules where such effects are more obvious. For this installment of “LC Troubleshooting,” I’ve asked my student Trevor Kempen to join me to provide some background on this topic, and then use experimental data from reversed- phase separations of small molecules to illustrate when the effect of pressure on retention could complicate method development, or even produce changes in selectivity during routine operation of an established method.
Dwight Stoll
Background: Pressure Doesn’t Affect Retention Factor...Or Does It?
In the early days of chromatography school, we learn that the retention factor (k) is an important and special measure of retention, because it is, in principle, independent of certain experimental variables, such as flow rate (4). The retention factor is defined as the ratio of the number of moles of the analyte in the stationary phase (nA,sp) to the number of moles in the mobile phase (nA,mp). The larger the fraction of analyte in the stationary phase, the larger the retention factor, and vice versa:

A little algebra yields the more commonly used relationship between k, retention time (tr), and the column dead time (tm):

At this point, we can illustrate the interest in k. Suppose that at a flow rate of 1 mL/min we observe a peak A with a retention time of 4 min., and we know that the column dead time at this flow rate is 1 min. Using equation 2, we would calculate that k = 3. Now, if we double the flow rate, the retention time of peak A will decrease by a factor of two; it simply takes half the time for the analyte to move through the column if the mobile phase is moving twice as fast. The new retention time for peak A will be 2 min., and the new dead time will be 0.5 min. From the point of view of retention time, the retention of peak A has decreased greatly. However, putting these numbers into equation 2, we find that the retention factor is still 3.0; it has not changed, even though we doubled the flow rate.
Similar arguments can be made to show that, in principle, variables including column length, column diameter, particle size, and flow rate have no direct effect on retention factor. This point is exceedingly valuable in a variety of situations in LC, not the least of which is troubleshooting problems or unexpected observations during method development. For example, the ideas above lead us to expect that when we move from a 50-mm long column to one that is 150 mm long, keeping all other variables constant, retention times of our analytes will increase by a factor of three, but the retention factor will remain unchanged. If this is not what we observe, then something is not right—perhaps the stationary phase in the two columns is different, or there is a leak in the system because of the higher pressure drop generated by the longer column. Again, the idea that the retention factor is independent of certain variables is central to many of the ways that we think about how LC separations work.
Although not placed in the same category as other variables like flow rate and column length, pressure is usually not considered in textbooks as having a major effect on retention, again probably because this was not a major focus of research prior to the early 2000s. However, research by several groups is yielding an increasingly quantitative picture of how and when pressure does, in fact, affect retention factor in significant ways. Given that these effects roughly increase in magnitude with increasing molecular size of the analyte, the effects can be dramatic (for example, retention changes greater than 100% when moving from 100 to 1000 bar), and very important for biomolecule and other macromolecule separations.
Brief Review of Recent Research in This Area
In an early study in this area in 1997, McGuffin and Chen (5) measured the dependence of the retention factors of a homologous series of fatty acids on pressure, and found that k increased from 9.3 to 24.4% over the range of pressure from about 100 to 333 bar. In the publication describing these results, they proposed the following expression for the dependence of retention factor on pressure (P) in LC that has been adopted by most subsequent publications:

where R is the gas constant, T is temperature, ΔV is the difference between the molar volume of the analyte in the stationary phase and mobile phase environments, and β is the phase ratio. The subscript ref indicates a reference condition at some specific pressure. If equation 3 accurately describes the effect of P on k, then a plot of ln(k) vs. P should be linear, with a slope of -ΔV/RT and a y-intercept of ln(β/βref) + ln(kref). In most published results of this kind for reversed-phase LC separations, the slopes of such plots are positive, which means that the ΔV terms are negative. This is usually interpreted as reflecting a decrease in the solvation of the analyte as it moves from the mobile phase to the stationary phase (6).
In reversed-phase LC, the magnitude of the ΔV term has been shown to be condition specific and dependent on a large number of variables, including:
- mobile-phase properties, such as organic solvent content and buffer pH (6)
- stationary-phase properties
o ligand chain length for bonded - stationary phases (6–8)
o ligand hydrophilicity (6,7,9) - analyte properties
o molecular size (6,10,11)
o dipolarity (6,10)
o ionization state (6,12,13)
o flexibility/rigidity (8,11).
Interestingly, the dependence of retention on pressure in hydrophilic interaction chromatography (HILIC) separations is usually the opposite of that observed in reversed-phase LC separations; that is, ΔV is usually positive (6,9).
Experimental Data Illustrate Potential Consequences
Different research groups have used various experimental approaches to study the effect of pressure on retention in LC. One approach is to vary the flow rate through the column, which will change the pressure that the column experiences during separations. The major upside of this approach is that it is experimentally convenient and easy to do. The major downside is that changing the flow rate will also change column temperature because of frictional heating, and this temperature change, in turn, will affect retention, making interpretation of observations more difficult. Åsberg, Fornstedt, and coworkers have demonstrated the use of column water jackets to minimize this complication (13), but this is not very convenient experimentally. The other commonly used approach is to add different lengths of restriction capillaries (for example, adding a 50 μm i.d. capillary when operating at 1 mL/min will significantly raise the pressure the column experiences) between the column outlet and the detector. The major upside of this approach is that it does not require a flow rate change, and therefore the column temperature will not change significantly because of changes in frictional heating. The major downside of this approach is that it requires a physical change of the restriction capillary in the flow path between the column and detector to produce a change in the pressure, which is not very convenient and prone to irreproducibility.
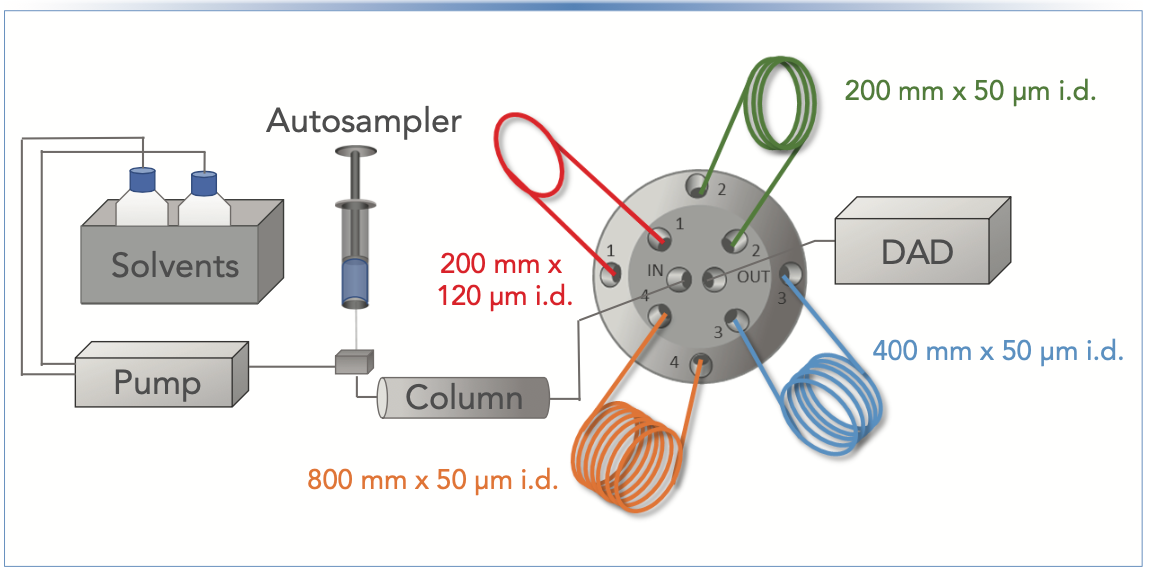
For this type of study in our laboratory, we have primarily used the restriction capillary approach, but with one twist. We mount several capillaries having different lengths or diameters on a valve normally used for column selection in a LC instrument. We then can modulate the pressure that the column experiences through software control by changing the position of the selection valve, which in turn places a different restriction capillary in the flow path between the column outlet and detector. An illustration of this type of setup is shown in Figure 1.
FIGURE 1: Illustration of the experimental setup used to produce the data shown in Figures 2 and 3, and Table I. Different positions of the selector valve place different restriction capillaries in the flow path between the column outlet and the detector.
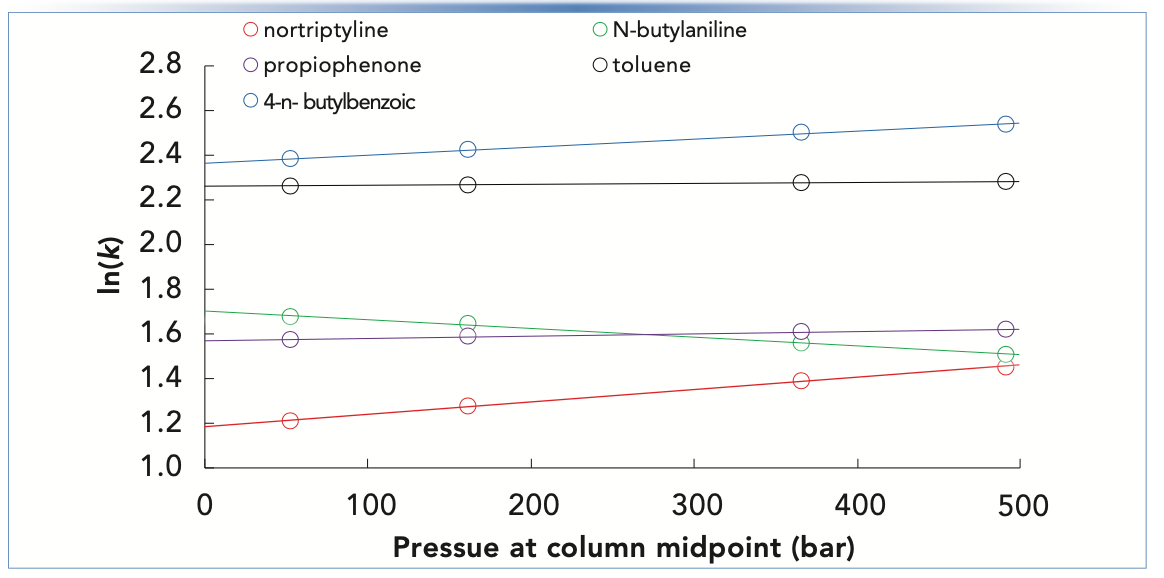
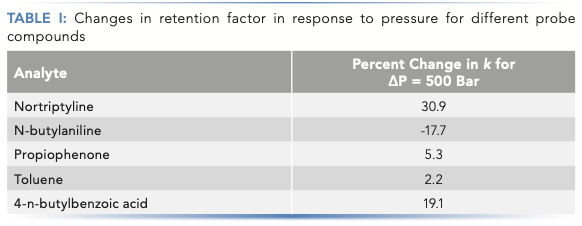
The dependence of retention factor on pressure for some simple small molecules under reversed-phase separation conditions is shown in Figure 2. Among the five molecules represented are two neutrals (toluene and propiophenone), one weak acid (4-n-butylbenzoic acid), one relatively strong base (nortriptyline; pKa of protonated amine is about 10.5), and one relatively weak base (N-butylaniline; pKa of protonated amine is about 5.0). As expected from the data of other groups found in the literature, the strongest dependencies (that is, the steepest slopes) are observed for the more dipolar molecules (here, the acids and bases) (6,10). The dependence for the small, neutral toluene is measurable, but very weak. The dependencies for the weak acid and strong base are both strong and positive. Interestingly, the dependence for the weak base (N-butylaniline) is also quite strong, but negative. This, too, is consistent with observations discussed in the literature, where other groups have suggested that this result can be explained by the differential shifts in the dissociation constants of the different acids and bases involved (here, ammonium and formate in the mobile phase, in addition to the analytes) in response to changes in pressure (6,14). These dependencies are quantified as percent change in retention factor per 500-bar increase in pressure in Table I.
FIGURE 2: Dependence of retention factor (plotted as natural logarithm of k) on pressure calculated at the column midpoint. Chromatographic conditions: Column, 50 mm x 4.6 mm i.d. Agilent SB-C18 (5 μm); Flow rate, 0.8 mL/min.; Temperature, 40 °C; Mobile phase, 40/60 ACN/25 mM ammonium formate, pH 3.2.
What Does This All Mean for Practical Work?
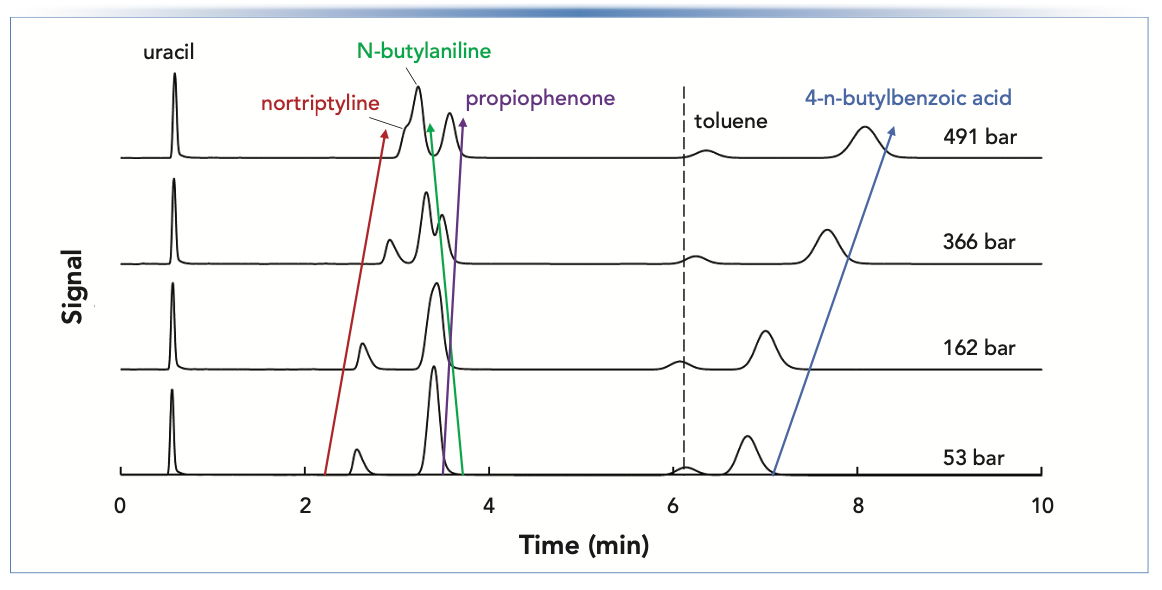
The chromatograms that yielded the retention factors plotted in Figure 2 are shown in Figure 3. Including uracil, there are six compounds in the test mixture. We see that at the lowest pressure of 53 bar, only five peaks are observed; in this instance, N-butylaniline and propiophenone have been co-eluted. As the pressure is increased, the resolution of this pair of peaks improves to the point where they are base- line resolved at the highest pressure of 491 bar. This dramatic shift results from the fact that the dependencies of retention factor on pressure have opposite signs for these two compounds. On the other hand, the opposite is observed for nortiptyline and N-butylaniline. At low pressure, they are well resolved, but as pressure is increased, resolution is lost, and, at the highest pressure, the nortriptyline is barely observable as a shoulder on the N-butylaniline peak.
FIGURE 3: Chromatograms show that changes in selectivity with changes in pressure can cause gains or losses of resolution, depending on the operating conditions and characteristics of compounds in neighboring peaks. Conditions are the same as those described in Figure 2. Retention factors shown in Figure 2 were obtained from these chromatograms. Some of the small retention time shifts at different pressures are due to differences in extra-column volume when the different restriction capillaries are in the flow path.
We could make a pretty long list of different scenarios where changes in retention factor with changes in pressure on the order of those shown here could significantly impact both method development and separation performance during routine execution of an established method. Just a couple of examples will suffice to make the point here. In the case of method development, it is common to do a selectivity screen using short columns with different stationary phases to find one or a few phases that look promising in terms of the selectivity needed to solve a particular separation problem. In a next round of optimization, using a longer column close to the length that will likely be used in the final method will result in higher operating pressures, unless the flow rate is deliberately lowered when using the longer column so that the pressure does not change. In this scenario, if the retention of the compounds under study is sensitive to pressure, significantly different selectivity will be observed in the next round of optimization compared to what was observed during the initial stationary phase screen. This could be either a positive change or a negative one (that is, more or less resolution), but in either case it could be an unexpected change that may be difficult to interpret.
In the case of an established method, an example of a change in the instrument that could precipitate a pressure-induced change in method performance is a change in the connecting tubing between the outlet of the column and the detector. For example, unknowingly replacing a 120 μm i.d. capillary with a 75 μm i.d. capillary could easily lead to a change of 50 bar experienced by the column. For many methods involving separation of a few compounds and resolution to spare, such a change will hardly be noticeable. However, in methods with crowded chromatograms, several critical pairs, and highly pressure-sensitive compounds, such a change could quickly become a big problem. Of course, making a change in the diameter of connecting tubing such as in this example is typically not recommended, but mistakes like this do happen, and it is helpful to be aware of the consequences that could follow from such a change.
Summary
In this installment of “LC Troubleshooting,” we have discussed the fact that, in reversed-phase LC, the operating pressure that the column experiences can significantly affect analyte retention factors. We briefly reviewed recent research in this area, which has shown that ln(k) is linearly dependent on P, with a slope that is related to the difference between the molar volumes (ΔV) of the analyte in the mobile- and stationary-phase environments. Sometimes these effects are too small to be noticed in chromatograms obtained at different pressures, but, in other cases, relative shifts in retention can significantly increase or decrease resolution of neighboring peaks. These effects increase in magnitude with increasing size and dipolarity of the analyte, and can be quite dramatic for large biomolecules and other macromolecules. Understanding when these effects can occur is an important asset in the “LC Troubleshooting” toolbox (15).
Acknowledgments
We thank Dr. Konstantin Shoykhet for providing the 50 μm i.d. stainless steel restriction capillaries used in this work.
References
(1) J.H. Knox and M. Saleem, J. Chromatogr. Sci. 7, 614–622 (1969). https://doi.org/10.1093/chromsci/7.10.614.
(2) H. Poppe, J. Chromatogr. A 778, 3–21 (1997). https://doi.org/10.1016/ S00219673(97)00376-2.
(3) G. Guiochon, Anal. Chem. 52, 2002–2008 (1980). https://doi.org/10.1021/ac50063a004.
(4) L.R. Snyder, J.J. Kirkland, and J.W. Dolan, Chapter 2: Basic Concepts and Control of Separation,” in Introduction to Modern Liquid Chromatography (Wiley, Hoboken, New Jersey, 3rd ed., 2010), pp. 25–28.
(5) V.L. McGuffin and S.-H. Chen, Anal. Chem. 69, 930–943 (1997). https://doi.org/10.1021/ac960589d.
(6) M.M. Fallas, U.D. Neue, M.R. Hadley, and D.V. McCalley, J. Chromatogr. A 1217, 276–284 (2010). https://doi.org/10.1016/j.chroma.2009.11.041.
(7) M.R. Euerby, M.A. James, and P. Petersson, Anal Bioanal. Chem. 405, 5557–5569 (2013). https://doi.org/10.1007/s00216-013-6973-3.
(8) K. Okusa, Y. Iwasaki, I. Kuroda, S. Miwa, M. Ohira, T. Nagai, H. Mizobe, N. Gotoh, T. Ikegami, D.V. McCalley, and N. Tanaka, J. Chromatogr. A 1339, 86–95 (2014). https://doi.org/10.1016/j.chroma.2014.02.077.
(9) U.D. Neue, C.J. Hudalla, and P.C. Iraneta, J. Sep. Sci. 33, 838–840 (2010). https://doi.org/10.1002/jssc.200900628.
(10) M.M. Fallas, U.D. Neue, M.R. Hadley, and D.V. McCalley, J. Chromatogr. A 1209, 195–205 (2008). https://doi.org/10.1016/j.chroma.2008.09.021.
(11) M.M. Fallas, N. Tanaka, S.M.C. Buckenmaier, and D.V. McCalley, J. Chromatogr. A 1297, 37–45 (2013). https://doi.org/10.1016/j.chroma.2013.04.006.
(12) C.E. Evans and J.A. Davis, Anal. Chim. Acta 397, 163–172 (1999). https://doi.org/10.1016/S0003-2670(99)00401-8.
(13) D. Åsberg, M. Chutkowski, M. Leśko, J. Samuelsson, K. Kaczmarski, and T. Fornstedt, J. Chromatogr. A. 1479, 107–120 (2017). https://doi.org/10.1016/j.chroma.2016.11.050.
(14) M.R. Euerby, M. James, and P. Petersson, J. Chromatogr. A 1228, 165–174 (2012). https://doi.org/10.1016/j.chroma.2011.05.105.
(15) J. Dolan, LCGC North Am. 32, 546–551 (2014).
ABOUT THE CO-AUTHOR
Trevor Kempen is currently a student researcher in Dwight Stoll’s laboratory, and studies chemistry at Gustavus Adolphus College in St. Peter, Minnesota.

ABOUT THE COLUMN EDITOR
Dwight Stoll is the editor of “LC Troubleshooting.” Stoll is a professor of chemistry at Gustavus Adolphus College in St. Peter, Minnesota. His primary research focus is on the development of 2D-LC for both targeted and untargeted analyses. He has authored or coauthored more than 75 peer-reviewed publications and four book chapters in separation science and more than 100 conference presentations. He is also a member of LCGC’s editorial advisory board. Direct correspondence to: LCGCedit@mmhgroup.com.


Extracting Estrogenic Hormones Using Rotating Disk and Modified Clays
April 14th 2025University of Caldas and University of Chile researchers extracted estrogenic hormones from wastewater samples using rotating disk sorption extraction. After extraction, the concentrated analytes were measured using liquid chromatography coupled with photodiode array detection (HPLC-PDA).
Polysorbate Quantification and Degradation Analysis via LC and Charged Aerosol Detection
April 9th 2025Scientists from ThermoFisher Scientific published a review article in the Journal of Chromatography A that provided an overview of HPLC analysis using charged aerosol detection can help with polysorbate quantification.
Removing Double-Stranded RNA Impurities Using Chromatography
April 8th 2025Researchers from Agency for Science, Technology and Research in Singapore recently published a review article exploring how chromatography can be used to remove double-stranded RNA impurities during mRNA therapeutics production.


