Profiling Free Naphthenic Acids in Produced Water Using Gas Chromatography Coupled to High-Resolution Accurate Mass–Mass Spectrometry (GC–HRAM-MS)
Columns: Column Watch
Naphthenic acids (NAs) are naturally occurring organic acids found in crude oils. NAs are one of the main classes of acids found in produced water (PW). In the petroleum industry, the need to stabilize oil–water emulsions leads to a demand of reliable methods for compositional analysis of these emulsions. Gas chromatography coupled to mass spectrometry (GC–MS) is one of the most important techniques for NA profiling. Traditional methods employ a derivatization step to improve the volatility and detectability of NAs. In this work, we propose a simple method for profiling free NAs in PW by GC–MS. Eight analytical columns were carefully selected by evaluating metrics, such as normalized analyte response and select chromatographic parameters. The best-performing columns were used to analyze NAs extracted from a real-world PW sample. The analytes were detected by Fourier transform orbital ion trap mass spectrometry using chemical ionization in the negative mode (NCI). The combination of the selected columns and the enhanced signal-to-noise ratio (S/N) attained by the GC-NCI–high-resolution, accurate mass–mass spectrometry (HRAM–MS) method made it possible to detect and identify several homologous series of acidic oxygenated compounds ranging from aliphatic to aromatic analytes.
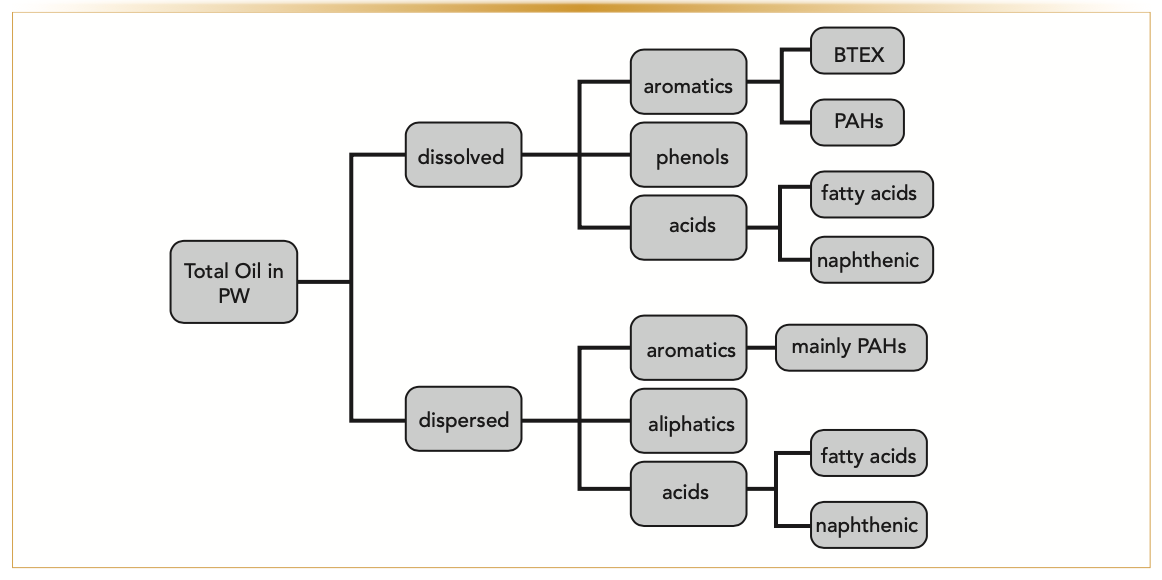
Produced water (PW) is the wastewater that comes out of the ground along with oil and gas during oil and gas extraction (1,2). PW is a complex mixture of organic and inorganic matter. Its exact composition depends on several factors, such as the location and age of the reservoir, its geological formation, the type of hydrocarbon produced, and the recovery methods employed (such as water injection) (1). The oil components in PW may be found in a dispersed or dissolved form (Figure 1), and it has been reported that more than 1000 chemical components have been detected in PW samples. Examples of organic species includes aromatic hydrocarbons like benzene, toluene, ethylbenzene, xylene (BTEX), phenols, and naphthenic acids (NAs).
FIGURE 1: Total oil and its fractions that can be found in produced water. Adapted from reference (3).
NAs are generally defined by the petroleum industry as naturally occurring organic acids derived from crude oil, comprising an acid-extractable fraction of petroleum including aliphatic, aromatic, and cyclic compounds, as well as organic components containing heteroatoms (oxygen, nitrogen, and potentially sulfur atoms) (4,5). However, the chemical definition restricts the molecular coverage of NAs to cyclic organic acids. NAs are described by the general molecular formula CnH2n+ZO2, where Z is a negative and even integer. The Z-value is proportional to the double-bond equivalent (DBE). For instance, linear and branched acids exhibit DBE values of 1 (Z = 0), monocyclic acids show DBE values of 2 (Z = −2), bicyclic acids exhibit DBE values of 3 (Z = −4), tricyclic acids show DBE values of 4 (Z = −6), and monoaromatic acids exhibit DBE values of 5 (Z = −8).
NAs are surface-active compounds, participating in the formation and stabilization of water and oil emulsions (4,6). It was reported that the structure of NAs plays an important role in regulating the interfacial tension of emulsions (7). In addition, NAs can significantly impact the environment because of their toxicity (4,5).
Recent studies indicate that larger NA species exhibit higher toxicological potential than smaller ones (8,9). In this context, there is an increasing demand for methods to monitor the occurrence of NAs in complex mixtures, such as wastewater, to address operational problems and environmental issues that currently plague the petroleum industry.
A variety of analytical methods have been proposed for characterizing NAs. However, there is still much space to standardize and develop new methods to improve sensitivity, precision, and accuracy (10). Peak or signal overlap can occur in the instrumental measurements because of sample complexity, and because over 1500 species with a broad range of molar mass have been detected in a single NA mixture (11). Also, some species are detected at trace levels (12), making it necessary to include a preconcentration step prior to instrumental analysis. In this context, gas chromatography coupled to high-resolution accurate mass–mass spectrometry (GC–HRAM-MS) is an interesting tool for analyzing NAs, because of the improved (peak and mass) resolving power and sensitivity (13,14).
Derivatization reactions are common in GC–MS methods to profile NAs to increase their volatility (Henry constants close to 8.56 ×10⁻⁶ atm m3/mol) (15). Although silylation and methylation methods may be used to increase the detection and improve peak symmetry (16), derivatization can be time-consuming and may be bypassed for analyzing some organic acids. The bottleneck of the direct analysis approach seems to reside in the selection of an adequate GC column for analyzing free organic acids (17,18). Even though the direct analysis approach may seem unorthodox, it is worth evaluating to provide a faster method for unambiguous qualitative analysis.
This work describes a method for profiling free NAs by GC-HRAM-MS. The careful combination of adequate column chemistry and the selectivity of negative chemical ionization (NCI) mode for compounds with labile hydrogens made it possible to detect more than 100 species of NAs in a real-world PW sample, proving to be a simpler and faster method compared to methods that use derivatization. Furthermore, this approach also reduced the generation of hazardous residues.
Material and Methods
Reagents and Solutions
The cyclopentanecarboxylic acid (CAS: 3400-45-1), cyclohexanecarboxylic acid (CAS: 98-89-5), benzoic acid (CAS: 65-85-0), cyclohexaneacetic acid (CAS: 5292-21-7), cyclohexanebutyric acid (CAS: 4441-63-8), 1-adamantanecarboxylic acid (CAS: 828-51-3), 1-naphthoic acid (CAS: 86-55-5), and myristic acid (CAS:544-63-8) (Sigma-Aldrich) were used for column evaluation. A working solution containing the analytes at 0.5 mg/L was used to determine the chromatographic parameters. A 10 mg/L working solution of n-decane (Sigma-Aldrich) was used to determine the normalized peak areas of the analytes. The technical mixture of NAs (Sigma-Aldrich; CAS: 1338-24-5; batch: BCBS3204V) was used to prepare a simulated wastewater sample to evaluate the proposed method. All solutions were prepared using 2,2,4-trimethylpentane (isooctane) (Sigma-Aldrich). A real-world sample of PW was provided by the Leopoldo Américo Miguez de Mello Research and Development Center (Cenpes, Petrobras). Methylene chloride and sodium sulfate (Synth) were employed during sample preparation.
Sample Preparation
The simulated sample was prepared by spiking the aqueous matrix with the technical mixture of NAs at 0.5 μg/mL. The aqueous phase exhibited a sodium chloride concentration of 10% (m/v) to simulate the composition of a real PW sample. The aqueous phase was acidified to a pH value of 2 to ensure that all NAs were found in the neutral form for liquid–liquid extraction.
Liquid–liquid extraction (LLE) was performed with 5 mL of the PW sample and aliquots of 5 mL of methylene chloride. The extraction was repeated three consecutive times. The organic phases were pooled in a round-bottom flask with sodium sulfate. The volume of the extract was reduced to 1.5 mL of isooctane. This procedure was applied to both samples, simulated and real-world PW.
Column Evaluation
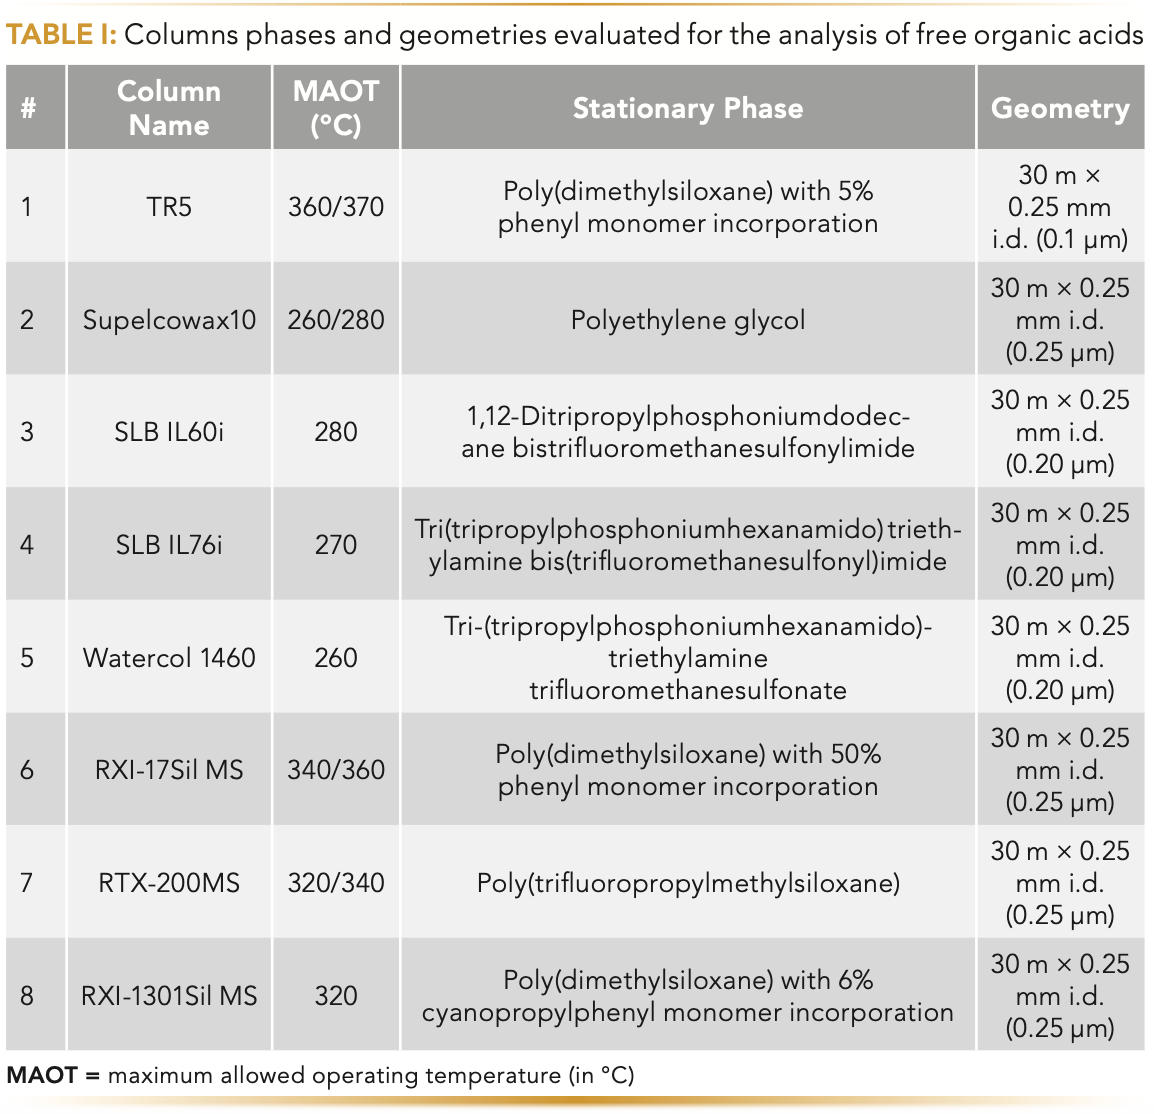
A total of eight columns (Restek Corporation, MilliporeSigma, Sigma-Aldrich, Supelco, and ThermoFisher Scientific) were evaluated for analyzing free NAs, as shown in Table I. All experiments employed the same GC method. The column selection was performed in a Trace 1310 gas chromatograph coupled to an ISQ transmission quadrupole mass spectrometer (Thermo- Fisher Scientific). A Triplus RSH autosampler fitted with a 10 μL syringe was used to inject 1 μL of the sample. Helium was used as the carrier gas at a constant flow rate of 1.0 mL/min. The split–splitless (SSL) injector fitted a 4.0 mm i.d. precision liner (Restek Corporation) was operated at 250 °C and a split ratio of 15:1. The GC oven was programmed as follows: isotherm at 100 °C for 5 min, followed by heating from 100 to the maximum allowed operating temperature (MAOT) at 6 °C/min—except for n-decane wherein the initial oven temperature was 50 °C. The MS transfer line and ion source temperature were 260 and 250 °C, respectively. Electron ionization (EI) was performed at 70 eV and 50 μA of emission current. The full MS spectrum was acquired with a mass range of 80 to 400 Da.
Sample Analysis
A Trace 1310 gas chromatograph coupled to the Q Exactive HRAM–MS fitted with a FT-orbital ion trap mass analyzer (ThermoFisher Scientific) was used for compositional analysis. A TriPlus RSH autosampler fitted with a 10 μL syringe was used for injection of 1 μL of the liquid sample. The injection was performed using a programmable temperature vaporizing (PTV) injector. The inlet was held at 50 °C for 0.5 min and heated to 300 °C at 10 °C/s. A Siltek baffled liner was used for sample vaporization. The PTV was operated in splitless mode at a constant flow rate of 1.0 mL/min (helium). The three best performing columns (SLB-IL60i, RTX-17 Sil MS, and RXI-200 MS) were used for the qualitative analysis. The GC oven was programmed from 50 to 250 °C at a rate of 6 °C/min.
Chemical ionization in negative mode (NCI) was performed using methane at 1.5 mL/min. The ion source and transfer line were kept at 200 and 250 °C, respectively. Full mass spectrum (Full MS) acquisition was used in all analysis. The transmission quadrupole determined the acquisition window of m/z 80 to 500 Da. A full width at half maximum (fwhm) resolving power of 60,000 (at m/z 200) was used. The C-trap method used an automatic gain control (AGC) of 3 × 10⁶ and the ion injection time (IT) was set to automatic.
Data Processing
Xcalibur (ThermoFisher Scientific) was used for instrument control and data collection. The normalized peak areas were determined by dividing the peak area of the analyte by the peak area of the n-decane.
For group-type analysis, the software Composer 2.0 (Sierra Analytics) was used. The parameters employed for elemental assignment were processing (without a signal-to-noise [S/N] filter); ion properties (allow adducts [H]); matching policy (5 ppm mass tolerance window, m/z range 80 to 500, and 0.01% of minimum abundance); heuristic rules mode (use hydrocarbon rules); and element range (Pass 1: maximum four oxygen; Pass 2: maximum four nitrogen; Pass 3: maximum four sulfur; and Pass 4: maximum three oxygen, three nitrogen, and three sulfur, in addition to the C and H ranges). Each assigned class was confirmed by matching the fine isotopic pattern, peak shape restriction using the extracted ion chromatograms (EIC), and with the available analytical standards.
Results and Discussion
Column Evaluation
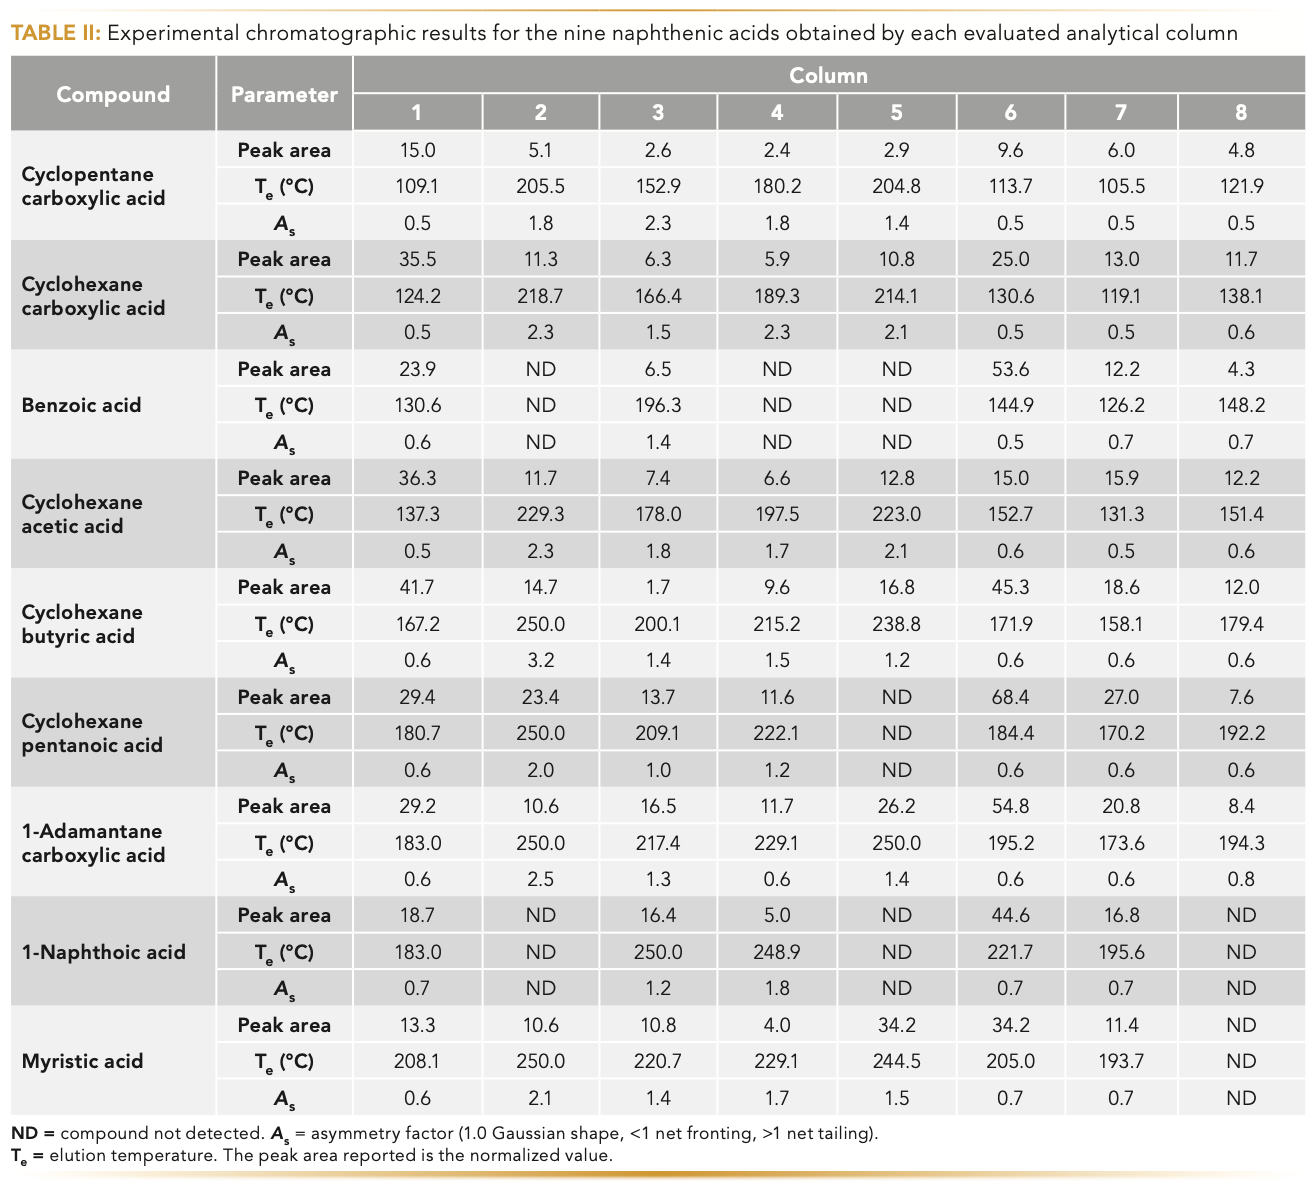
Column selection is likely the most important step in method development. NAs are organic acids that exhibits Henry’s constant of ~8.56 × 10⁻⁶ atm m3/mol (4), which requires phases with adequate MAOT values to perform highly efficient separations. Also, the presence of the acidic moieties may likely influence peak symmetry, which warrants careful evaluation because little to no data are available for free NAs. In this context, it is important that column selection addresses unwanted analyte adsorption and peak shape. Unwanted adsorption can be estimated by comparing the normalized areas of the analytes, whereas the peak shape may influence the overall peak capacity of the separation (19). In this work, we evaluated the role of the column chemistry (Table I) for analyzing the nine model analytes.
The first parameter evaluated in the method development was the MAOT, which dictated the highest temperature that may be employed during separation without deteriorating the stationary phase (chemical breakdown or phase pooling). As seen in Table I, all polysiloxane-based phases exhibited superior values of MAOT compared to polyethylene glycol (PEG) and ionic liquid (IL)–based phases. Polysiloxane-based phases may be interesting choices for analyzing free NAs because they enable more efficient separations for less-volatile compounds. For instance, columns 2, 4, and 5 exhibited the highest retention of the late eluted compounds (Table II). Conversely, the elution temperatures of the peaks were much lower than the MAOT of the column when using columns 1, 3, 6, 7, and 8. Consequently, this result narrowed the list of interesting columns for profiling free NAs.
Next, selectivity of the GC column was evaluated. Currently, there are two main approaches to describe the selectivity according to the polarity number or the solvation properties (20). The solvation parameter model (SPM) accounts for different interactions that may occur between the stationary phase and the analyte (solute). The model for retention of an analyte by gas and liquid chromatography is given by equation 1:

where k is the retention factor for a specific compound; the uppercase letters are the solute descriptors; and the lowercase letters are the system constants. The system constants characterize the solvation properties of the phase and may be defined as the capability of establishing e (electron lone pair interactions); s (dipole-type interactions); a and b (hydrogen-bond basicity and acidity, respectively); and l (dispersive interactions and cavity formation). The c term is related to the phase ratio of the column (20). The solvation properties of the evaluated columns were estimated from previous reports (20–22) by considering phases with similar chemistries, as shown in Table III. Although this approach might not accurately represent the actual solvation properties of the columns evaluated, it was acceptable to provide a solid discussion of the general trends observed in this report.
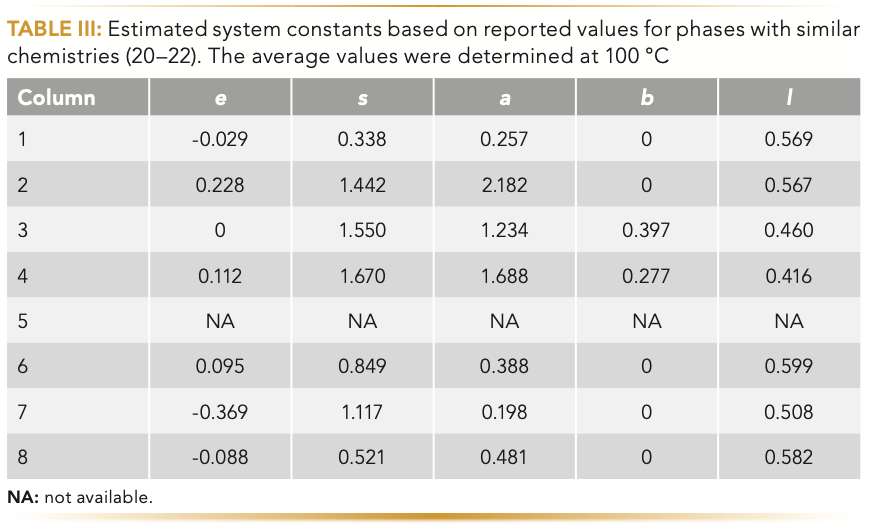
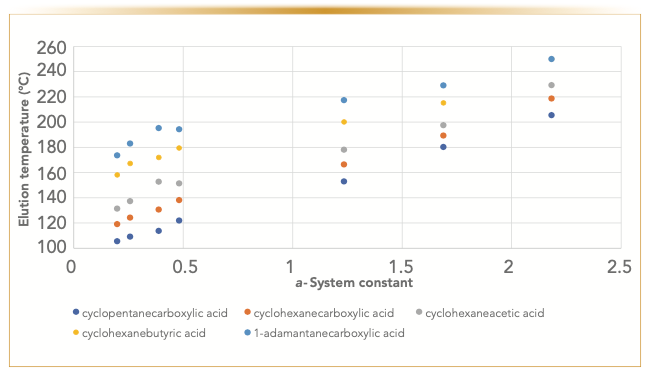
Columns 2 and 4 exhibited the largest values for the hydrogen-bond basicity, which is expected to generate the highest retention factors for NAs because of the presence of an acidic moiety in the analytes, as shown in Figure 2. In fact, the largest retentions (Table II) were observed for columns 2, 4, and 5 whereas the retention factor of the analytes on column 5 were the highest values reported in this study. For instance, the use of the PEG-based phase (column 2) resulted in elution temperatures nearly 80 °C higher than that of polydimethylsilonaxe-based phases (column 1). Although the system constants are not available for column 5, one can speculate that likely the a-system constant should be higher than that of columns 2 and 4, because of the presence of amide groups in the phosphonium-based IL, which is also supported by the consistently large values of retention factors.
FIGURE 2: Dispersion plot of the values of a-system constant vs. elution temperature of model naphthenic acids using columns 1–8. This indicated that the hydrogen-bond basicity (a) of the stationary phases played an important role in the retention of NAs.
Overlapped peaks like cyclohexanepentanoic acid/1-adamantanecarboxylic acid (columns 1 and 4) and 1-naphthoic acid/myristic acid (column 7) were observed. Four overlapped peaks were detected using column 8, namely cyclohexaneacetic acid/benzoic acid and cyclohexanepentanoic acid/1-adamantanecarboxylic acid. These results seem to indicate that columns with higher a-values can generally provide baseline resolution of the NAs. However, careful evaluation of column 4 shows that other solvation properties may also play an important role (e and s) in the separation of NAs. Furthermore, excessive large a-values shifted the elution temperature of the analytes toward the column’s MAOT, therefore narrowing the volatility range of the resulting method.
All columns exhibit asymmetric peaks. The largest asymmetry values were found for column 2 followed by columns 4 and 5. Column 3 exhibited values like polysiloxane-based phases, despite being an IL-derived phase. Most importantly, the largest normalized peak areas were found for columns 1, 3, 6, and 7. This result generally indicates reduced unwanted analyte adsorption during the separation (23,24). The selection of the best-performing columns (3, 6, and 7) was determined after careful consideration the following criteria: column inertness, selectivity, and the MAOT of the column. Thus, the selected columns were used for profiling free NAs in PW samples.
Produced Water Analysis
The selected columns were used in analyzing two samples, a technical NA mixture and a real-world PW sample. Soft ionization was selected to assign the adduct ion, allowing for reliable attribution of the elemental composition of the corresponding peaks in the chromatogram. The analyte response was evaluated using both NCI and positive chemical ionization (PCI). The largest response factors were obtained in NCI. Also, the contribution of hydrocarbons (interfering compounds) was much lower in NCI compared to PCI. Hence, NCI was selected for the analysis of the free NAs.
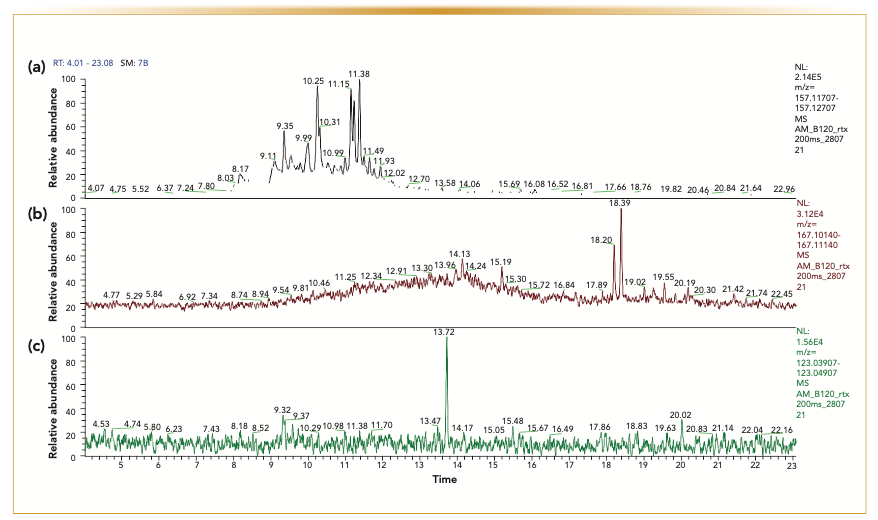
The qualitative results showed that the total number of peaks detected using columns 6 and 7 was considerably larger than that of column 3 (Table IV). Similarly, the number of peaks with the general formula CxHyO2 (O class) was also consistently higher using columns 6 and 7 compared to column 3. The results obtained with columns 6 and 7 indicate the presence of NAs with carbon numbers ranging from C6 to C16 with DBE values from 1 (Z = 0) to 8 (z = -14). Representative compounds like monocyclic, adamantane, and aromatic acids are illustrated in Figure 3. These results showcased the importance of proper column selection for profiling free NAs in produced water. Although the current method was successfully applied to the detection of acids found in the range of low μg/mL, there are many additional sample preparation strategies under investigation to further improve the sensitivity of the method (25).
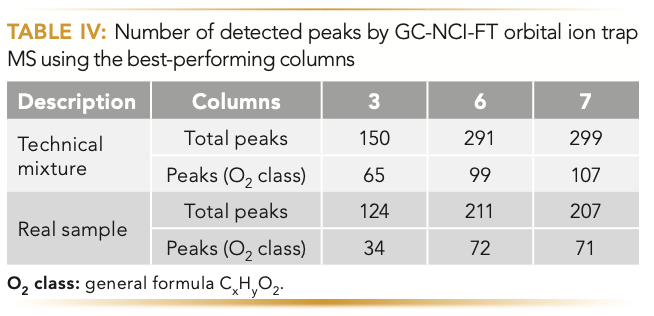
FIGURE 3: Extracted ion chromatograms (EIC) of the real produced water sample obtained by GC-NCI-FT-orbital ion trap MS using column 7, exhibiting the isobaric peaks for (a) a monocyclic acid C9H16O2 (m/z 157.12207; DBE of 2), (b) an adamantanecarboxylic acid C10H14O2 (m/z 167.10640; DBE of 4), and (c) an aromatic acid C7H6O2 (m/z 123.04407; DBE of 5). The m/z value refers to the adduct ion [M-H]-. The EIC was plotted using a 5-ppm mass range.
Conclusions
In this work, a method for qualitative analysis of free NAs was successfully developed. Method development included careful column selection based on selectivity, chemical inertness, and chromatographic performance. The three best performing columns (RXI-17Sil MS, RTX-200MS, and SLB-IL60i) allowed the profiling of NAs, but the most informative chromatograms were obtained with polysiloxane-based phases. Important classes of acids (O2 class) were detected in the range of low μg/mL, including monocyclic acids, adamantane acids, and aromatic acids. The hope is that this proof-of-concept study illustrates the importance of column selection during GC method development.
References
(1) A.J.A. Simões, R.O. Macêdo-Júnior, B.L.P. Santos, D.P. Silva, and D.S. Ruzene, Water Air Soil Pollut. 232, 297 (2021).
(2) Y. Liu, Y. Li, H. Xu, Z. Pan, P. Dai, H. Wang, and Q. Yang, Sci. Total Environ. 775, 145485 (2021).
(3) K. Lee and J. Neff, Eds., Produced Water (Springer, New York, New York, 2011).
(4) L.D. Brown and A.C. Ulrich, Chemosphere 127, 276–290 (2015).
(5) J.V. Headley, K.M. Peru, and M.P. Barrow, Mass Spectrom. Rev. 35, 311–328 (2016).
(6) S.N. Shah, M.I.A. Mutalib, R.B.M. Pilus, and K.C. Lethesh, Energy Fuels 29(1), 106–111 (2015).
(7) J. Wen, J. Zhang, Z. Wang, and Y. Zhang, J. Pet. Sci. Eng. 146, 1–9 (2016).
(8) C. Li, L. Fu, J. Stafford, M. Belosevic, and M.G. El-Din, Sci. Total Environ. 601–602, 1785–1802 (2017).
(9) A. Mahaffey and M. Dubé, Environ. Rev. 25(1), 97–114 (2017).
(10) K.A. Kovalchik, M.S. MacLennan, K.M. Peru, J.V. Headley, and D.D.Y. Chen, Front. Chem. Sci. Eng. 11(3), 497–507 (2017).
(11) M.P. Barrow, K.M. Peru, D.W. McMartin, and J.V. Headley, Energy Fuels 30(5), 3615–3621 (2015).
(12) L.B. Moura, R.F. Guimarães, H.F.G. Abreu, H.C. Miranda, and S.S.M. Tavares, Mater. Res. 5(2), 277–284 (2012).
(13) F.M. Holowenko, M.D. MacKinnon, and P.M. Fedorak, Water Res. 36(11), 2843– 2855 (2002).
(14) J.S. Clemente, N.G.N. Prasad, M.D. MacKinnon, and P.M. Fedorak, Chemosphere 50(10), 1265–1274 (2003).
(15) P.R. Kanneland and T.Y. Gan, J. Environ. Sci. Health A Tox. Hazard Subst. Environ. Eng. 47(1), 1–21 (2012).
(16) D.E. Raynie, LCGC N. Am. 36(1), 14–17 (2018).
(17) D.T. Mannion, A. Furey, and K.N. Kilcawley, J. Dairy. Sci. 99, 5047–5063 (2016).
(18) A.H. Woo, R.C. Lindsay, J. Dairy Sci. 63(7), 1058–1064 (1980).
(19) H.M. McNair, J.M. Miller, and N.H.Snow, Basic Gas Chromatography (John Wiley & Sons, Hoboken, New Jersey, 2019).
(20) C.F. Poole, J. Chromatogr. A 1604, 460482 (2019).
(21) N.Lenca and C.F. Poole, J. Chromatogr. A 1525, 138–144 (2017).
(22) N. Lenca and C.F. Poole, J. Chromatogr. A 1524, 210–214 (2017).
(23) L.W. Hantao, A. Najafi, C. Zhang, F. Augusto, and J.L. Anderson, Anal. Chem. 86(8), 3717–3721 (2014).
(24) C. Cagliero, C. Bicchi, C. Cordero, E. Liberto, P. Rubiolo, and B. Sgorbini, J. Chromatogr. A 1495, 64–75 (2017).
(25) N.P. Aguiar, J. Crucello, R. Facanali, I. Medeiros Junior, R.M. Carvalho, L.W. Hantao, J. Chromatogr. A 1655, 462485 (2021).
About The Authors
Juliana Crucello and Leandro Wang Hantao are with the Institute of Chemistry at the University of Campinas in Campinas, Brazil.

Rogerio Mesquita Carvalho is with the Leopoldo Américo Miguez de Mello Research and Development Center, an unit of Petrobras, in Rio de Janeiro, Brazil.

About The Column Editor
David S. Bell is a director of Research and Development at Restek. He also serves on the Editorial Advisory Board for LCGC and is the Editor for “Column Watch.” Over the past 20 years, he has worked directly in the chromatography industry, focusing his efforts on the design, development, and application of chromatographic stationary phases to advance gas chromatography, liquid chromatography, and related hyphenated techniques. His main objectives have been to create and promote novel separation technologies and to conduct research on molecular interactions that contribute to retention and selectivity in an array of chromatographic processes. His research results have been presented in symposia worldwide, and have resulted in numerous peer-reviewed journal and trade magazine articles. Direct correspondence to: LCGCedit@mmhgroup.com


New Method Explored for the Detection of CECs in Crops Irrigated with Contaminated Water
April 30th 2025This new study presents a validated QuEChERS–LC-MS/MS method for detecting eight persistent, mobile, and toxic substances in escarole, tomatoes, and tomato leaves irrigated with contaminated water.

.png&w=3840&q=75)

.png&w=3840&q=75)


.png&w=3840&q=75)


.png&w=3840&q=75)


