Simple Purification and Ultrahigh-Pressure Liquid Chromatography–Tandem Mass Spectrometry Determination of Five Quinoxaline 1,4-dioxides and their Metabolites in Swine Liver
Peer-Reviewed Article
In some countries, quinoxaline 1,4-dioxide (QdNO) has been banned as a feed additive because of its potential genotoxicity. To assess the residue levels in animal tissues, an ultrahigh-pressure liquid chromatography tandem mass spectrometry (UHPLC–MS/MS) method was developed to determine five QdNOs and its eight main metabolites in swine liver. The samples were simply extracted by 0.1% formic acid in acetonitrile (4+6, v/v) after being acidified with 3 mol/L of 0.1% hydrochloric acid, and purified using a HLB cartridge. The UHPLC–MS/MS provided good linearity to the peak area, with the linear correlation coefficients of over 0.98 within the concentration range of 5–500 μg/L. The limit of detection (LOD) was 0.30–2.51 μg/kg, and the limit of quantification (LOQ) was 1.10–8.37 μg/kg for the 13 target compounds. When the target compounds spiked at 10, 100, and 500 μg/kg, the recoveries ranged from 79.8 to 96.5%. This method is suitable for the residual determination of real samples.
In the husbandry industry, quinoxaline 1,4-dioxides (QdNOs), including mequindox (MEQ), cyadox (CYA), olaquindox (OLA), quinocetone (QCT), and carbadox (CBX), were once effective antibacterial and growth promoting agents for food animals (1–3). However, the toxicity of QdNOs has gradually been revealed, and several countries have taken measures to restrict their use as feed additives. OLA has been banned as a feed additive in Europe and Canada because of its potential genotoxicity. CBX was banned in Europe in 1998 because of its mutagenic and genotoxic effects (4). MEQ was reported to have strong cytotoxicity (5). QCT was found to be genotoxic at high concentrations, whereas CYA exhibits weak potential mutagenicity (6,7). Recently, China has issued a ban on all QdNOs for feed additive use (8). After the intake of QdNOs, these are degraded to its metabolites, which has been reported to be closely correlated to the toxicity of QdNOs (9,10). The 3-methyl-qinoxaline-2-carboxylic acid (MQCA) and qinoxaline-2-carboxylic acid (QCA) were identified as marker residues of OLA and CBX, respectively, whereas the marker residues of other QdNOs remain under debate (11–14).
Despite these restrictions, QdNOs are still illegally used in some countries. For food safety concerns, there is an urgent need to set up a reliable analysis method for detecting QdNOs and its main metabolites in animal tissues. Several methods have been reported that can detect some of the QdNOs and its metabolites. He and others detected CYA and its metabolites in plasma by using liquid chromatography tandem mass spectrometry (LC–MS/MS) (15). Zeng and others detected MEQ and its metabolites in porcine tissues (16). You and others detected MEQ and its main metabolites in chicken muscle, chicken liver, swine muscle, and swine liver using UHPLC–MS/MS (17). MEQ, QCT, and its major metabolites in chicken and pork were analyzed using ultrahigh-pressure liquid chromatography tandem mass spectrometry (UHPLC–MS/MS) by Li and others, and three QdNOs and its metabolites were also traced in abalone using LC–MS/MS (18,19). Xie and others detected OLA and its major metabolite in fish tissues (20). Currently, the main problem in detecting QdNOs is determining its metabolites (21). Existing methods lack efficiency because none of those methods managed to detect the five QdNOs and its main metabolites. In the present study, the investigators developed an efficient and reliable UHPLC–MS/MS method, in which five QdNOs and eight of its metabolites in swine liver could be detected at one time. This method can be applied for detecting QdNOs and its major metabolites in real samples.
Materials and Methods
Chemicals, Reagents, and Instruments
Olaquindox and carbadox (Sigma-Aldrich Co., both are 99%); mequindox (China Institute of Veterinary Drug Control, 99%); and quinoxaline-2-carboxylic acid, methyl-3-quinoxaline-2-carboxylic acid, and quinocetone (Dr. Ehrenstorfer GmbH Co., 94%, 94%, and 97%, respectively), were used in this study. The other compounds were obtained from the National Reference Laboratory for Veterinary Drug Residues of Hua Zhong Agriculture University.
The HLB solid-phase extraction (SPE) cartridges used in this study came from Waters (200 mg, 6 mL). Methyl alcohol, acetonitrile, and formic acid came from Dima Co. (all chromatographic grade). The other reagents were analytical grade and obtained from the Beijing Secondary Chemical Factory. The ultrapure water was obtained from the Milli-Q filtration system (Millipore).
An Acquity UHPLC liquid chromatograph (Waters Co.), equipped with a Quattro LC three-level quadrupole mass spectrometer (Micromass Company), was used for this study. This study also used a 5805R centrifuge (Eppendorf), a Waters solid-phase extraction device, a R200 rotary evaporator (Buchi), and an OA-SYS sample concentrator (Organomation Associates).
Sample Extraction and Cleanup
The 2.5 g homogenized swine liver was placed in a 50-mL polypropylene centrifuge tube. Then, 1 mL of 0.3 mol/L of hydrogen chloride was added to the tube. Afterwards, this solution was vortexed for 1 min, and 10 mL of 0.1% formic acid in acetonitrile (4:6, v/v) was added. Next, this sample was vortexed again for 1 min and centrifuged at 8000 r/min for 5 min. Then, the supernatant was taken, and 10 mL of 0.1% formic acid in acetonitrile (4:6, v/v) was added to the precipitate to re-extract again. Two supernatants were combined, and mixed with 5 mL of n-propyl alcohol. This mixed solution was evaporated to less than 2 mL at 60 °C using the R200 rotary evaporator. Then, 10 mL of 0.1 mol/L potassium dihydrogen phosphate solution was added to the evaporation residue and vortexed for 30 s. Afterwards, the obtained solution served as the sample extract and was preserved for the clean-up process.
The HLB SPE cartridge was activated by 5 mL of methanol, and conditioned by 5 mL of water. The sample extract was loaded on the cartridge and passed through. Then, the cartridge was rinsed with 3 mL of 0.02 mol/L hydrochloric acid and 3 mL of 3% methanol. The target compounds were eluted from the cartridge by 5 mL of methanol. Afterwards, the eluate was collected and evaporated with nitrogen at 60 °C, and the evaporation residue was dissolved with 1.0 mL of 10% acetonitrile and filtered through a 0.22 μm membrane. The obtained solution was gradually prepared to be injected into the LC–MS/MS system.
LC–MS/MS Detection
An Acquity UHPLC BEH C18 (50 x 2.1 mm i.d., 1.7 um) column attached to an Acquity UHPLC liquid chromatograph was used for the separation. The mobile phase was composited of A (0.1% formic acid in water) and B (0.1% formic acid in methanol), with the following gradient elution: It started as 88% A and kept to 1 min before changing to 50% A at 2 min. It then changed to 12% A at 3.5 min before changing to 50% A at 4.5 min. The gradient elution then changed to 88% at 5.0 min and kept to 6.0 min. The flow rate was 0.3 mL/min, and the injection volume was 10 μL.
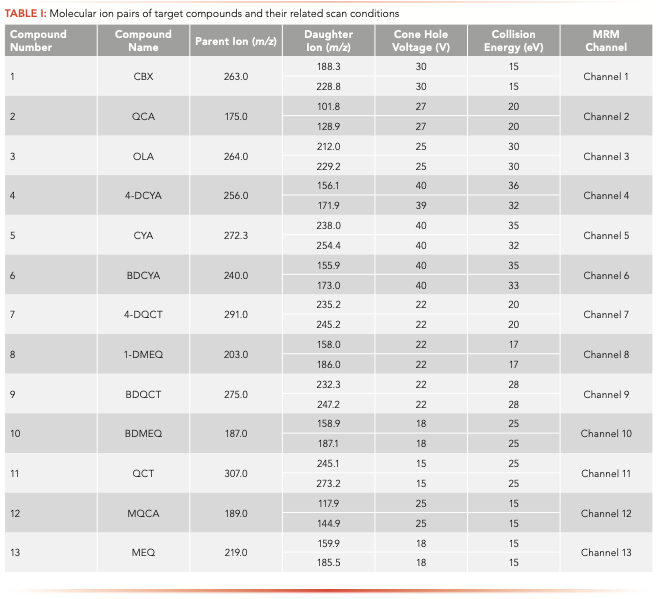
The mass spectrometric detection was carried out using a Quattro LC three-level quadrupole mass spectrometer. Electrospray ionization (ESI) was used with the positive ionization mode of multiple reaction monitoring (MRM). The capillary voltage was set as 2.8 kV, the ion source temperature was 80 °C, and the desolvation temperature was 350 °C. The flow rate of the collision gas and desolvation gas was 28 L/hr and 597 L/hr, respectively. The other detection conditions are shown in Table II.
Method Validation
A series of single and mixed standards (with 13 compounds mixed at the same concentration together) was prepared at concentrations of 1, 2, 10, 20, 50, 100, and 500 μg/L. The single standards were initially dissolved with dimethyl sulfoxide to 1000 μg/mL and subsequently diluted to the target concentration with methanol. The mixed standards were diluted with methanol. These standards were analyzed using LC–MS/MS under an optimized condition. The quantification concentration was taken as the horizontal ordinate (X), while the peak area was taken as the vertical ordinate (Y). Then, linear regression analysis was performed for each compound, the calibrated regression equation was used for quantification, and its relevant coefficient was used to prove its linear level. The concentration of the actual samples was calculated through the standard curve method or single-point correction method.
The proper number of blank samples was placed in the tubes, and spiked with the proper concentration of the standard at concentrations of 0, 10, 100, and 500 μg/kg, and each concentration was set for five replicates. All samples were pretreated and injected into the LC–MS/MS system. This experiment was repeated three times on three different days. The recoveries and interday and intraday coefficients of each compound was calculated.
Next, 10 blank swine livers were pretreated and injected into the LC–MS/MS system. The signal-to-noise ratio (S/N) of each compound in the samples was calculated. The limit of detection (LOD) is defined as triple the mean S/N of 10 samples of each compound. The limit of quantification (LOQ) is defined as ten times the mean S/N of 10 samples for each compound.
Results
Optimizing the Analysis Conditions
For the basic parameter values recommended by the instrument, adjusting the flow rate of both the atomized and dry gas was the quickest way to achieve the high sensitivity.
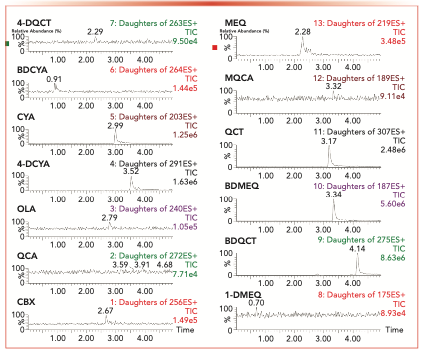
Several 100 μg/L mixed standard solutions of the 13 compounds were detected in different parameters. The results were shown that the gas velocity of the cone hole at 27 L/hr, combined with the velocity of desolvation gas at 597 L/hr, obtained the best sensitivity. The characteristic ion chromatograms with the worst parameter combinations and best parameter combinations were produced on the cone hole at 20 L/ hr combined with desolvation gas at 502 L/hr, and the cone hole at 27 L/hr combined with desolvation gas at 597 L/hr, respectively. As a result, the latter one was selected as the proper conditions (Figure 1).
FIGURE 1: Full scan chromatograms of target compounds (listed in upper left for each subfigure—cone gas rate of 20 L/hr and desolvent gas rate of 502 L/hr). Abscissa label is time (min), and the ordinate label is the percentage (%).
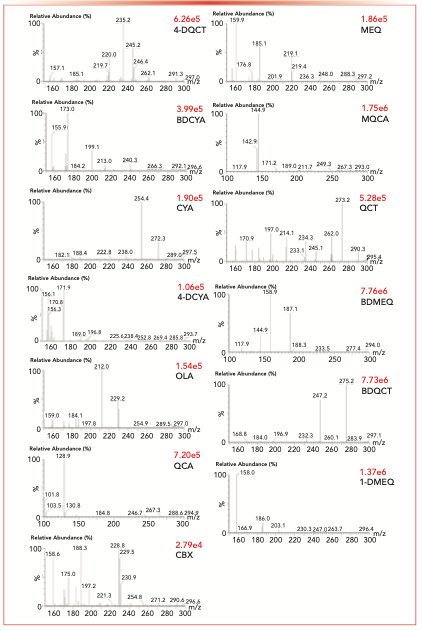
To determine the parent ion and daughter ion pairs for all compounds in the tandem mass spectrum, a daughter scanning of [M+H]+ peaks of all compounds was carried out under another stable mass condition. Two daughter ions with the highest abundance and higher stability of each compound were selected as the daughter ions for the MS/MS analysis (Figure 2). Afterwards, the combination of the voltage and collision energy of the cone hole was optimized to obtain the best daughter ions. Table I shows the final ion pairs and its analysis conditions.
FIGURE 2: Daughter ions of target compounds (listed in the upper right for each subfigure—cone gas rate of 20 L/hr and desolvent gas rate of 502 L/hr). The abscissa label is m/z, and the ordinate label is relative abundance (%).
Sample Preparation
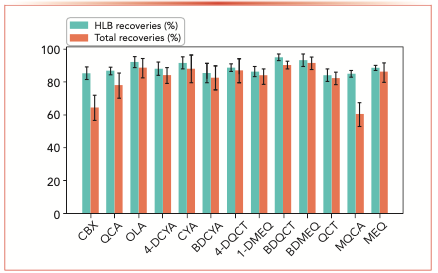
As shown in Figure 3, when the concentration was 1, 10, and 50 μg/L, the total method recoveries ranged within 80.3–98.7%. The HLB cartridge was evaluated to analyze the recovery and phospholipid removal from the liver matrix. It could be observed in Figure 4 that when this spiked at 1,000 μg/kg, the measured recoveries for the SPE clean-up was higher than 84.1% for all compounds, with the recoveries of most compounds higher than 85%. For 10 of the 13 compounds, the HLB recoveries were numerically close to the total recoveries, indicating that the clean-up process had a minimal contribution to the recovery losses in this method.
FIGURE 3: (Colored bars) Recovery and (error bars) CV data of (blue) intraday and (orange) interday results for thirteen target compounds. Abscissa label is target compound, and ordinate label is recovery (%).
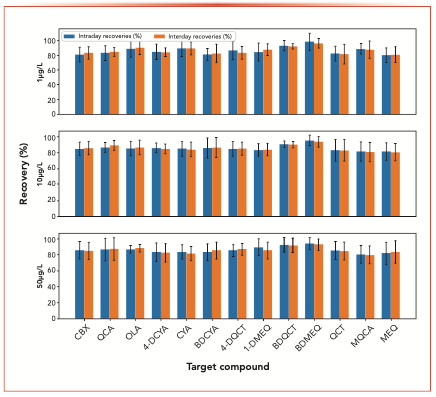
FIGURE 4: Recovery data for target compounds obtained using HLB cartridge clean-up process (spiked at 1000 μg/kg). Abscissa label is target compound, and ordinate label is the recovery (%).
Method Validation
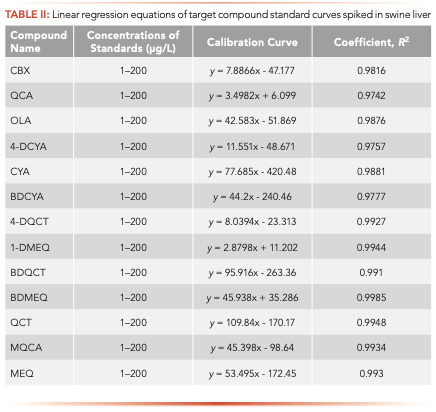
According to the relationship of the concentration and peak area values, the standard curves of each compound were calculated at the concentration range of 5–500 μg/L (Table II). It could be observed that the linear correlation coefficients of these 13 linear regression equations were over 0.98, proving that each calibration curve had an extraordinary linear correlation.
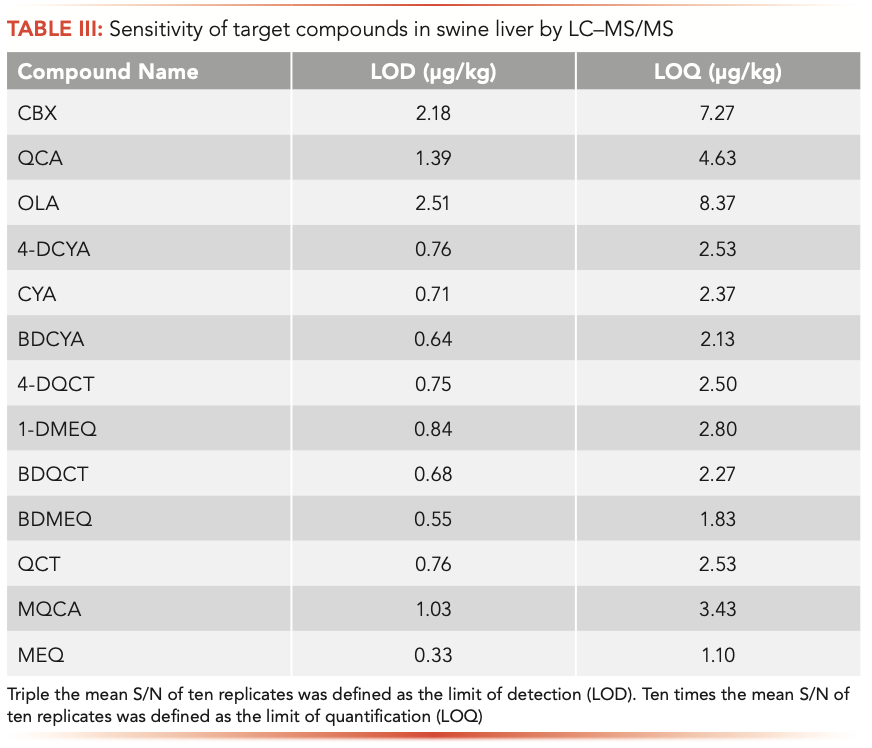
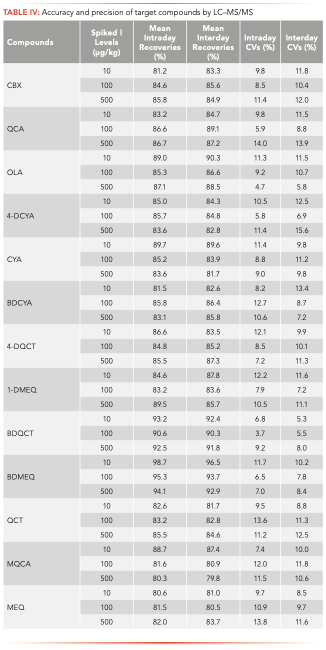
The LOD and LOQ results are shown in Table III. The LOD values of the 13 compounds were within the range of 0.30–2.51 μg/kg, and the LOQ values were within 1.10–8.37 μg/kg, indicating that this method is sensitive for determining these 13 compounds. The average recovery, lower intraday coefficient variation, and higher inter-day coefficient variation of each compound spiked at 10, 100, and 500 μg/kg. Table IV displays these data. The recoveries ranged within 79.8–96.5%, with lower intraday coefficient variations of 3.7–14.0%, and upper inter-day coefficient variations of 5.30–15.60%. These data prove that this method has good accuracy.
Discussion
Among all reports of the LC–MS methods, researchers have generally focused on sample preparation, chromatographic separation conditions, and optimization of MS conditions (22,23). In our opinion, the solvent used for dissolving before the injection of samples to the LC–MS system should be considered because this might be the key factor for the detection. A few published works have provided a detailed discussion on this subject. The solvent used to solubilize samples not only affects the solubility and stability of the target compounds, but also affects the molecular form of some compounds in the solvent, and influences its chromatographic separation behavior. Many compounds are generally covalent compounds or ionic compounds with a certain polarity. The status would be affected by the solvent molecules or ions and weakly and noncovalently bind to the solvent molecules or ions to form a variety of existing forms, such as molecular, positive ion, negative ion, primary positive ion, and secondary ion. In the chromatographic separation process, these different forms have different partition coefficients and lead to different peak times, which may lead to confusion in the qualification and quantitative analyses.
The solvent with a high organic phase was initially adopted to dissolve the samples before injecting these to the LC–MS system. However, this process resulted in poor separation. To solve this problem, the chromatographic behavior of 13 compounds in different organic phase–water phase compositions and different acid–base conditions as loading solutions, were investigated. The effects of pH and the proportion of water in the desolvent solution were significantly different. Although all 13 compounds have quinoxaline rings, regardless of whether the 1,4-position of their quinoxaline rings are connected to oxygen atoms, the structure of the side chain at position 2, and the presence or absence of the side chain at position 4 have important effects on the physicochemical characteristics, such as the aqueous solubility and dissociation constant of the compounds. Different side chain structures resulted in different dissociation properties in the solution, which lead to different morphologies at different pH values, and in different proportions of organic and aqueous phases. The different morphologies ultimately lead to different peak forms and characteristics, in terms of chromatographic behavior. With this consideration, 10% acetonitrile was finally chosen as the solution to dissolve the samples before the injection. Among the liquid-phase conditions listed in the present study, the best mobile-phase components were 12% A (0.1% formic acid) + 88% B (acetonitrile containing 0.1% formic acid) to 88% (0.1% formic acid) + 12% B (acetonitrile containing 0.1% formic acid). Compared with this mobile phase, 10% acetonitrile was a weak solvent, while acetonitrile (containing 0.1% formic acid), acetonitrile, and 80% acetonitrile were all strong solvents.
After the sampling, the solvent of the sample could be regarded as part of the mobile phase in the column. When the solvent elution intensity of the dissolved sample was greater than that of the mobile phase, this would become the mobile phase. Then, the solvent band of the sample would migrate faster in the chromatographic column, while some samples would be dissolved in the mobile phase with a weak elution ability during the elution process, which would cause a series of problems, such as the broadening or bifurcation of the chromatographic peak, and lead to a decrease in column efficiency and the accuracy of the analytical method. This conclusion can be proven by the fact that the 13 target compounds were well-separated in 10% acetonitrile.
Conclusion
An analytical method was developed for the simultaneous determination of five QdNOs and the eight metabolites in swine liver. The investigators provided an effective sample preparation for the target compounds in swine liver. Furthermore, the investigators managed to extract the target compounds using acid treatment. Then, the simple clean-up procedure using the HLB cartridge removed most of the matrix from the liver extracts. The LC–MS/MS process revealed that this method resulted in high sensitivity and accuracy. The present method can be applied for determining QdNOs and metabolites in real samples.
Acknowledgments
Funding Information
This work was financially supported by the National Key Research and Development Projects of China (Grant no. 2018YFC1603005) and the 973 National Basic Research Program of China (Grant no. 2009CB118801).
Competing Interests Statement
The authors declare that they have no conflict of interest.
Compliance with Ethical Standards
We consent to publish this work and its information and images in an online open access publication.
Consent for Publication
All authors declare to consent to publish this work.
Availability of Data and Material
The datasets analyzed in the study are available from the corresponding author on reasonable request.
References
(1) A.A. Abu-Hashem, Am. J. Org. Chem. 5, 14–56 (2015).
(2) J.A. Pereira, A.M. Pessoa, M. Cordeiro, R. Fernandes, C. Prudencio, J.P. Noronha, and M. Vieira, Eur. J. Med. Chem. 97, 664–672 (2015).
(3) Y. Zhao, G. Cheng, H. Hao, Y. Pan, Z. Liu, M. Dai, and Z. Yuan, BMC Vet. Res. 12, 186 (2016).
(4) Communities C Official Journal of the European Communities Legislation Council regulation 2788/98 (1998).
(5) Y. Liu, W. Jiang, Y. Chen, Y. Liu, P. Zeng, F. Xue, and Q. Wang, Mutat. Res-Gen. Tox. En. 797, 36–45 (2016).
(6) X. Wang, G.J. Fang, Y.L. Wang, A. Lhsan, L.L. Huang, W. Zhou, Z.L. Liu, and Z.H. Yuan, Food Chem. Toxicol. 49, 1068–1079 (2011).
(7) X. Wang, W. Zhang, Y.L. Wang, A. Ihsan, M.H. Dai, L.L. Huang, D.M. Chen, Y.F. Tao, D.P. Peng, Z.L. Liu, and Z.H. Yuan, Food Chem. Toxicol. 50, 1600–1609 (2012).
(8) Ministry of Agriculture and Rural Affairs of China. No. 194 (2019) Stop the production and distribution of imported pharmaceutical feed additives to promote growth. Code for safe use of feed additives. http://www.moa.gov.cn/nybgb/2019/201907/202001/t20200103_6334292.htm
(9) X.J. Huang, H.H. Zhang, W. Xu, L.L. Huang, L.Y. Zhang, C.X. Yan, L. Yu, and Z.H. Yuan, Chem. Biol. Interact 185, 227–234 (2010).
(10) Z.Y. Liu and Z.L. Sun, Med. Chem. 9(8), 1017–1027 (2013).
(11) D.P. Peng, X.Y. Zhang, Y.L. Wang, Y.H. Pan, Z.L. Liu, D.M. Chen, F. Sheng, and Z.H. Yuan, Food Chem. 237, 290–296 (2017).
(12) P. Li, X. Zhang, J. Zhang, Z. Yan, S. Zhang, S. Chen and Y. Fang, J. Chromatography B. 1074–1075, 39–45 (2018).
(13) D.P. Peng, O. Kavanagh, H.J. Gao, X.Y. Zhang, S.J. Deng, D.M. Chen, Z.L Liu, C.Q. Xie, C.S. Tu, and Z.H. Yuan, Food Chem. 302, 124623 (2020).
(14) D.W.M. Sin, L.P.K. Chung, M.M.C. Lai, S.M.P. Siu and H.P.O. Tang, Analytica Chimica. Acta. 508, 147–158 (2004).
(15) L.M. He, K.Y. Liu, Y. J. Su, J.H. Zhang, Y.H. Liu, Z.L. Zeng, B.H. Fang, and G.J. Zhang, J. Sep. Sci. 34, 1755–1762 (2011).
(16) D.P. Zeng, X.G. Shen, L.M. He, H.Z. Ding, Y.Z. Tang, Y.X. Sun, B.H. Fang, and Z.L. Zeng, J. Sep. Sci. 35, 1327–1335 (2012).
(17) Y.L. You, L.T. Song, Y.S. Li, Y.T Wu, and M. Xin, J. Agr. Food Chem. 64, 2394–2404 (2016).
(18) Y. Li, K. Liu, R.C. Beier, X. Cao, J Shen, and S. Shen, Food Chem. 160, 171–179 (2014).
(19) Y. Li, M. Sun, X. Mao, J. Li, M.W. Sumarah, Y. You, and Y. Wang, J. Sci. Food Agr. 99, 5550–5557 (2019).
(20) J. Xie, W.J. Zeng, X.Y. Gong, R. Zhai, Z.J. Huang, M.Y. Liu, G.Q. Shi, Y. Jiang, X.H. Dai, and X. Fang, Food Anal. Method 12, 2665–2674 (2019).
(21) J.O. Boison, S.C. Lee, and R.G. Gedir, Analytica. Chimica. Acta. 637, 128–134 (2009).
(22) T. Sniegocki, M. Gbylik-Sikorska, A. Posyniak, and J. Zmudzki, J. Chromatography B. 944, 25–29 (2014).
(23) W. Liu, W. Pan, and J. Wu, J. Food Saf. Food Qual. 11, 883–890 (2020).
Yehui Luan, Junjie Zhao, Kexin Chen, Yiyan Wang, and Linli Cheng are with the College of Veterinary Medicine at the China Agriculture University, in Beijing, China. Direct correspondence to Linli Cheng at: chenglinli@cau.edu.cn.
Evaluating the Accuracy of Mass Spectrometry Spectral Databases
May 12th 2025Mass spectrometry (MS) can be effective in identifying unknown compounds, though this can be complicated if spectra is outside of known databases. Researchers aimed to test MS databases using electron–ionization (EI)–MS.
Investigating 3D-Printable Stationary Phases in Liquid Chromatography
May 7th 20253D printing technology has potential in chromatography, but a major challenge is developing materials with both high porosity and robust mechanical properties. Recently, scientists compared the separation performances of eight different 3D printable stationary phases.
Characterizing Polyamides Using Reversed-Phase Liquid Chromatography
May 5th 2025Polyamides can be difficult to characterize, despite their use in various aspects of everyday life. Vrije Universiteit Amsterdam researchers hoped to address this using a reversed-phase liquid chromatography (RPLC)-based approach.

.png&w=3840&q=75)

.png&w=3840&q=75)


.png&w=3840&q=75)


.png&w=3840&q=75)


