“Practical HPLC Simulator”: A Useful Freeware for Learning HPLC
Column: Perspectives in Modern HPLC
The “practical HPLC simulator” is a freeware program that uses actual separation data to demonstrate the chromatographic principles under isocratic or gradient conditions and the impacts of instrumental, column, and mobile phase parameters on method performance.
In March 2020, the University of Geneva suspended all face-to-face courses and practical works during the pandemic. We began to teach through distance learning and developed an Excel spreadsheet to simulate the chromatographic analyses that our students in the laboratory performed. Previously, we acquired a database of ~4500 separation experiments (37 molecules, four columns, two organic modifiers, four mobile phase pH, two temperatures, and two gradient times) to allow the extrapolation of the chromatographic behaviors of the compounds. However, hundreds of hours of work were still required to integrate all the experimental data with the fundamental chromatographic equations to allow reasonable simulation.
We decided to offer this useful education tool to the scientific community as freeware from the School of Pharmaceutical Science’s website. The program has been downloaded 4000 times since its launch in November 2020. The program has received positive feedback from teachers and users, and we hope that this freeware will help the global practitioners to better understand the myriad intertwining factors in high performance liquid chromatography (HPLC).
Dr. Davy Guillarme
Senior Lecturer and Research Associate University of Geneva
Author, Practical HPLC Simulator v.1.0
About HPLC
High performance liquid chromatography (HPLC) is a widely practiced analytical technique used in research and product quality assessments (1,2). Although many analytical chemists learn HPLC in universities by taking separation science classes, most practitioners acquire working knowledge from their laboratory colleagues or by performing assays. Others learn from textbooks (1–5), short courses at national meetings (6), online content providers (7,8), and training sessions by equipment manufacturers or consumables suppliers. Nevertheless, most learning platforms are fee-based and have pros and cons that may not satisfy the needs of individual learners.
I recently came across an HPLC simulation program from the University of Geneva that offers a free learning platform for practicing scientists in augmenting their understanding of basic HPLC concepts. This article provides insights on how to get started and a case study on its use.
An Introduction and How to Download the Program
The Practical HPLC Simulator v.1.0 is a free excel spreadsheet with macros that provides simulated chromatograms from several separation data sets. Dr. Davy Guillarme developed the program at the University of Geneva’s School of Pharmaceutical Sciences with contributions from Balazs Bobaly and Jean-Luc Veuthey. This program can be downloaded from the following link: https://ispso.unige.ch/labs/fanal/practical_ hplc_simulator:en
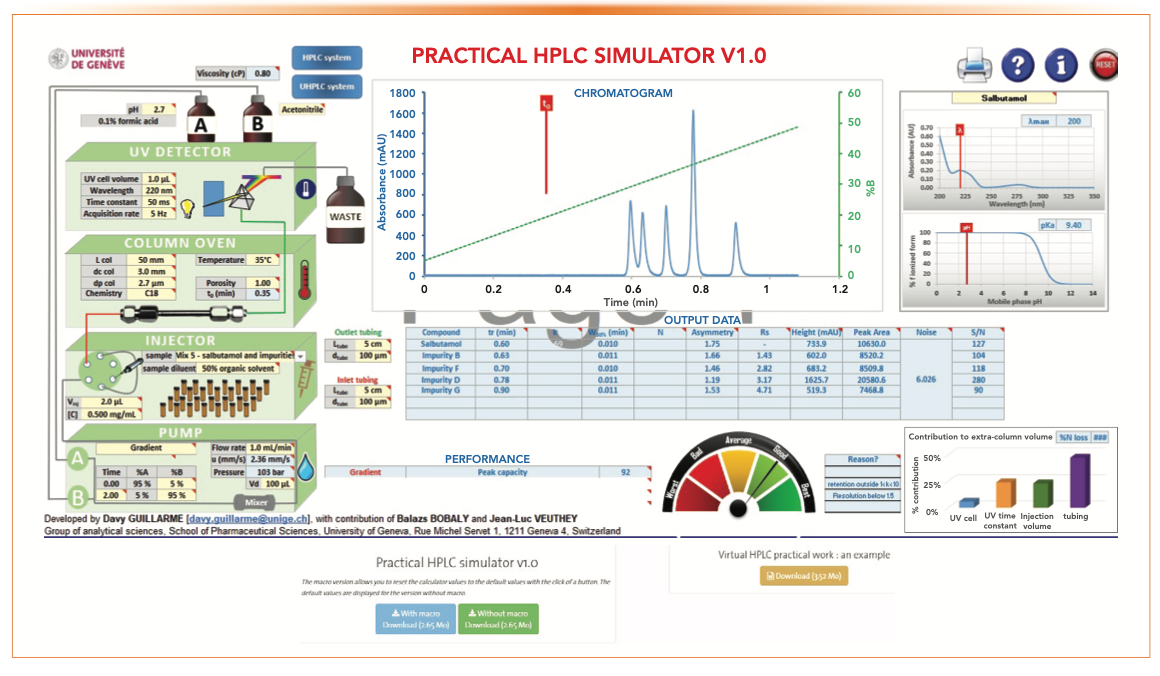
Figure 1 shows the main menu and the download links. The user should click on the blue button to download the spreadsheet with Macro and an accompanying document called the “Virtual HPLC work document” (brown button) that explains the terms and procedures.
FIGURE 1: A screenshot of the main menu of the Practical HPLC Simulator program and its download links.
A Demo Example
Once downloaded, the program allows the user to enter a data set on the column, the mobile phases, and the instrument settings and then observe the effects of these variables on the selected chromatographic examples. The user can “hover” the mouse pointed above the red triangle to view more information on the parameter and suggested values. The user can explore freely and revert all entries to the original set by pressing the reset button on the top right corner of the main menu.
Here is a step-by-step demonstration example that allows the user to get familiar with the simulation process:
1. Enter “UHPLC” system, mobile phases, column, and operating parameters (see Figure 2). The explanations and suggestions for each parameter are automatically given as .xls comments while entering the parameters.
2. Do simulations using data on separation option on mix #5 (salbutamol and impurities).
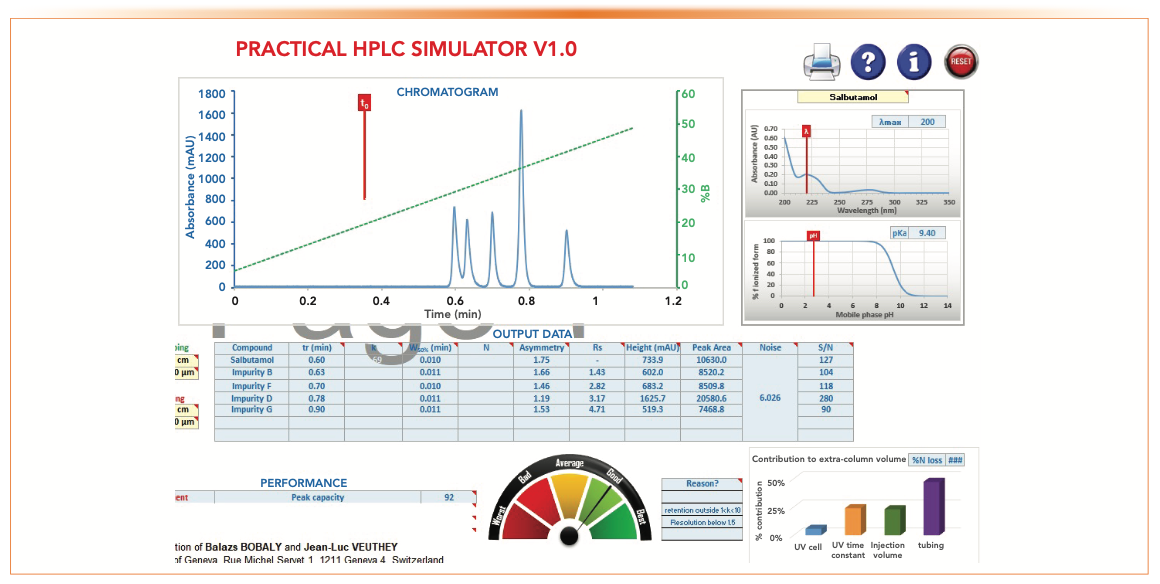
3. The resulting simulated chromatogram and method performance data are shown in Figure 3.
4. The user can continue to explore by altering parameters such as mobile phase A (MPA), mobile phase B (MPB), ultraviolet (UV) cell volume, monitoring wavelength, column parameters, such as length (L), inner diameter (i.d.), particle size (dp), bonded phase chemistry, injection volume (Vinj), sample diluent, tubing dimensions, gradient or operating conditions, and dwell volume (Vd).
5. The resulting chromatogram and method performance data can be observed, such as retention time, resolution, peak width, asymmetry, peak height, peak capacity (Pc), and signal-to-noise ratio (S/N).
6. Significant contributions to the extra-column volume are also calculated.
FIGURE 2: A screenshot of a set of example entries on the column, operating, and instrumental parameters, which is useful for the initial UHPLC method development for purity assessment of pharmaceuticals.
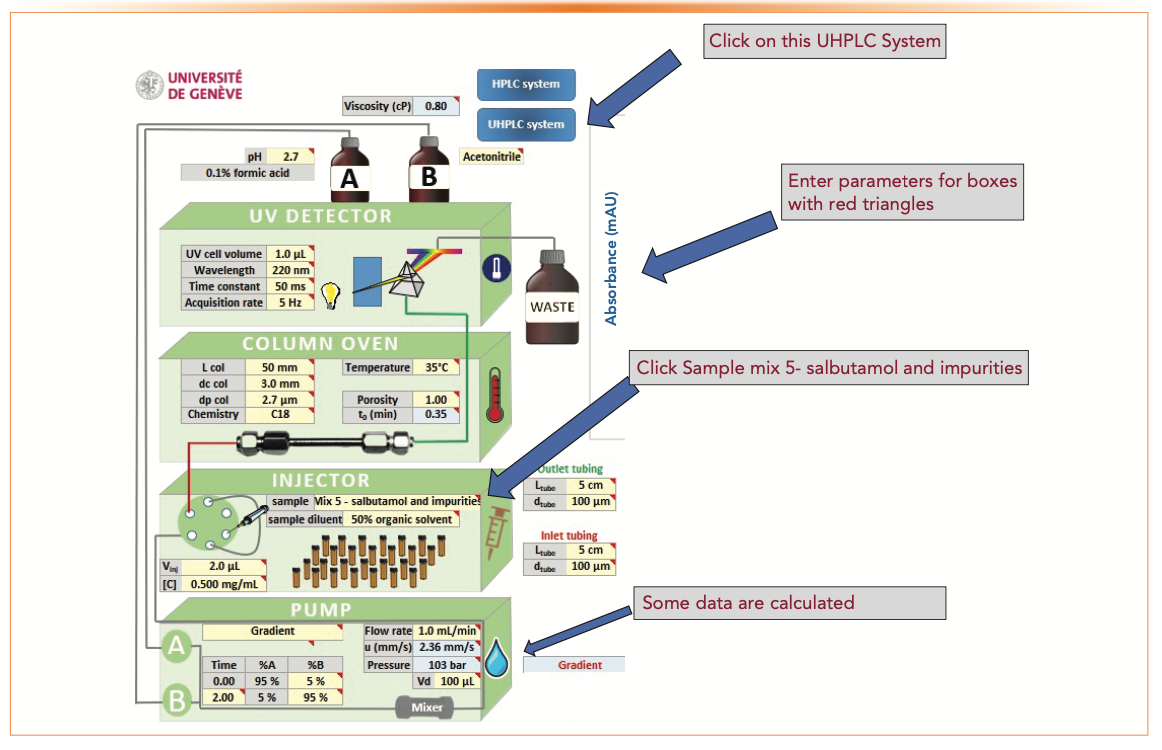
FIGURE 3: A screenshot of the simulated chromatogram for sample mix #5 with output data and method performance assessments.
Rationales for the Initial Column Choice
Figure 4 shows the initial choice of column dimension (L and i.d.), dp, and bonded phase. These parameters represent a rational starting point for initial method development used in a generic gradient method approach described elsewhere (9). The rationales for selection are as follows:
- C18 bonded phase is by far the most common stationary phase used in pharmaceutical analysis.
- The 50 mm x 3.0 mm column size represents an effective choice for initial method development capable of fast separations with reasonable resolution.
- The sub-3 μm particle (2.7 μm) is a compromise choice for quality control applications balancing efficiency performance and compatibility with HPLC and ultrahigh performance liquid chromatography (UHPLC) equipment.
FIGURE 4: Column parameters used for initial method development in the demo sequence.

The “Standard Parameters” and the Resultant Chromatographic Performance
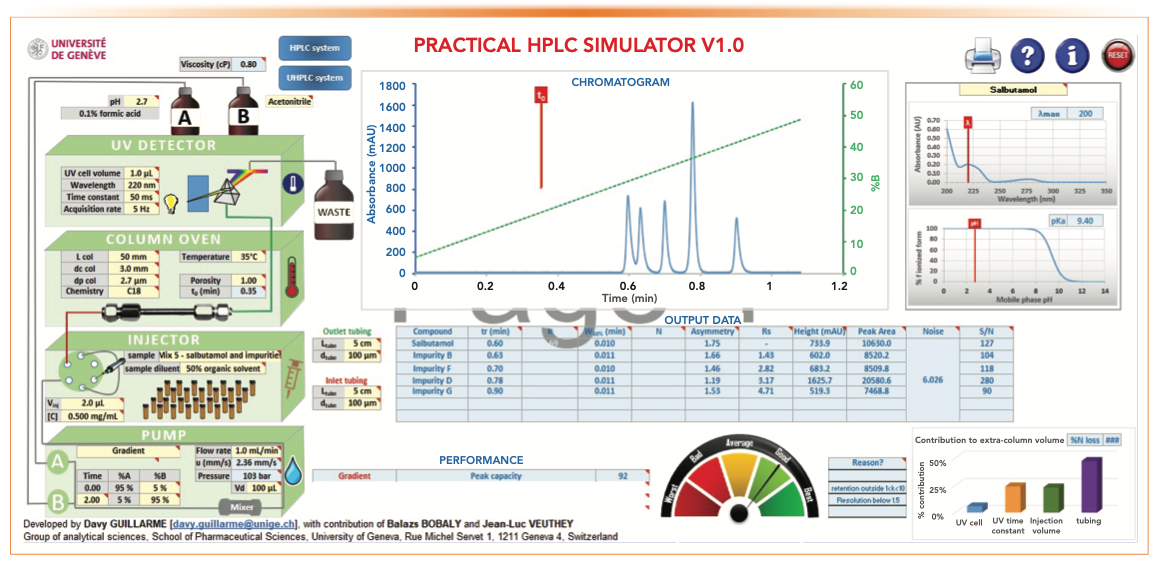
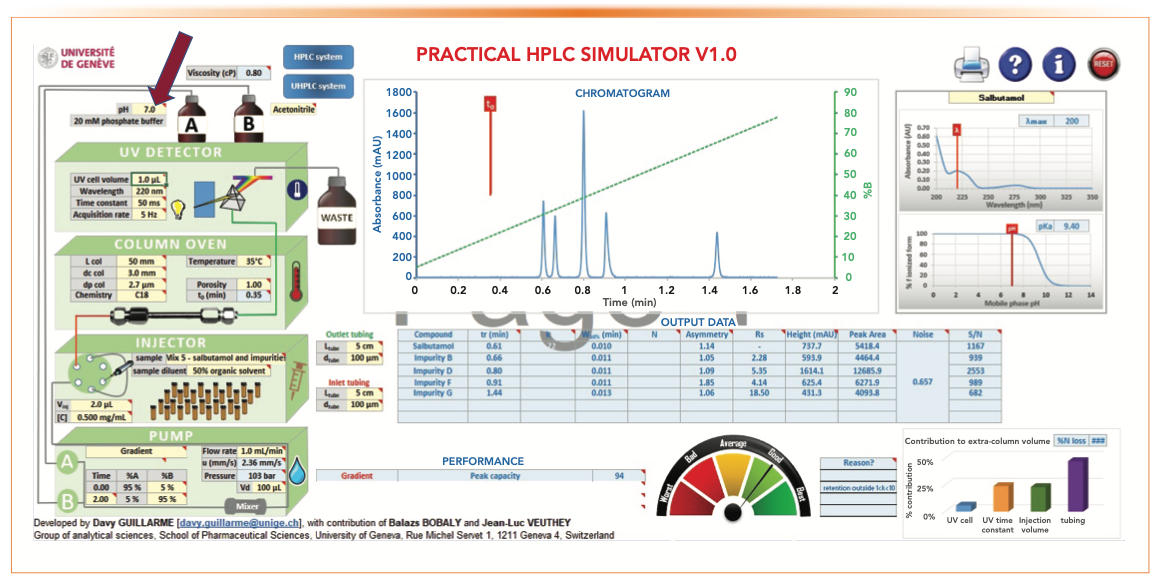
Figure 5 displays a screenshot of the standard parameters and the resulting chromatographic performance. These “standard parameters” constitute a convenient starting point of our simulation process.
The rationales for selecting these parameters are as follows:
- An acidic MPA is generally used to separate acids and bases with good peak shapes by controlling the ionization state of the analytes. A low pH of 2.7 using 0.1% formic acid is a common MPA in pharmaceutical analysis (10).
- A UV cell volume (1 μL) is needed for a short UHPLC column to minimize extra-column band broadening (2).
- A time constant of 50 ms and a fast acquisition rate of 5 Hz are reasonable parameters for fast separations, affording enough data point collection without increasing too much the size of the instrumental files.
- The selection of column parameters, such as dimension (50 mm x 3.0 mm) and dp (2.7 μm), is based on the intended application described earlier. A column temperature of 35 °C is a “default” for column ovens without Peltier cooling.
- Sample mix #5 (salbutamol, a very common receptor active in bronchodilators against asthma and its four impurities) is selected as a relevant case study in pharmaceutical analysis.
- An injection volume of 2.0 μL at a sample concentration of 0.5 mg/mL is found to yield sufficient method sensitivity (limit of quantitation to 0.05%) for this pharmaceutical assay.
- Gradient parameters, such as the gradient range and the gradient time or the time for the gradient segment (tG), are important considerations for separation resolution and Pc. Note that sample analysis time is dependent on tG plus the column equilibration time. A broad gradient of 5–95% acetonitrile at a tG of 2 min is a common parameter set used in high-throughput screening applications (2).
- Flow rate (F) is an important parameter to optimize analysis time and overall peak resolution. An optimum flow rate based on dp and column i.d. should be selected. A higher F is preferred in gradient separations for faster analysis time. The optimum F for the selected column is ~1 mL/min (2).
- A short length of small i.d. connecting tubing is preferred for UHPLC. A 50-mm, 100 μm i.d. connection tubing is optimum for UHPLC without excessive pressure drop.
Figure 5 also shows output data, including retention time, peak asymmetry, peak heights and peak area, and S/N ratio, as well as additional information on Pc and the contribution to extra-column volume.
FIGURE 5: A screenshot of the standard parameters and the resultant chromatographic performance.
The Simulation Sequence Used for Demonstrating the Effect of Operating Parameters on Method Performance
After establishing the “standard conditions” and examining the resulting chromatogram for the impurity analysis in mix #5, let’s examine a sequence of simulation results from changing vital parameters, such as tG, gradient range, UV cell volume, outlet connection tubing i.d., detection time constant, and MPA pH. After each alteration, we can observe the method performance parameters, such as Rs, analysis time, Pc, and sensitivity, as shown in Figures 6–11.
Figure 6 shows the effect of extending tG from 2 min to 10 min to increase Pc and Rs. tG controls the total analysis time, which includes any purging step and column equilibration time (2 min in the following discussion). As shown in the comparison below, the increase in Pc and Rs is dramatic but at the expense of a longer analysis time of 12 min (even though all peaks elute before 2 min). Note that the total time is the gradient time plus column equilibration time which is about 2 min.
FIGURE 6: The effect of a longer tG of 10 min for increasing Rs and Pc.
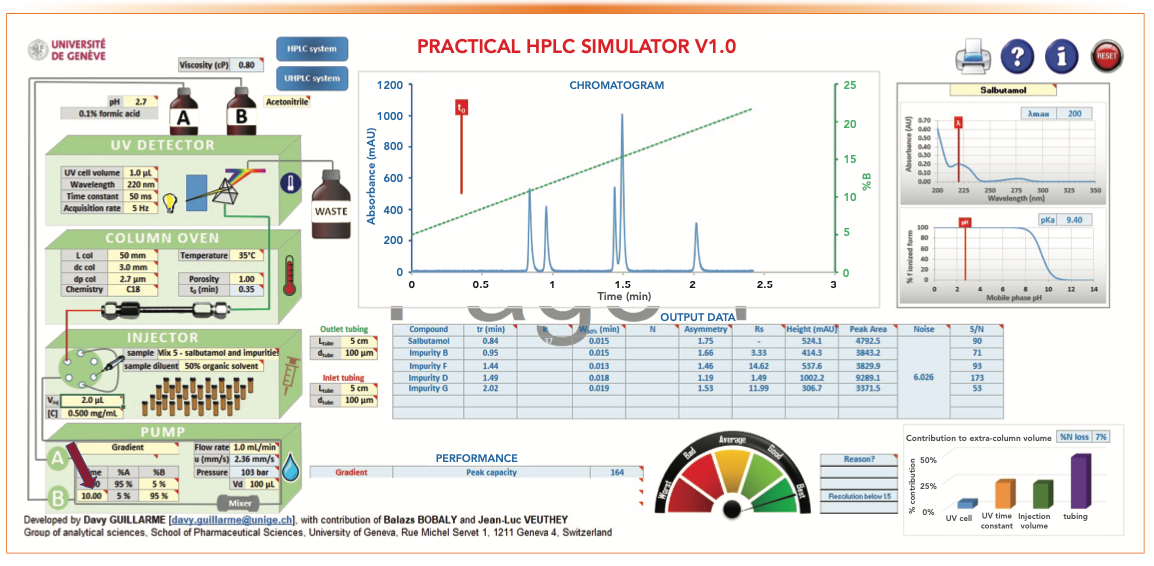
- Figure 5: tG = 2 min, analysis time = 4 min, Pc = 92, RS 1-2 = 1.43
- Figure 6: tG = 10 min, analysis time = 12 min, Pc = 164, RS 1-2 = 3.33
Figure 7 shows the effect of a narrower gradient range to increase Rs without impacting analysis time.
One way to increase Rs without impacting analysis time is to choose a narrower gradient range of 5–30% B compared to the broad range of 5–95% B while maintaining a tG of 2 min. A narrower range would increase the Rs of a specific range of solute hydrophobicity and is often used to increase resolution around the active pharmaceutical ingredient (API) peak in purity assays of pharmaceuticals (11).
- Figure 5: Range = 5–95% B, tG = 2 min, analysis time = 4 min, Pc = 92, RS 1-2 = 1.43.
- Figure 7: Range = 5–30% B, tG = 2 min, analysis time = 4 min, Pc = 63, RS 1-2 = 2.97.
Figure 8 shows the effect of replacing a small UV flow cell (1.0 μL) with a larger flow cell (10 μL). This simulation illustrates the effect of extra-column broadening from using an HPLC-type UV flow cell with UHPLC-type columns. Note the substantial reduction of Pc and the Rs of the first two peaks.
FIGURE 8: The effect of using a larger HPLC-type UV flow cell of 10 μL on Pc and Rs.
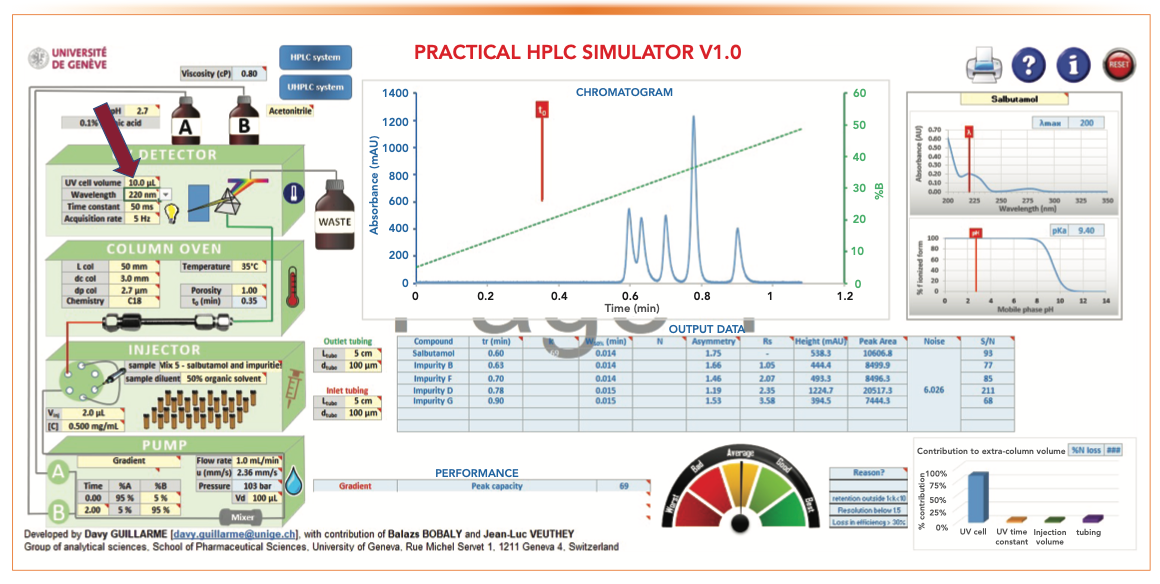
- Figure 5: tG = 2 min, analysis time = 4 min, Pc = 92, RS 1-2 = 1.43
- Figure 8: tG = 2 min, analysis time = 4 min, Pc = 69, RS 1-2 = 1.05
Figure 9 shows the effect of using a larger i.d. outlet tubing (250 μm vs. 100 μm) on Pc and Rs. Similar to the band broadening effect of using a bigger UV flow cell, a large i.d. outlet connection tubing can be deleterious to Pc and Rs, as shown in Figure 9. A longer connection tubing can have a similar broadening effect. In contrast, larger inlet tubing is more tolerable in gradient analysis because of the “band focusing effects” in reversed-phase LC (2).
FIGURE 9: The effect of using a larger i.d. outlet connection tubing (250 μm) on Pc and Rs.
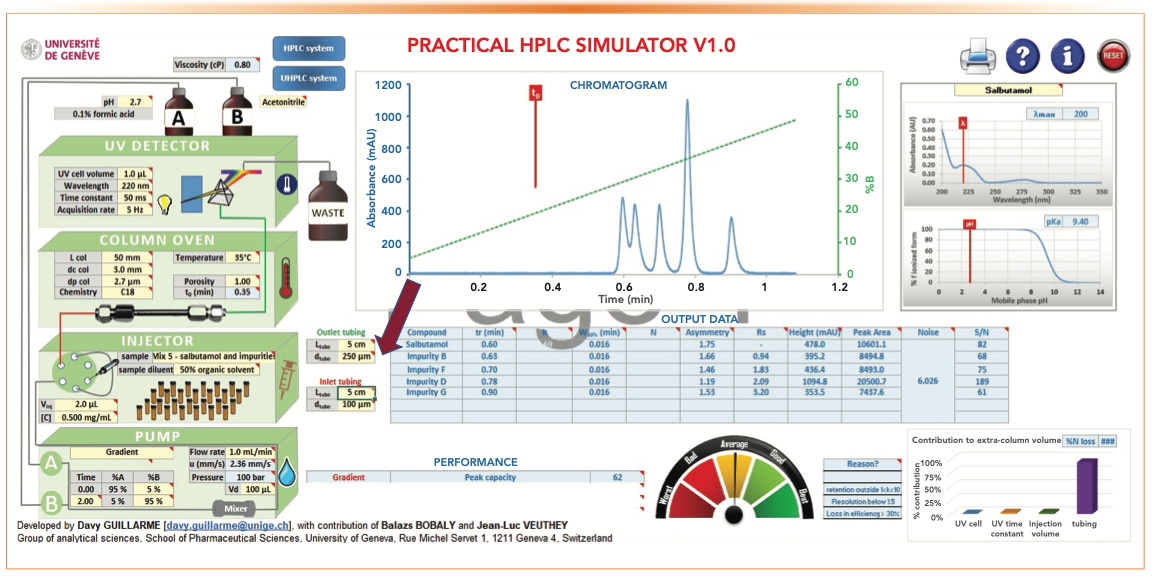
- Figure 5: tG = 2 min, analysis time = 4 min, Pc = 92, RS 1-2 = 1.43
- Figure 9: tG = 2 min, analysis time = 4 min, Pc = 62, RS 1-2 = 0.94
Figure 10 shows the effect of a slower detector time constant (500 ms) to Pc and Rs for fast eluting peaks, which can be substantial.
FIGURE 10: The effect of a slower detector time constant of 500 ms on Rs and Pc on fast eluting peaks.
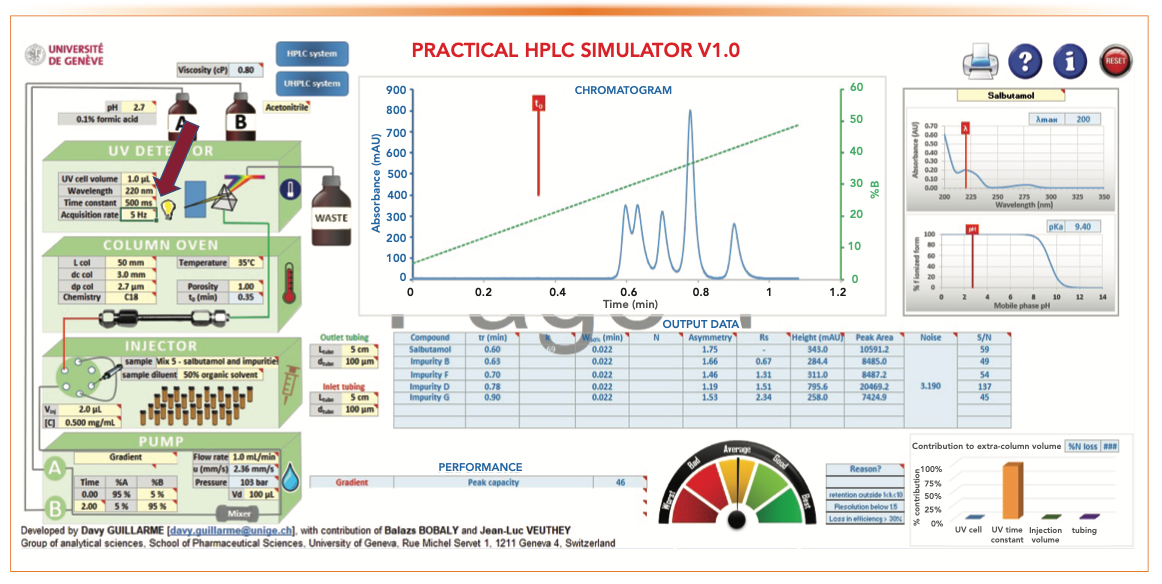
- Figure 5: tG = 2 min, analysis time = 4 min, Pc = 92, RS 1-2 = 1.43
- Figure 11: analysis time = 4 min, tR 5 = 0.9 min, Pc = 93, RS 1-2 = 2.28, S/N5 = 682
Figure 11 shows the effect of MPA pH at 7.0 on retention time and sensitivity at 220 nm. Replacing MPA of 0.1% formic acid at pH 2.5 with phosphate buffer at pH 7.0 increases both retention time and Rs since the basic analytes are less ionized (therefore less polar and more hydrophobic). Another advantage is a seven-fold increase of sensitivity at 220 nm (S/N of 682 vs. 90) because of the higher UV transparency of the phosphate buffer (lower UV cut-off). However, there is a loss of MS compatibility when using phosphate buffer.
- Figure 5: tG = 2 min, analysis time = 4 min, Pc = 92, RS 1-2 = 1.43
- Figure 11: tG = 2 min, analysis time = 4 min, Pc = 46, RS 1-2 = 0.67
FIGURE 11: The effect of using an MPA pH of 7.0 using 20 mM phosphate buffer at 220 nm on retention time and sensitivity.
Summary and Conclusions
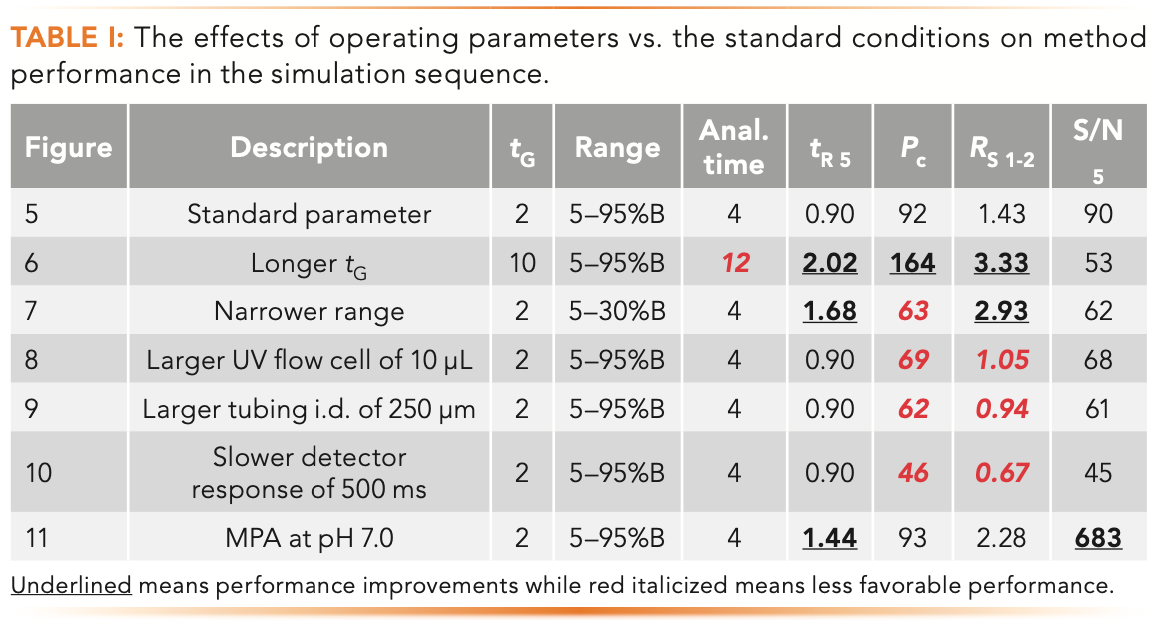
Table I summarizes the effects on method performance from the various parameter change.
In this article, we demonstrated the use of a practical LC Simulator as a learning and teaching tool. We provided the rationales for adopting this common UHPLC column, operating, and instrument parameters as the “standard” conditions. We demonstrated how these operating parameters may affect the separation in a case study on impurity testing by observing the resulting chromatograms and method performance. The simulation case study sequence examines the effect of tG, narrow gradient range, detector cell volume, the diameter of outlet tubing, detector time constant, and mobile phase pH and transparency.
Acknowledgments
The author thanks several colleagues for their timely help in reviewing this article for accuracy and clarity. Jack Pender of East Carolina University, Jingcun Wu of PerkinElmer, Marc Foster of Ecelchem Environmental Labs, Giacomo Chiti of Manetti & Roberts, and Stanislav Bashkyrtsev of Elsci Systems.
A special thanks to Davy Guillarme of the University of Geneva for writing the foreword and review of the final manuscript.
References
(1) L.R. Snyder, J.J. Kirkland, and J. Dolan, Introduction to Modern Liquid Chromatography, 3rd Edition (John Wiley & Sons, New York, New York, 2010), Chapter 2.
(2) M.W. Dong, HPLC and UHPLC for Practicing Scientists, 2nd Ed. (Wiley, New York, New York, 2019), Chapters 1, 2, 6, 7, and 9.
(3) L.R. Snyder, J.J. Kirkland, and J.L. Glajch, Practical HPLC Method Development, 2nd Ed. (Wiley, New York, New York, 1997).
(4) L.R. Snyder and J.W. Dolan, High-Performance Gradient Elution: The Practical Application of the Linear-Solvent-Strength Model (Wiley, Hoboken, New Jersey, 2006).
(5) Y.V. Kazakevich and R. LoBrutto (Eds.), HPLC for Pharmaceutical Scientists (Wiley, Hoboken, New Jersey, 2007), Chapters 1, 4, and 8.
(6) HPLC short courses sponsored by national meetings: Pittsburgh Conferences, HPLC Conferences, American Chemical Society National Meetings, and Eastern Analytical Symposium.
(7) Separation Science, https://www.sepscience.com/liquid-chromatography/
(8) CHROMacademy, https://www.chromacademy.com/
(9) M.W. Dong, LCGC N. Am. 34(6), 408–419 (2016).
(10) M.W. Dong and B.E. Boyes, LCGC N. Am. 36(10), 752–767 (2018).
(11) M.W. Dong, K. Huynh-Ba, and J.T. Ayers, LCGC N. Am. 38(8), 440–455 (2020).
ABOUT THE AUTHOR
Michael W. Dong is a principal of MWD Consulting, which provides training and consulting services in HPLC and UHPLC, method improvement, pharmaceutical analysis, and drug quality. He was formerly a Senior Scientist at Genentech, a Research Fellow at Purdue Pharma, and a Senior Staff Scientist at Applied Biosystems/PerkinElmer. He holds a PhD in Analytical Chemistry from City University of New York. He has more than 130 publications and a best-selling book in chromatography. He is an editorial advisory board member of LCGC North America and the Chinese American Chromatography Association. Direct correspondence to: LCGCedit@mmhgroup.com.

New Study Reviews Chromatography Methods for Flavonoid Analysis
April 21st 2025Flavonoids are widely used metabolites that carry out various functions in different industries, such as food and cosmetics. Detecting, separating, and quantifying them in fruit species can be a complicated process.
Extracting Estrogenic Hormones Using Rotating Disk and Modified Clays
April 14th 2025University of Caldas and University of Chile researchers extracted estrogenic hormones from wastewater samples using rotating disk sorption extraction. After extraction, the concentrated analytes were measured using liquid chromatography coupled with photodiode array detection (HPLC-PDA).

.png&w=3840&q=75)

.png&w=3840&q=75)


.png&w=3840&q=75)


.png&w=3840&q=75)


