Results Correlation with External Influences
LCGC North America
When data change over time, you may be able to tease out the causes by conducting a time-series analysis or by looking at various forms of correlation.
In the previous installment, we presented a case of periodically fluctuating data that did not lend itself well to trend analysis with conventional statistical methods. The data did appear to have a strong regular fluctuation, but its relationship to other observations was not clear. This installment addresses methods for teasing out external influences on trending data.
Chromatographers, and many others, sometimes encounter questions of whether a series of data over a period of time changes in ways that are significant for the observed process, or whether the changes have been influenced by other factors external to the process. Some possible factors include environmental temperature and pressure, power line voltage and frequency, gas purity, gas pressure and flow control, and instrument health. The first defense against unwanted experimental influences is proper setup, operation, and maintenance of, for our purposes, all of the equipment associated with gas chromatography (GC) analysis. When something does go wrong-and its a good idea to assume problems will inevitably occur-it’s time for logical troubleshooting. Sometimes close examination of suspect data will reveal a lot about what’s going on, and may help avoid unnecessary diagnostics, parts replacement, and time lost.
A Time-Series Analysis
Time-series analysis refers to a number of mathematical and statistical methods of examining data that has a regular, time-based aspect. A set of peak retention times, areas, and related variables that were measured at regular intervals comprises a time series. The four-day data set that was presented in the previous installment of “GC Connections” (1) is also such a series. Figure 1 presents those data, along with additional measurements that extend the time span forwards and backwards. The time span is extended from four days to a week, with measurements occurring every 2 h.
Figure 1: Gas concentrations and ambient temperatures measured every 2 h over a one week interval: (a) Ambient temperatures; (b) ethane concentrations. The dashed blue line shows how the concentration data appear to trend. The red squares and blue circles are the first and second sets of data that were discussed in the previous installation. The triangles are additional data points added to extend the time series and increase its statistical significance.

A quick visual examination of the concentrations, following the blue dashed line, reveals daily fluctuations that increase in magnitude through April 1. The ambient temperatures in the upper plot of Figure 1 clearly exhibit expected regular daily changes. The peaks and troughs in the concentration levels also appear to correlate with the temperature data, but a closer look begins to uncover some inconsistencies.
First, while the daily ambient temperature and concentration fluctuations seem well related, there is a long-term upward trend in the concentrations not reflected by the ambient temperature. And second, the timing of the daily high and low fluctuations does not match well. For example, the temperature lows early on March 29, 30, 31, and April 1 lead the highs in concentration by 2–4 h. The concentration lows lag behind the temperature maxima by a longer time period. Perhaps, then, the relationships between the two variables are not so straightforward.
Some common statistical analysis techniques for time series can yield more-precise information about the relationships or lack thereof between the temperature and measured concentrations. The simplest one, a moving average, is represented in Figure 1 by the dashed blue line. The number of points in the average span was chosen so that the line would follow the data points fairly closely while removing much of the point-to-point noise. As already mentioned, this construction did not provide a clear answer for the concentration–temperature relationship and instead we have to ask additional questions about it.
In the sections that follow, the math behind the graphs is not elucidated, for reasons of space as well as for mercy on the typesetter. For the interested reader, please see the large volume of information available on these topics in general in any number of statistical works both in print and online. The graphs and some additional information shown here were generated using The Comprehensive R Archive Network (CRAN R) (2).
Correlation
Correlation refers to a number of mathematical techniques that can provide insight about relationships between two or more variables. Let’s take a look at some mathematical and graphic methods for this discussion.
One of the simplest ways to spot a strong relationship between two variables is to plot one as a function of the other, by placing one variable on the x-axis and another on the y-axis. Figure 2 is such a plot for the ambient temperature and the measured concentration. I see this technique applied often: it is very easy to make such a graph using common spreadsheet programs. Here, however, we have a bit of a problem. The data points are well scattered across the total range of values. There is the appearance of an inverse relationship, as might be expected from the high–low nature of the data as seen in Figure 1. There are fewer low concentrations at the lower temperatures, but most of the values cluster around the center of the region. The standard correlation coefficient for two data sets, known as the Pearson correlation coefficient, calculates to -0.24, which reflects the situation seen in Figure 2. The negative correlation coefficient means that there is some inverse correlation, but its magnitude is small. The correlation is not particularly strong.
Figure 2: Plot of the data in Figure 1 with the ambient temperature on the x-axis and the measured concentration on the y-axis. Number of points = 83.
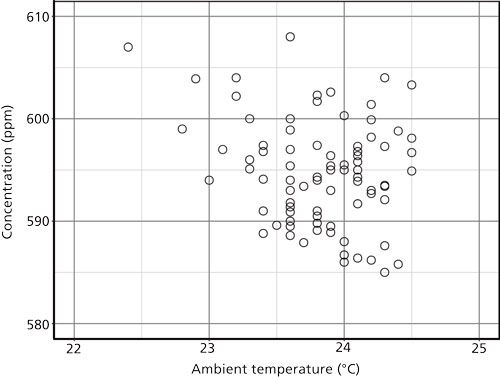
An assumption behind these graphical and mathematical correlations is that the data are related in a linear and directed manner. The problem here is that while the data tend to go consistently in opposite directions, the values are not strongly related linearly. We cannot choose a particular value for the temperature and predict the concentration with much success.
Autocorrelation
Autocorrelation relates the values that a variable takes at any location over a time period or other regular interval to previous and future values of the same variable. It is a useful technique for characterizing periodicity in data and so could be well suited to a better understanding of the current test data.
Figure 3 illustrates two types of autocorrelation for the temperature data. The first, Figure 3a, is the standard autocorrelation, in which the magnitude of each bar represents how well data values are predicted or are related to others with the indicated time lag or spacing away. For a lag of 0, the data are perfectly represented by themselves and so the autocorrelation is 1.0. As the lag increases, the autocorrelation decreases to near-zero at 6 h and then down to about -0.5 at 12 h. It continues this way as the lag increases and ultimately presents a damped sine wave with a period of 24 h. This then is the main periodicity of the ambient temperature cycle, which is not at all surprising.
Figure 3: Autocorrelation of the ambient temperature time series: (a) The autocorrelation factor for each time lag from 0 to 38 h; (b) the partial autocorrelation of the same data.
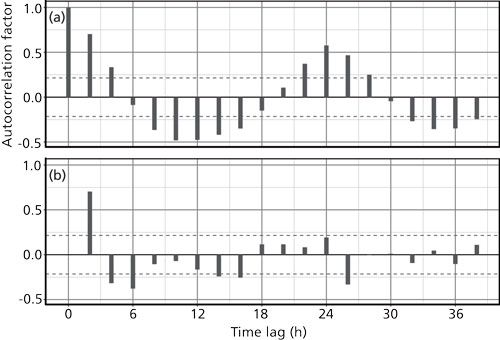
Figure 3b shows a so-called partial autocorrelation of the same data. This plot represents the residual autocorrelation coefficients after removal of the prime correlation at a time lag of zero. The dashed lines in Figures 3a and 3b represent the 95% confidence limits for significance of the correlations. Values that lie between the confidence limits are close to the estimated noise level of the data and can be treated as insignificant. Figure 3b conveys additional periodicities in the data of 2, 4, 6, and 26 h.
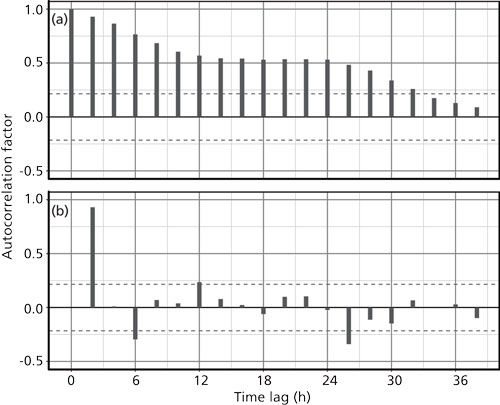
The concentration data, despite its appearance of periodicity, present a different picture in its autocorrelations. Figure 4 gives the autocorrelation and partial autocorrelation of the concentration data. In this case, autocorrelation shows no real sine-wave format and instead decreases steadily from zero to 12 h of time lag, remains constant out to 24 h, and then drops off at larger lags. This appearance is characteristic of a longer-term upward trend in the data, which is supported by its appearance in Figure 1b. The partial autocorrelation of the concentration data in Figure 4b does show a strong periodicity at 2 h, and some additional activity at 6, 12, and 26 h. Interestingly, these values correspond with the partial autocorrelation of the temperature data in Figure 3b. Overall, however, these correlations are small and cannot be given much significance.
Figure 4: Autocorrelation of the concentration time series: (a) The autocorrelation factor for each time lag from 0 to 38 h; (b) the partial autocorrelation of the same data.
Cross-Correlation
Finally, let’s take a look at how well the temperature and concentration data correlate with each other when considered as a paired time series. Each temperature measurement has a corresponding concentration measurement at the same time. Figure 5 shows the result. Here the lag spans both positive and negative (leading) intervals. The temperature is the first variable and concentration is the second. Significant correlations are present where the temperature leads the concentration by about 4 h-that is, where the lag = -4. There also is a small correlation significance at a lag of about 8 h. Or, if we imagine sliding the lag forward by +4 h, then the strongest correlation between the temperature and concentration would sit at zero lag. The sinusoidal nature of the temperature makes a clear pattern as well.
Figure 5: Cross-correlation of the temperature and concentration data. The x-axis shows the time that the temperature cycles lag behind the concentration cycles.
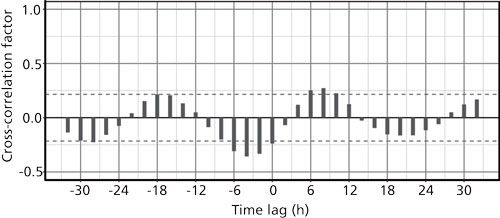
If this meta-analysis found a direct correlation between external temperatures, or other factors, and the instrument’s performance, there would be some good indications of where to look first in a troubleshooting exercise. In this case, it makes sense to look instead at causes of variability in the process under measurement.
Conclusion
In this second look at process GC data where instrument results might depend on external influences, it appears that this is not the case, or at least there is not a strong correlation between the two either as linear variables or as time series. Some minor periodic relationships were uncovered, but these are not necessarily directly causal via thermal influences on the chromatographic equipment. A strong possibility is the influence of ambient conditions on the monitored process itself. This supposition is supported by the time lag that was found between the temperature and the measured concentrations.
References
- J. Hinshaw, LCGC North Am. 35(7), 440–443 (2017).
- The Comprehensive R Archive Network (CRAN R Project), https://cran.r-project.org/, v. R-3.4.1, July, 2017.
John V. Hinshaw

“GC Connections” editor John V. Hinshaw is a Senior Scientist at Serveron Corporation in Beaverton, Oregon, and a member of LCGC’s editorial advisory board. Direct correspondence about this column to the author via e-mail: LCGCedit@ubm.com

Study Examines Impact of Zwitterionic Liquid Structures on Volatile Carboxylic Acid Separation in GC
March 28th 2025Iowa State University researchers evaluated imidazolium-based ZILs with sulfonate and triflimide anions to understand the influence of ZILs’ chemical structures on polar analyte separation.


