Recent Advances in Two-Dimensional Liquid Chromatography for Pharmaceutical and Biopharmaceutical Analysis
LCGC North America
This is an exciting time for 2D-LC, as the expanding community of users works to develop creative solutions involving 2D-LC to solve analytical challenges that are very difficult or impossible to solve by conventional means.
Recent advances in commercially available instrumentation for two-dimensional liquid chromatography (2D-LC) have increased the rate of adoption of 2D-LC methodologies for a wide range of applications in the pharmaceutical and biopharmaceutical industries. In this article, we briefly highlight some of the recently introduced technologies that are relevant to separation challenges encountered in these industries. Then, we discuss 2D-LC methods that have been developed recently to address a diverse array of analytical challenges. This is an exciting time for 2D-LC, as the expanding community of users works to develop creative solutions involving 2D-LC to solve analytical challenges that are very difficult or impossible to solve by conventional means.
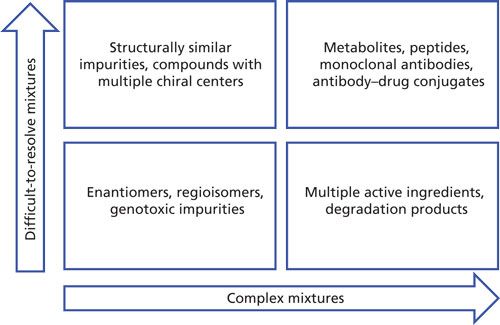
Innovations in chemical synthesis and pharmaceutical manufacturing continue to push the limits of modern liquid chromatography. Increasingly complex synthetic routes and biopharmaceutical processes demand improvements in speed, selectivity, and resolving power of chromatographic separations. These manufacturing processes routinely generate samples of varying complexity that can be divided into two separate groups that are challenging in different ways (Figure 1). Difficult-to-resolve samples may include regioisomers, stereoisomers, degradation products, and dehalogenated or structurally similar impurities of the compound of interest. Complex mixtures are samples in which, in addition to the chemical or biological complexity of the sample, the number of unique molecular entities in the sample approaches the hundreds or even thousands. Over the last several years, multidimensional separations have shown great promise as tools to address both difficult-to-resolve samples and complex mixtures (1–3).
Figure 1: Types of samples in pharmaceutical and biopharmaceutical analysis that are challenging to separate using conventional 1D HPLC.
Two-dimensional liquid chromatography (2D-LC) was first introduced in pharmaceutical laboratories by scientists looking to improve selectivity and peak capacity in the analysis of difficult-to-resolve samples and complex mixtures. Early instruments were “home-built” and typically consisted of two or more conventional high performance LC (HPLC) instruments connected through multiport valves, with instrument control performed through multiple instances of vendor or custom software interfaces. Home-built instruments inherently relied on knowledge of the connecting tubing volumes and one-dimensional (1D) separation method to enable time-resolved transfer of individual peaks to the second dimension. The introduction of commercial 2D-LC instruments has provided an integrated and more robust approach to performing 2D-LC in a regulated environment. The ability to easily switch between selective and comprehensive 2D-LC combined with software that enables enhanced instrument control and visualization of the multidimensional data has renewed interest in 2D-LC in pharmaceutical and biopharmaceutical laboratories.
Recent applications of 2D-LC for pharmaceutical (small-molecule) analysis have been largely focused on single-peak heart cutting (LC–LC) (1). Small-molecule separations typically do not suffer from peak capacity limitations of the method; rather, the structural similarity of key impurities, regioisomers, or degradation products requires subtle changes in selectivity to resolve a critical pair, without compromising the resolution of the other components in the mixture. Combining reversed-phase columns with orthogonal selectivities in LC–LC is an effective approach for separating structurally similar impurities. Some of the earliest small-molecule LC–LC applications involved achiral–chiral analysis, enabling concurrent determination of impurities and enantiomeric excess in a single analysis (4,5). Recently, the state of the art for achiral-chiral separations was dramatically improved by the development of new column technologies for ultrafast chiral separations (6). For biopharmaceutical (large-molecule) applications, 2D-LC has tremendous potential to address the complex mixtures often encountered. Biopharmaceutical samples routinely have hundreds or even thousands of chemically distinct analytes that overwhelm the peak capacity of any 1D separation. Applications of 2D-LC for concurrent analysis of biopharmaceuticals using combinations of reversed-phase LC, size-exclusion chromatography (SEC), ion-exchange chromatography, and capture–elution chromatography (such as with protein A) have been demonstrated for both targeted and comprehensive 2D-LC separations (7,8).
In this mini-review, we highlight recent advances in instrumentation, column technology, and applications of 2D-LC for pharmaceutical and biopharmaceutical analysis. This article is not intended to be an exhaustive review of the literature; readers interested in digging deeper into this topic will find citations of helpful reviews and original research papers cited in the article.
Recent Developments in Column Technologies Useful for 2D-LC
Column technology for 2D-LC has benefited significantly from column technologies introduced for ultrahigh-pressure LC (UHPLC). Short, narrow-bore columns for reversed-phase LC packed with sub-2-µm or superficially porous particles, or both, have been instrumental in developing fast separations in 2D-LC. Since the introduction of commercial 2D-LC, applications requiring orthogonal selectivity in the second dimension were often limited to single peak transfer using simple heart-cutting LC–LC. Until recently, comprehensive 2D-LC (LCxLC) applications where an orthogonal selectivity was required (such as combining chiral and SEC steps) suffered from a lack of new column technologies. Barhate and Welch and coworkers (9) recently demonstrated ultrafast chiral LC separations for 2D-LC using sub-2-µm fully porous and 2.7-µm superficially porous particles. Their work demonstrated achiral x chiral, chiral x achiral, and chiral x chiral 2D-LC separations of difficult-to-resolve and complex pharmaceutical mixtures in multiple heart-cutting (mLC–LC), selective comprehensive (sLCxLC) and fully comprehensive (LCxLC) modes. The ability to perform ultrafast chiral separations in the second dimension is a significant innovation enabling comprehensive 2D-LC separations of pharmaceuticals.
Although innovation in column technology for reversed-phase LC and chiral applications has improved over the last decade, until recently, columns designed to improve speed and performance of biopharmaceutical analysis was limited. Recently, Williams and Brorson and coworkers (7) developed a 2D-LC method using 3-µm SEC columns in the second dimension (2D) that yielded 2D analysis times of <10 min. More recently, new column technologies for biopharmaceuticals with sub-2-µm particles and superficially porous particles for SEC (10,11) and 1000 Å pore sizes for reversed-phase LC (12) were introduced that have the potential to significantly improve speed and performance in biopharmaceutical analysis. We are only aware of research using these columns for 1D-LC at this time, but they have the potential to improve the speed and performance of 2D-LC separations of complex biopharmaceutical samples as well.
Recent Developments in Instrument Technologies for 2D-LC
One of the most significant advances in instrumentation for 2D-LC in recent years has been the development of hybrid modes of 2D separation that combine features of the traditional heart-cutting and comprehensive modes of separation. Thorough discussions of how all these modes of 2D separation relate to each other, and to 1D separations, can be found elsewhere (2,13). Here, we focus on the hybrid modes of multiple heart-cutting (mLC–LC) and selective comprehensive (sLCxLC) separations, which were introduced by Zhang and Chewtyn and coworkers (14), and Groskreutz and Stoll and coworkers (15,16), respectively. Figure 2 provides a graphical representation of the way each mode works in practice, and how the two modes compare to each other. The mLC–LC concept is an extension of the simple single heart-cut concept, in that-in principle-it allows the user to collect fractions of an unlimited number of regions of interest in the 1D separation, and reinject them into the 2D column for further separation. In this mode, it is of great practical value to be able to temporarily store the collected 1D fractions until the second dimension is “available,” at which time the next fraction can be injected. This storage of the fractions can be accomplished either in open capillaries (sample loops) (17), or in cartridges packed with solid-phase adsorbent (18). There have been several published reports of the use of the mLC–LC concept in the context of pharmaceutical analysis in the past few years (14,19-22). One of them-coupling mass spectrometry (MS)-unfriendly HPLC methods to MS through a desalting second dimension-is discussed below in some detail (19).
Figure 2: (a) Multiple heart-cutting (mLC–LC) and (b) selective comprehensive (sLCxLC) concepts for 2D-LC separation. In the mLC–LC concept, single fractions are collected from multiple regions of interest in the 1D separation and injected one at a time into the 2D column for further separation. In the sLCxLC concept, multiple fractions are collected from one or more regions of interest in the 1D separation. Subsequent 2D separation of the fractions and reformatting of the data can be used to produce high-resolution 2D chromatograms for selected regions of the 1D separation.
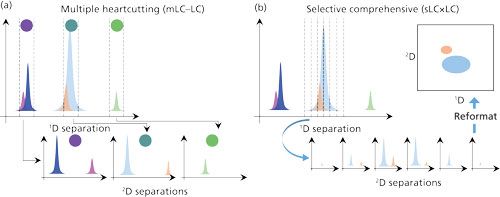
As they are discussed here, the principal difference between mLC–LC and sLCxLC lies in the number of fractions of a particular region of a 1D separation that are collected and reinjected into the second dimension. This difference manifests itself in two important ways. First, when a single fraction of a 1D peak is collected and transferred, the volume of this fraction can quickly become quite large, particularly if good precision of quantitation for this peak is desired in the second dimension (17,23). These large volumes can have significant negative impacts on the subsequent 2D separations (9,24). Switching to the sLCxLC mode allows the user to divide up the 1D peak volume into smaller, more manageable fraction volumes. Second, in the mLC–LC approach, any information about the relative retention of partially overlapped 1D peaks is completely lost upon transfer of a single fraction to the 2D column. On the other hand, if multiple fractions of 1D effluent are collected across a region containing partially overlapped peaks, the relative retention information for these peaks from the first dimension can be retained to produce a much higher resolution chromatogram for these compounds. These advantages of the sLCxLC are beginning to be exploited in a variety of application areas (9,25–27).
Characterization of Small-Molecule Pharmaceuticals
Demonstrating peak purity (specificity) is a requirement when validating chromatographic methods for small-molecule pharmaceuticals. Peak purity determination is typically performed using UV–vis, diode array, or MS detection. Selective comprehensive 2D-LC (sLCxLC) is an alternative to UV–vis, diode-array, or MS detection to ensure peak purity during method validation, because the entire active ingredient peak can be analyzed by an orthogonal method to demonstrate peak purity (25). Shackman and Kleintop (26) performed peak purity profiling of an active ingredient in a triple-active fixed-dose combination drug product using sLCxLC. This work highlights the feasibility of using 2D-LC as an alternative for peak purity analysis in complex sample mixtures.
The separation of known impurities and degradation products is also a requirement of stability-indicating methods for small-molecule pharmaceuticals. Recent work by Medley and Zhang (28) highlighted the application of 2D-LC in the analysis of antibody–drug conjugates (ADCs), where a combination of SEC and reversed-phase LC was used to quantitate antibody aggregation and free drug in ADCs, as well as to assess ADC stability and degradation pathways by analyzing small-molecule degradation products and aggregation of the ADC. Dai and Zhang and coworkers (29) also developed a stability-indicating 2D-LC assay investigating the degradation of a parenteral formulation. Analysis of an unknown degradant peak by LC–MS in one dimension was not feasible because of the high concentration of polyethylene glycol (PEG) in the sample matrix. Heart-cutting 2D-LC enabled the degradation product to be analyzed in the second dimension using a more MS-friendly mobile phase. It should be noted that while this 2D-LC application involves a single heart cut, it is a practical example where a single 2D-LC experiment can replace multiple 1D-LC experiments for identifying a degradant or unknown impurity.
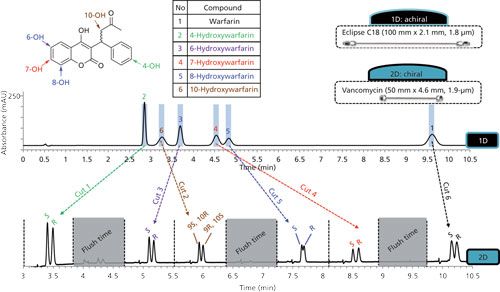
The use of chiral separations in one or both dimensions of 2D-LC separations of pharmaceuticals has now been demonstrated by several groups (4,5,9,18,30–32). Most recently, Barhate and Welch and coworkers (9) demonstrated the utility of very fast 2D chiral separations for separating difficult-to-resolve mixtures on practical timescales, including samples of molecules having multiple chiral centers. Figure 3 shows an example of such a separation from their work, in which pairs of stereoisomers of warfarin and several hydroxylated isomers are first separated using an achiral 1D column. In an mLC–LC approach, heart cuts of the six 1D peaks are transferred one at a time to a chiral 2D separation for resolution of the stereoisomers; the entire 2D-LC separation of the 12 isomers takes just 11 min.
Figure 3: Multiple heart-cutting 2D-LC separation of 12 warfarin and hydroxywarfarin stereoisomers. The mixture is first separated using an achiral C18 column, and then heart cuts of the six 1D peaks are transferred to a chiral 2D column for resolution of each stereoisomer pair. Adapted with permission from reference 9.
Coupling MS-Incompatible Separations to MS
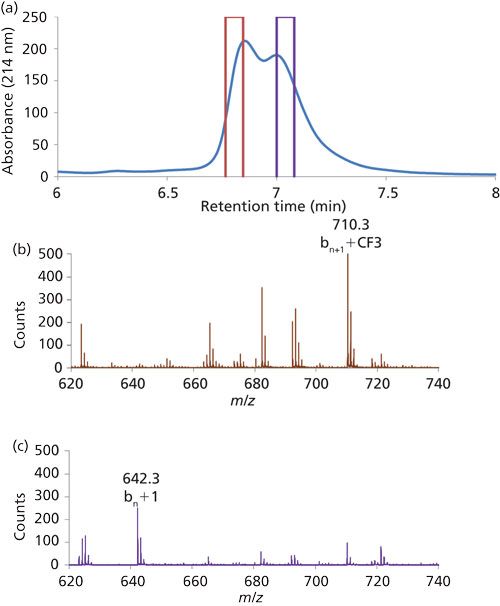
It is quite common in the use of HPLC to encounter a situation in which a new peak appears in a separation where all of the sample constituents were known previously, but the identity of the new peak is unknown. This situation is particularly problematic when the existing separation involves nonvolatile mobile-phase components to the extent that direct connection of the separation to MS to identify the new peak is not possible. This problem can be addressed by collecting fractions of 1D effluent containing the new peak of interest, desalting the fraction offline, and reinjecting the fraction into a column connected to a mass spectrometer and running with an MS-compatible eluent. While effective, this process can be tedious, time consuming, and prone to contamination. The idea of doing the collection, desalting, and detection process entirely online was demonstrated two decades ago by Kanazawa and Takahishi and coworkers (33). More recently, this kind of approach has attracted more interest as commercially available hardware and software platforms to support this work have become more sophisticated and more widely available. Such applications have been demonstrated for impurities in small-molecule active pharmaceutical ingredients (APIs) (14), and for peptides and small protein type analytes (19,21). Figure 4 shows an example of the data that can result from this approach. Figure 4a shows a portion of a 1D chromatogram from the work of Luo and coworkers (19), where it was believed that two positional isomers of a peptide were overlapping partially. In this case, a reversed-phase LC column was used in the first dimension with an eluent composed of 100 mM sodium perchlorate and 0.1% phosphoric acid. Two 80-μL fractions from the leading and trailing edges of the overlapped peaks were transferred to a 2D separation using a different reversed-phase LC column, but with an eluent containing 0.1% formic acid. The resulting mass spectra (Figures 4b and 4c) are clearly different, and enable rapid and unambiguous assignment of the identities of the peptide isomers.
Figure 4: Characterization of peptide isomers by MS using 2D-LC to desalt fractions of 1D effluent containing sodium perchlorate: (a) portion of the 1D chromatogram showing partial peak overlap for the isomers and the two zones that were heart cut for desalting by the 2D column; (b) mass spectrum of the major component of the heart cut made at 6.8 min; (c) mass spectrum of the major component of the heart cut made at 7.0 min. Reprinted with permission from reference 19.
Characterization of Protein Biopharmaceuticals
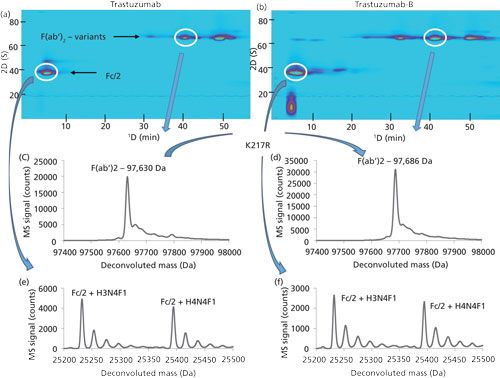
Thorough characterization of protein biopharmaceuticals is extremely challenging because of their large size, inherent heterogeneity (because they are produced from biological cells), and susceptibility to degradation (34). Currently, because there is no single method that yields all of the desired characterization data, various analytical tools including various types of pressure- and electro-driven separations, mass spectrometry, and spectroscopic methods are used to assemble complementary pieces of information into a complete understanding of each biomolecule. Of course, this work is incredibly time consuming and expensive, and there is tremendous interest in improving the efficiency and effectiveness of the characterization process. As in other areas, 2D-LC approaches have been used for some time for analysis of peptides and proteins (35,36). However, 2D-LC–MS is increasingly being applied to the characterization of biotherapeutic proteins, as the advantages of 2D separation become more clear. For the characterization of monoclonal antibodies (mAbs) in particular, 2D-LC–MS has been employed at the peptide level, subunit level, and at the intact antibody level (37). For example, Vanhoenacker and Sandra and coworkers (38) have demonstrated the potential for LCxLC–MS to quickly reveal subtle changes in amino acid oxidation upon subjection of the protein to oxidative stress. The higher peak capacity of 2D-LC compared to 1D-LC in this context facilitates discovery of new peaks and simplifies interpretation of MS data. Recently, in our own work we have demonstrated the utility of LCxLC–MS for comparing originator and biosimilar mAbs (8). Figure 5 shows an example of such a comparison, where cation-exchange and reversed-phase LC were used for the 1D and 2D separations, respectively, of mAb subunits produced by digestion with the IdeS enzyme. This combination of separation modes is very powerful for this application because it combines the exquisite selectivity of cation-exchange chromatography for charge variants of the protein subunits with the inherent compatibility of reversed-phase separations with direct MS detection. In this way we can learn, in a single analysis, about the abundance of different charge variants as well as their masses and thus the likely identity of each variant. In this particular case, the one amino acid difference between the sequences of the F(ab’)2 subunits of trastuzumab and a biosimilar candidate is easily detected in spite of the sequences’ similar retention times in both dimensions of the separation.
Figure 5: LCxLC–MS separations of (a) IdeS-digested trastuzumab and (b) biosimilar candidate trastuzumab-B, with cation-exchange and reversed-phase separations in the first and second dimensions, respectively. (c, d) A one amino acid difference in the F(ab’)2 subunits of these two proteins is easily detected even though they are eluted in the same region of the 2D chromatograms. (e, f) On the other hand, other parts of the molecules that are known to be very similar, such as the Fc/2 subunits, appear very similar by MS. Adapted with permission from reference 8.
Analysis of Biopharmaceutical Materials Containing Both Small and Large Molecules
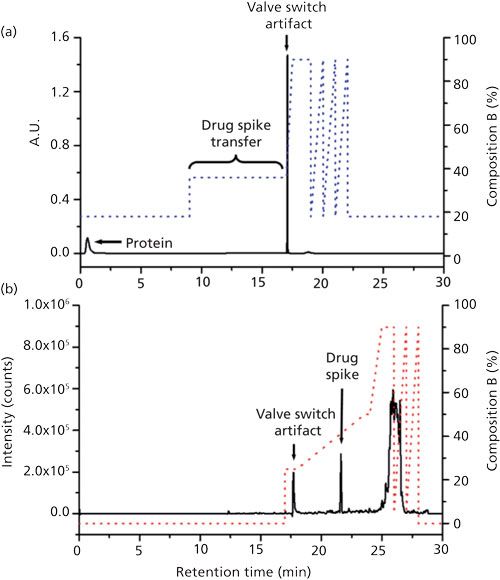
In addition to the challenges associated with therapeutic proteins themselves, decoration of these proteins with cytotoxic small-molecule drugs to produce potent ADCs, and the addition of surfactants to mAbs during drug product formulation, make characterization of these materials even more challenging (39). The ways 2D-LC has been used to address these challenges are too numerous to discuss in detail here; interested readers are referred to a recent comprehensive review of this area (37). For the analysis of therapeutic protein formulations, the 1D separation has been used as a kind of cleanup step, followed by 2D separation and detection focused on a particular class or type of molecule. For example, Li and Zhang and coworkers (40) demonstrated the use of ion-exchange or mixed-mode ion-exchange and reversed-phase 1D separations to separate polysorbate surfactants from protein in a monoclonal antibody formulation, followed by a 2D reversed-phase LC separation. The surfactant constituents were transferred to the second dimension in a single fraction, followed by a long gradient elution separation and MS detection. This approach enables comprehensive characterization of the surfactant that would otherwise be compromised under conditions where the protein is coeluted with surfactant in a 1D separation. Using a similar concept, but with completely different separation modes, Wang and Zhang and coworkers (41) used a 2D-LC method with size-exclusion and HILIC separations in the first and second dimensions to study the degradation of histidine in therapeutic protein formulation. Currently, one of the most intense areas of research involves the use of 2D-LC to understand the extent of and variation in conjugation of cytotoxic small molecules to mAbs through linkages to cysteine or lysine residues. For example, Sarrut and Heinisch and coworkers (42,43) have demonstrated the use of LCxLC–MS with hydrophobic interaction (HIC) and reversed-phase LC separations in the first and second dimensions to obtain a detailed picture of the conjugation pattern present in a particular ADC sample. In a different study, Sandra and Sandra and coworkers (20) used multiple heart-cutting 2D-LC with cation-exchange and reversed-phase LC separations, coupled with MS detection, to study the conjugation pattern of small-molecule drugs linked to lysine residues of the mAb trastuzumab. Finally, Birdsall and Beck and coworkers (44) have demonstrated the use of heart-cutting 2D-LC for sensitive detection of an unconjugated small-molecule drug in the presence of ADC protein. Figure 6 shows representative data from this work, where the protein-small molecule mixture is first separated using a mixed-mode column with the protein eluted early, well separated from the unconjugated drug. During the elution of the drug from this first column, the flow path is changed so that the 1D and 2D columns are connected in series and the small-molecule analytes are loaded onto the 2D reversed-phase LC column. Following this transfer step, the 2D flow path is isolated and a solvent gradient is used to elute the free drug from the 2D column for quantitation.
Figure 6: Example of heart-cut transfer of small-molecule constituents of a spiked trastuzumab sample for quantitation of the free drug in the 2D separation: (a) first-dimension and (b) second- dimension separations. Adapted from reference 44, and reprinted with permission of Waters Corporation (© 2017).
Potential for Use of 2D-LC in Quality Control and Regulated Environments
A question frequently asked by new users of 2D-LC, or those considering implementing the technology to address their analytical problems, is whether 2D-LC is suitable for use in regulated laboratory environments (where good manufacturing practices [GMP] regulations must be followed) and for quality assurance and quality control (QA/QC) methods. This is an important question, because the answer obviously affects the role that we can expect 2D-LC to play in the future of separation science. Three recently published papers suggest that 2D-LC will indeed play an important role in these environments, particularly for quality control of complex pharmaceutical materials. First, Largy and Delobel and coworkers (45) discussed the versatility of a heart-cutting 2D-LC–MS platform that enables characterization of mAbs and ADCs during all stages of the product life cycle from development to release and stability testing. Second, Yang and Zhang and coworkers (23) described the validation of a heart-cutting 2D-LC-UV method that could be used for quality control of a small-molecule pharmaceutical material. They focused on the elements of a method validation protocol that are unique to 2D-LC and would not be included in the validation protocol for a conventional 1D-LC method. For example, they included the volume of the sample loop used to transfer fractions of 1D effluent to the 2D column in their approach to evaluate the robustness of the 2D-LC method. They concluded that the favorable outcome of their validation study indicates that 2D-LC is suitable for QC testing, and that such methods can be transferred to multiple laboratories. Finally, Williams and Brorson and coworkers (7), at the U.S. Food and Drug Administration, have described the development of a mLC–LC method involving affinity-based capture of mAbs using a 1D protein A column, followed by separation of mAb monomer and aggregates in the captured fraction using a 2D size-exclusion column. This fully automated, online approach allows capture of mAbs from crude in-process bioreactor samples and enables quantitation of the fraction of mAb monomer present in the reactor over time. The authors suggest that such technology may be deployable as a process analytical technology to enable real-time feedback of analytical data to bioprocess controls.
Summary and Outlook
Recent developments in HPLC column technologies and instrument technologies for 2D-LC are being leveraged in the development of 2D-LC methods to solve a variety of analytical problems in the pharmaceutical (small-molecule) and biopharmaceutical industries. These problems range from separation of difficult-to-resolve mixtures containing regioisomers or structurally similar API degradants and impurities, to complex mixtures such as ADC formulations or mixed-dose small-molecule drug formulations. Given the general trend in the pharmaceutical industry toward increasingly complex APIs, drug products, and manufacturing processes, we believe the role of 2D-LC in the pharmaceutical industry can only increase in the future. Historically, 2D-LC has been used mainly as an analytical tool supporting the early stages of drug development. Recently, however, it has been demonstrated that 2D-LC may be a viable tool for support of drug product quality control in regulated environments. If this trend continues, the adoption of 2D-LC will likely accelerate. Nevertheless, much remains to be done to unlock the full potential of 2D-LC as a powerful yet versatile separation tool. Further advances in column and instrument technologies will improve both performance and ease of use, and demonstration of new applications will undoubtedly capture the imagination of the pharmaceutical community.
References
- K. Zhang, J. Wang, M. Tsang, L. Wigman, and N. Chetwyn, Am. Pharm. Rev.16, 39–44 (2013).
- D.R. Stoll and P.W. Carr, Anal. Chem.89, 519–531 (2017). doi:10.1021/acs.analchem.6b03506.
- K. Sandra and P. Sandra, Bioanalysis7, 2843–2847 (2015). doi:10.4155/bio.15.210.
- C. Lee, J. Zang, J. Cuff, N. McGachy, T.K. Natishan, C.J. Welch, R. Helmy, and F. Bernardoni, Chromatographia76, 5–11 (2012). doi:10.1007/s10337-012-2367-5.
- C.J. Venkatramani, L. Wigman, K. Mistry, and N. Chetwyn, J. Sep. Sci. 35, 1748–1754 (2012). doi:10.1002/jssc.201200005.
- C.L. Barhate, L.A. Joyce, A.A. Makarov, K. Zawatzky, F. Bernardoni, W.A. Schafer, D.W. Armstrong, C.J. Welch, and E.L. Regalado, Chem Commun. 53, 509–512 (2017). doi:10.1039/C6CC08512A.
- A. Williams, E.K. Read, C.D. Agarabi, S. Lute, and K.A. Brorson, J. Chromatogr. B1046, 122–130 (2017). doi:10.1016/j.jchromb.2017.01.021.
- M. Sorensen, D.C. Harmes, D.R. Stoll, G.O. Staples, S. Fekete, D. Guillarme, and A. Beck, mAbs8, 1224–1234 (2016). doi:10.1080/19420862.2016.1203497.
- C.L. Barhate, E.L. Regalado, N.D. Contrella, J. Lee, J. Jo, A.A. Makarov, D.W. Armstrong, and C.J. Welch, Anal. Chem.89, 3545–3553 (2017). doi:10.1021/acs.analchem.6b04834.
- M.R. Schure and R.E. Moran, J. Chromatogr. A1480, 11–19 (2017). doi:10.1016/j.chroma.2016.12.016.
- B.W.J. Pirok, P. Breuer, S.J.M. Hoppe, M. Chitty, E. Welch, T. Farkas, S. van der Wal, R. Peters, and P.J. Schoenmakers, J. Chromatogr. A1486, 96–102 (2017). doi:10.1016/j.chroma.2016.12.015.
- B.M. Wagner, S.A. Schuster, B.E. Boyes, T.J. Shields, W.L. Miles, M.J. Haynes, R.E. Moran, J.J. Kirkland, and M.R. Schure, J. Chromatogr. A1489, 75–85 (2017). doi:10.1016/j.chroma.2017.01.082.
- D. Stoll, in Handbook of Advanced Chromatogratography and Mass Spectrometry Techniques, C. Byrdwell, M. Holcapek, Eds. (Elsevier, Amsterdam, 2017), p. 552.
- K. Zhang, Y. Li, M. Tsang, and N.P. Chetwyn, J. Sep. Sci. 36, 2986–2992 (2013). doi:10.1002/jssc.201300493.
- S.R. Groskreutz, M.M. Swenson, L.B. Secor, and D.R. Stoll, J. Chromatogr. A1228, 31–40 (2012). doi:10.1016/j.chroma.2011.06.035.
- S.R. Groskreutz, M.M. Swenson, L.B. Secor, and D.R. Stoll, J. Chromatogr. A1228, 41–50 (2012). doi:10.1016/j.chroma.2011.06.038.
- M. Pursch and S. Buckenmaier, Anal. Chem.87, 5310–5317 (2015). doi:10.1021/acs.analchem.5b00492.
- C.J. Venkatramani, M. Al-Sayah, G. Li, M. Goel, J. Girotti, L. Zang, L. Wigman, P. Yehl, and N. Chetwyn, Talanta148, 548–555 (2016). doi:10.1016/j.talanta.2015.10.054.
- H. Luo, W. Zhong, J. Yang, P. Zhuang, F. Meng, J. Caldwell, B. Mao, and C.J. Welch, J. Pharm. Biomed. Anal.137, 139–145 (2017). doi:10.1016/j.jpba.2016.11.012.
- K. Sandra, G. Vanhoenacker, I. Vandenheede, M. Steenbeke, M. Joseph, and P. Sandra, J. Chromatogr. B1032, 119–130 (2016). doi:10.1016/j.jchromb.2016.04.040.
- P. Petersson, K. Haselmann, and S. Buckenmaier, J. Chromatogr. A1468, 95–101 (2016). doi:10.1016/j.chroma.2016.09.023.
- Y. Ouyang, Y. Zeng, Y. Rong, Y. Song, L. Shi, B. Chen, X. Yang, N. Xu, R.J. Linhardt, and Z. Zhang, Anal. Chem.87, 8957–8963 (2015). doi:10.1021/acs.analchem.5b02218.
- S.H. Yang, J. Wang, and K. Zhang, J. Chromatogr. A.1492, 89–97 (2017). doi:10.1016/j.chroma.2017.02.074.
- D.R. Stoll, E.S. Talus, D.C. Harmes, and K. Zhang, Anal. Bioanal. Chem. 407, 265–277 (2014). doi:10.1007/s00216-014-8036-9.
- C.J. Venkatramani, J. Girotti, L. Wigman, and N. Chetwyn, J. Sep. Sci.37, 3214–3225 (2014). doi:10.1002/jssc.201400590.
- J.G. Shackman and B.L. Kleintop, J. Sep. Sci. 37, 2688–2695 (2014). doi:10.1002/jssc.201400515.
- D.R. Stoll, D.C. Harmes, J. Danforth, E. Wagner-Rousset, D. Guillarme, S. Fekete, and A. Beck, Anal. Chem. 87, 8307–8315 (2015). doi:10.1021/acs.analchem.5b01578.
- Y. Li, C. Gu, J. Gruenhagen, K. Zhang, P. Yehl, N.P. Chetwyn, and C.D. Medley, J. Chromatogr. A1393, 81–88 (2015). doi:10.1016/j.chroma.2015.03.027.
- L. Dai, G.K. Yeh, Y. Ran, P. Yehl, and K. Zhang, J. Pharm. Biomed. Anal.137, 182–188 (2017). doi:10.1016/j.jpba.2017.01.036.
- M. Peñín-Ibáñez, M.J. Santos-Delgado, and L.M. Polo-Díez, Anal. Bioanal. Chem.409, 1135–1144 (2017). doi:10.1007/s00216-016-0039-2.
- E.L. Regalado, J.A. Schariter, and C.J. Welch, J. Chromatogr. A1363, 200–206 (2014). doi:10.1016/j.chroma.2014.08.025.
- Q. Liu, X. Jiang, H. Zheng, W. Su, X. Chen, and H. Yang, J. Sep. Sci. 36, 3158–3164 (2013). doi:10.1002/jssc.201300412.
- H. Kanazawa, Y. Konishi, Y. Matsushima, and T. Takahashi, J. Chromatogr. A797, 227–236 (1998). doi:10.1016/S0021-9673(97)00928-X.
- S. Fekete, D. Guillarme, P. Sandra, and K. Sandra, Anal. Chem.88, 480–507 (2016). doi:10.1021/acs.analchem.5b04561.
- M.M. Bushey and J.W. Jorgenson, Anal. Chem.62, 161–167 (1990). doi:10.1021/ac00201a015.
- S. Di Palma, M.L. Hennrich, A.J.R. Heck, and S. Mohammed, J. Proteomics75, 3791–3813 (2012). doi:10.1016/j.jprot.2012.04.033.
- D. Stoll, J. Danforth, K. Zhang, and A. Beck, J. Chromatogr. B1032, 51–60 (2016). doi:10.1016/j.jchromb.2016.05.029.
- G. Vanhoenacker, I. Vandenheede, F. David, P. Sandra, and K. Sandra, Anal. Bioanal. Chem.407, 355–366 (2015). doi:10.1007/s00216-014-8299-1.
- A. Beck, L. Goetsch, C. Dumontet, and N. Corvaïa, Nat. Rev. Drug Discov. (2017). doi:10.1038/nrd.2016.268.
- Y. Li, D. Hewitt, Y. Lentz, J. Ji, T. Zhang, and K. Zhang, Anal. Chem. 86, 5150–5157 (2014). doi:10.1021/ac5009628.
- C. Wang, S. Chen, J.A. Brailsford, A.P. Yamniuk, A.A. Tymiak, and Y. Zhang, J. Chromatogr. A1426, 133–139 (2015). doi:10.1016/j.chroma.2015.11.065.
- M. Sarrut, S. Fekete, M.-C. Janin-Bussat, O. Colas, D. Guillarme, A. Beck, and S. Heinisch, J. Chromatogr. B1032, 91–102 (2016). doi:10.1016/j.jchromb.2016.06.049.
- M. Sarrut, A. Corgier, S. Fekete, D. Guillarme, D. Lascoux, M.-C. Janin-Bussat, A. Beck, and S. Heinisch, J. Chromatogr. B1032, 103–111 (2016). doi:10.1016/j.jchromb.2016.06.048.
- R.E. Birdsall, S.M. McCarthy, M.C. Janin-Bussat, M. Perez, J.-F. Haeuw, W. Chen, and A. Beck, mAbs8, 306–317 (2016). doi:10.1080/19420862.2015.1116659.
- E. Largy, A. Catrain, G. Van Vyncht, and A. Delobel, Curr. Trends Mass Spectrom.14(2), 29–35 (2016).
Dwight R. Stoll is with the Department of Chemistry at Gustavus Adolphus College in St. Peter, Minnesota, and Todd D. Maloney is with Eli Lilly and Company in Indianapolis, Indiana. Direct correspondence to dstoll@gustavus.edu

Extracting Estrogenic Hormones Using Rotating Disk and Modified Clays
April 14th 2025University of Caldas and University of Chile researchers extracted estrogenic hormones from wastewater samples using rotating disk sorption extraction. After extraction, the concentrated analytes were measured using liquid chromatography coupled with photodiode array detection (HPLC-PDA).
Polysorbate Quantification and Degradation Analysis via LC and Charged Aerosol Detection
April 9th 2025Scientists from ThermoFisher Scientific published a review article in the Journal of Chromatography A that provided an overview of HPLC analysis using charged aerosol detection can help with polysorbate quantification.


