Quantification of Polybrominated Diphenyl Ethers in Avian Dried Blood Spots by Gas Chromatography–Tandem Mass Spectrometry Coupled with Simple Sample Preparation
LCGC North America
With a simple liquid extraction approach and a short, 13-min GC method, dried blood spots can be analyzed effectively and rapidly. This method demonstrates that dried blood spot cards are an effective technique for toxicological studies.
In this article, we outline a simple, reliable method for the quantification of 12 polybrominated diphenyl ethers (PBDEs) in dried blood spots using a straightforward sample extraction method coupled with analysis by gas chromatography–tandem mass spectrometry (GC–MS/MS). With a simple liquid extraction approach and a short 13-min GC method, dried blood spots may be effectively and rapidly analyzed, which demonstrates the use of dried blood spot cards as an effective technique for toxicological studies.
Polybrominated diphenyl ethers (PBDEs) are organobromine compounds commonly used as flame retardants in products such as plastics, polyurethane foams, textiles, electronics, and building materials (1). Flame retardants can be used as either reactive or additive chemicals. The reactive flame retardants are incorporated into the polymeric materials by covalent bonding between the polymer and the flame retardant, whereas the additive types are dissolved in the polymer (2,3). Because of their low cost and effectiveness, PBDEs are the most commonly used reactive flame retardants. PBDEs are structurally similar to polychlorinated biphenyls (PCBs) and so have similar properties, with 209 total number of congeners depending on the number and positions of the bromine atoms on the two phenyl rings (4).
PBDEs are highly hydrophobic and resistant to biodegradation, acids and bases, heat, light, and reducing or oxidizing agents, and as a result environmental concerns for their accumulation have been raised since the early 1990s when trace levels were detected even in rural areas (5–8). Humans may be exposed to low levels of PBDEs, which can result from waste incineration or from waste leaching from landfills into water, through ingestion of food and by indoor dust inhalation in their domestic environment (1). Studies have reported that PBDEs bioaccumulate in blood, breast milk, eggs, and fat tissues (9). PBDEs have been shown to cause brain, immune, reproductive, and hepatic hormone disrupting effects in animals (9–12), and health effects on humans are under investigation (13–15).
Over the years, sample preparation and analytical techniques such as liquid–liquid extraction, solid-phase extraction (SPE), gas chromatography–mass spectrometry (GC–MS) and liquid chromatography–mass spectrometry (LC–MS) have been employed to quantify PBDEs in limited volumes of whole blood (16–18). Although methods assessing PBDE concentrations in whole blood and serum are detailed extensively in the analytical literature, very few methods have been developed and published for the quantification of PBDEs in dried blood spots. Preparation of liquid blood samples for the analysis of PBDEs can be both difficult and time consuming, with potential complications in sample collection and analysis. Dried blood spots, however, provide an alternative method for sampling blood that overcomes some of the limitations of using liquid whole blood (19–22). Using dried blood spots as a sample matrix significantly reduces the likelihood of contamination, as well as collection vessel breakage, and eliminates the use of analyte preservatives or treatments resulting from customs and import requirements that may interfere with the analysis. Sample transportation does not require refrigeration or freezing-it is economical and requires minimal manipulation at the collection site. Additionally, a sample aliquot obtained from dried blood spots is expected to yield equivalent levels of accuracy and precision compared to a pipette volume of a liquid blood sample (23). To take advantage of the alternative dry blood sampling technique described above for environmental analysis, it is imperative to be able to efficiently remove targeted contaminants from blood spot cards. The methodology described in this article, a development of our previous efforts (24), reports an efficient, rapid, and sensitive procedure for the extraction of PBDEs from avian dried whole blood spots followed by analysis using gas chromatography–tandem mass spectrometry (GC–MS/MS) that minimizes sample matrix effects and retains analyte sensitivity.
Experimental
Materials and Reagents
Isooctane (≥99.9%), formic acid (≥95%), and 4,4’-dibromooctafluorobiphenyl (99.9%) were purchased from Sigma-Aldrich. PBDE California Method 750-M standard solution mixture and 2,3’,4,6-tetrabromodiphenyl ether solution were purchased from AccuStandard. Chicken red blood cells were acquired from Lampire Biological Laboratories.
Red blood cells were spotted onto Whatman 903 Protein Saver cards, which were purchased from GE Healthcare. Clear 8-mL disposable vials and 2-mL microcentrifuge tubes used for sample preparation were purchased from Fisher Scientific.
Instrumentation
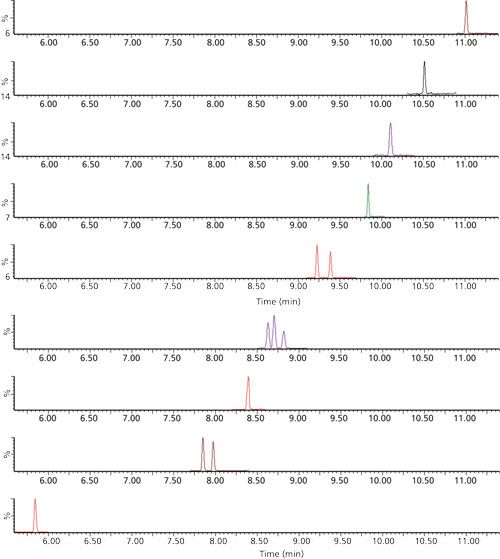
Determination of sample and analyte weights was conducted through the use of a Precisa XT 220A analytical balance. A Bransonic 5510R-DTH ultrasonic cleaner was used to sonicate the samples, a Thermo Scientific 945093 multitube vortexer was used for sample mixing, and a Thermo Scientific Legent Micro 21R centrifuge was used for sample centrifugation. Analyses were performed on an Agilent Technologies 6890N gas chromatograph equipped with a 30 m x 0.25 mm, 0.25-µm df RXI-5MS Restek capillary column and coupled with an Agilent Technologies 7683B automatic liquid handler and a Waters Quattro Micro tandem mass spectrometer in positive electron ionization mode at 70 eV, scanning in multiple-reaction monitoring (MRM) mode. The carrier gas was helium at a constant flow of 1.0 mL/min and the collision gas was argon, both UHP300 grade. The injector port was equipped with a Restek Siltek single gooseneck splitless liner with a deactivated wool insert and was set at a temperature of 280 °C. A 1.0-µL injection in splitless mode was performed with a purge pressure of 50 kPa after 1 min. The oven program for the separation of all analytes was initiated at 110 °C, held for 1.5 min, ramped at 30 °C per min to 340 °C, and held for 3.8 min. Baseline separation was achieved for all analytes within 11 min with a total run time of 13 min. The GC interface temperature and the spectrometer source temperature were both set at 250 °C. Statistical analysis for obtaining calibration and quantification results for all compounds were performed using the Waters QuanLynx program, which was included in the MassLynx software v.4.2. The MRM parameters for each analyte, the fragmentation ions used for quantification, retention times, and the linear correlation coefficients of the calibration curves are presented in Table I, and the chromatograms are shown in Figure 1.
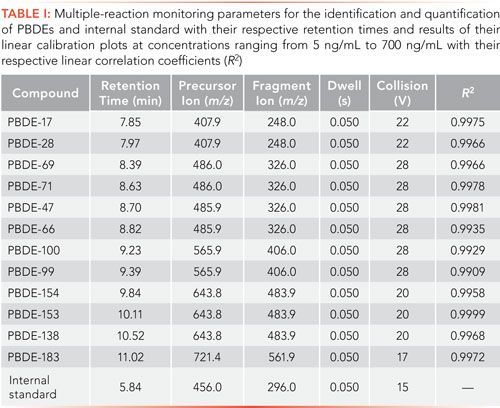
Figure 1: Multiple-reaction monitoring chromatograms produced by the GC–MS/MS analytical method of the targeted PBDEs and the internal standard at concentrations of 700 ng/mL and 500 ng/mL, respectively. Retention times are displayed in Table I. The chromatograms for PBDE-209 and 2,2’,6,6’-tetrabromobisphenol A, also present in the California Method 750-M standard solution mixture, are not displayed as they were not considered targeted compounds at the time of this study.
Standard Solutions Preparation
A 700-ng/mL solution containing the PBDEs of interest was produced by diluting and combining commercial 10,000-ng/mL and 50,000-ng/mL solutions of PBDEs in isooctane up to 10 mL in isooctane. Calibration standards with concentrations ranging from 700 ng/mL to 5 ng/mL were produced by further serial dilution. The internal standard stock solution used 4,4’-dibromooctafluorobiphenyl and was prepared by diluting a 10-mg/mL solution up to 10 mL in isooctane to a concentration of 1.0 mg/mL. A 10,000-ng/mL spiking solution was prepared by subsequent serial dilutions with isooctane.
Sample Preparation
Dry Blood Spot Extraction
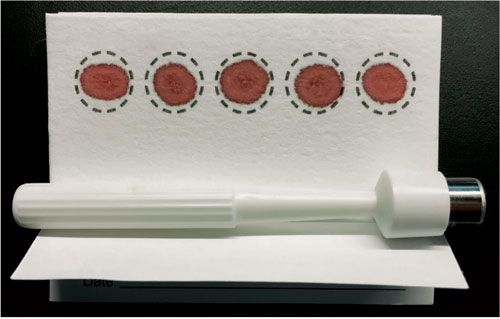
Method validation samples were prepared by spreading 15 µL of the analyte free chicken red blood cells in replicates of five blood spots onto clean protein saver cards (Whatman) that were immediately spiked with PBDE spiking solution to ensure mixing of the solution with the still-wet blood. Blood spots were then allowed to dry at room temperature, and the result is a typical blood-spotted card as shown in Figure 2. After drying, each spot was center-punched from the card using a disposable punch, weighed, and transferred to an 8-mL glass sample vial. After all samples were punched and transferred to individual vials, 1.920 mL of methanol was added to each vial. An additional 80 µL of formic acid was then added to assist in lysing dried blood cells, thus enhancing the extraction. Samples were sonicated for 15 min, and then vortexed at 2500 rpm for 15 min. A 1.000-mL aliquot of each extract was transferred into individual 2-mL microcentrifuge tubes and centrifuged for 10 min at 14,000 rpm. A 450-µL aliquot of the resulting supernatant solution of each sample was transferred directly to a 2-mL autosampler vial and spiked with 50 µL of 4,4’-dibromooctafluorobiphenyl internal standard solution. The extracted residual card spots then were dried and weighed to obtain the weight of the spotted dry blood used in quantitative calculations.
Figure 2: Typical sample of dried avian whole blood spotted onto a Whatman FTA card with disposable punch.
Results and Discussion
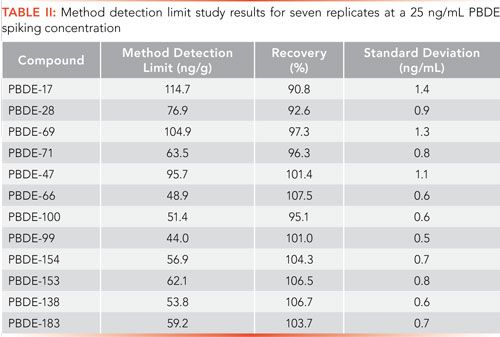
The proposed method was assessed by performing both a method detection limit (MDL) study and precision and accuracy (PA) study. The MDL study was carried out by the preparation and analysis of seven replicate samples processed as described above. The method detection limit was calculated according to the U.S. Code of Federal Regulations Title 40 part 136 and is defined as follows:

where t(n-1, 1-α=0.99) = 3.143, and is equal to the Student’s t value at 99% confidence for six degrees of freedom, and S is equal to the standard deviation of the seven replicate measurements. At a 25-ng/mL spiking concentration, percent recoveries and method detection limits for the 12 targeted PBDEs ranged from 44ng/g for PBDE-99 to 114.7ng/g for PBDE-17 (Table II).
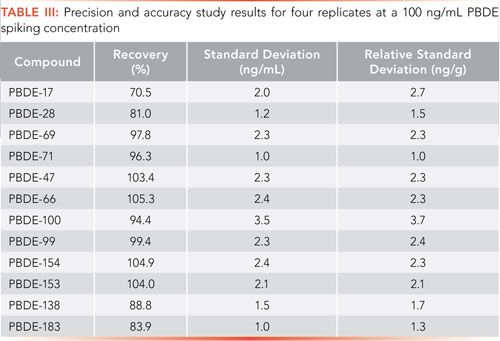
Similarly, precision and accuracy were determined at a spiking level of 100 ng/mL for four replicates, with sample recoveries used to document method accuracy and standard deviation used a measure of precision. Recoveries are shown in Table III and range from 70.5% for PBDE-17 to 105.3% for PBDE-66.
An important aspect in sample preparation is proper spiking of the PBDE standard solution onto the protein saver card to ensure acceptable PBDE spike recoveries and avoid bias from low recovery results in quality control samples. In our earlier research findings (24), recoveries were as low as 40% due to diffusion of the spiking solutions across the surface of the card outside the radius of the sample spot. In a comparison of dried blood spot spiking techniques, Li and colleagues (21) reported similar results, with direct spiking of dried blood spots yielding sample spike accuracies with a -45% bias. The preferred method involved the spiking of blood before spotting onto cards, according to the same authors, which had produced recoveries with a +7.9% bias. However, this method is impractical, because it would require the individual performing the initial field sampling to spike the blood samples with the appropriate quality control standards before spotting the blood on the cards. Although this requirement may not be an issue within a laboratory where the initial blood sampling through to quantitative analysis is performed, it is highly impractical for obtaining field-based samples. Consequently, it was found that to obtain acceptable PBDE spike recoveries without pre-spiking blood, the blood spots must retain the entirety of the spiking solution so that the only area for diffusion to occur is on the blood spot itself. Nevertheless, future investigations might benefit from comparing the merits of directly spiking blood before spotting the cards to observe any differences in recovery. Furthermore, red blood cell density can also be investigated because it is an important factor in analyte extraction from dried blood spots and liquid whole blood. Overall, this spiking methodology produced acceptable recoveries that are similar to results obtained for polycyclic aromatic hydrocarbons in whole blood or plasma by other methods developed in our laboratory (25,26).
Conclusions
A rapid, efficient, and reliable method was developed and validated for the accurate determination of PBDEs in avian whole blood on blood spot cards in the low nanograms-per-gram range. The utility of dry blood spot card medium for the sampling of blood offers multiple unique advantages over traditional liquid whole blood or plasma samples for both the sampling and analysis procedures. The analytical methodology described in this article offers the advantage of the alternative dry blood sampling technique for environmental analysis. The overall success of this methodology heavily depends on the ability to efficiently remove targeted contaminants from blood spot cards. Our laboratory is expanding this method to be used successfully for routine screening of various persistent organic pollutants in blood and serum, and other similar liquid matrices that can be efficiently spotted on the cards.
Acknowledgments
We acknowledge valuable guidance provided from Kim Lilley and Stephen Harrington of Waters Corporation (USA) on the sample preparation and the analysis. Special thanks to Aliaksandr Yeudakimau and Gary Ulatowski who were involved in the early stages of method development and sample preparation of this study.
References
- F. Rahman, K. H. Langford, M.D. Scrimshaw, and J.N.Lester, Sci. Total Environ.275, 1–17 (2001).
- H.M. Stapleton, S. Klosterhaus, A. Keller, P.L. Ferguson, S. van Bergen, E. Cooper, T.F. Webster, and A. Blum, Environ. Sci. Technol. 45, 5323–31 (2011).
- R. Renner, Sci. Technol. 34(9), 222A–226 (2000).
- World Health Organization (WHO) Brominated diphenyl ethers, Environ Health Criteria 162 (1994), http://apps.who.int/iris/bitstream/10665/40594/1/9241571624-eng.pdf.
- A.M.C.M. Pijnenburg, J.W. Evert, J. de Boer, and J.P. Boon, Rev. Environ Contam. Toxicol.141, 1–26 (1995).
- I. Watanabe, T. Kashimoto, and R. Tatsukawa, Chemosphere16(10–12), 2389–2396 (1987).
- R.E. Alcock, A. Sweetman, and K.C. Jones, Chemosphere38(10), 2247–2262 (1999).
- J. De Boer, P. Wester, H.J.C. Klamer, W.E. Lewis, and J.P. Boon, Nature 394, 28–29 (1998).
- Y. Lind, P.O. Darnerud, and S. Atuma, Environ. Res. 93(2), 186–194 (2003).
- S.N. Kuriama, C.E. Talsness, K. Grote, and I. Chahoud, Environ. Health Perspect. 113(2), 149–154 (2005).
- L.G. Costa and G. Giordano, Neurotoxicology32(1), 9–24 (2011).
- D.T. Szabo, V.M. Richardson, D.G. Ross, J.J. Diliberto, P.R. Kodavanti, and L.S. Birnbaum, Toxicol. Sci.107(1), 27–39 (2009).
- K. Ni , Y. Lu , T. Wang , K. Kannan , J. Gosens , L. Xu , Q. Li , L.Wang, and S.Liu, Int. J. Hyg. Environ. Health216(6), 607–623 (2013).
- T.A. McDonald, Chemosphere46(5), 745–755 (2002).
- K. Ibhazehiebo, T. Iwasaki, J. K.Kuroda,W. Miyazaki, N.Shimokawa, and N. Koibuchi, Environ. Health Perspect.119(2), 168–175 (2011).
- L.Yan-Ping, I. N. Pessah, and B. Puschner, Talanta 113, 41–48 (2013).
- L. Bramwella, A. Fernandesb, M. Roseb, S. Harradc, and T. Pless-Mullolia, Chemosphere116, 67–74 (2014).
- M.A.E. Abdallah, Current Status and Future Perspectives International Scholarly Research Notices2014, 21 (2014).
- B. Vining, J. Hart, L. Boivin, D. Saul, R. Appele, and J. Nichols, “Analysis of POPs from 50 μL Dried Blood Spots,” poster presented at Dioxin Madrid, 2014.
- N. Zheng, L. Yuan, Q.C. Ji, H. Mangus, Y. Song, C. Frost, J. Zeng, A. Aubry, and M.E. Arnold, J. Chromatogr. B.988, 66–74 (2015).
- W. Li and M.S. Lee, Dried Blood Spots: Applications and Techniques (John Wiley & Sons, 2014).
- S. Trudeau, P. Mineau, G.S. Cartier, G. Fitzgerald, L. Wilson, C. Wheler, and L.D. Knopper, Biomarkers12(2), 145–154 (2007).
- V. Ruth and J. Henion, Anal. Chem. 88(13), 6789–6796 (2016).
- A.A. Provatas, C.A. King, S.L. Kolakowski, J.D. Stuart, and C.R. Perkins, Analytical Letters, available online: http://dx.doi.org/10.1080/00032719.2017.1302461.
- A.A. Provatas, A.V. Yevdokimov, C.A. King, E.L. Gatley, J.D. Stuart, D.C. Evers, and C.R. Perkins, J. Sep. Sci.38(15), 2677–2683 (2015).
- A.V. Yeudakimau, A.A. Provatas, C.R. Perkins, and J.D. Stuart, Analytical Letters46(6), 999–1011 (2013).
Anthony A. Provatas, James D. Stuart, and Christopher R. Perkins are with the University of Connecticut, Center for Environmental Sciences and Engineering in Storrs, Connecticut. Direct correspondence to anthony.provatas@uconn.edu
Fundamentals of Benchtop GC–MS Data Analysis and Terminology
April 5th 2025In this installment, we will review the fundamental terminology and data analysis principles in benchtop GC–MS. We will compare the three modes of analysis—full scan, extracted ion chromatograms, and selected ion monitoring—and see how each is used for quantitative and quantitative analysis.
Quantifying Microplastics in Meconium Samples Using Pyrolysis–GC-MS
March 26th 2025Using pyrolysis-gas chromatography and mass spectrometry, scientists from Fudan University and the Putuo District Center for Disease Control and Prevention detected and quantified microplastics in newborn stool samples.
The Role of SPME Combined with GC–MS for PFAS Analysis
Published: March 25th 2025 | Updated: March 25th 2025Emanuela Gionfriddo and Madison Williams from University at Buffalo, the State University of New York, NY, USA discuss the important role that solid-phase microextraction (SPME) techniques with gas chromatography mass spectrometry (GC–MS) can play in the analysis of per- and polyfluoroalkyl substances (PFAS).


