Rapid Test for Content Uniformity of Coenzyme Q10 in Soft Gel Capsules by HPTLC
Coenzyme Q10, found naturally in the body, is involved in the production of body energy. Thus, heart, lung, and liver have the highest concentration of Q10.
Coenzyme Q10, found naturally in the body, is involved in the production of body energy. Thus, heart, lung, and liver have the highest concentration of Q10. The substance is active in many ways, but primarily assumed to enhance the immune system and to work as an antioxidant, protecting against free radicals that damage cells. As a dietary supplement, it is mostly sold in soft gel capsules. Most pharmacopeias prescribe tests for content uniformity for pharmaceuticals that are administered in single doses. The procedures are laid down in the internal quality control procedures of the manufacturers, in the official registration documents, and in international trading certifications.
Our aim was to develop a rapid HPTLC method to test content uniformity of a large number of coenzyme Q10 capsules. The key targets were simple sample preparation and rapid chromatographic development. The evaluation of the results was to be straightforward and reliable.


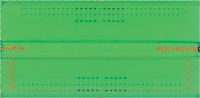
Figure 1: 60 samples (6 batches, B1âB6) and 12 standards* were applied onto one HPTLC plate; coenzyme Q10 is seen at Rf â 0.20. In the Q10-batches on the center tracks vitamin B2 and vitamin E are also present (Rf â 0 and 0.4); (*Note: For better visualization in this figure the application volume was increased to 6 μL).
Sample Preparation. One soft gel capsule was placed into a flask and 50.0 mL of toluene were added. While submerged in the liquid the capsule was cut with a blade. The flask was placed on a shaker for 15 min. Based on the target content of the capsule an aliquot of the extract was diluted to a concentration of about 15 μg/mL.
Standard Solutions. A standard solution containing 1 mg/mL of coenzyme Q10 in toluene was prepared. The stock solution was diluted with toluene to 10, 15, and 20 μg/mL of coenzyme Q10.
Layer. HPTLC plates silica gel 60 F254 (Merck), 20 × 10 cm.
Sample Application. Bandwise with ATS4, band length 2 mm, track distance 5 mm, distance from lower edge 8 mm, distance from left edge 20 mm, application volumes 2 μL of samples and standard solutions.
Chromatography. In the horizontal developing chamber (HDC: 20 × 10 cm) or twin trough chamber (TTC) or in the ADC2 without saturation.
Densitometry. TLC Scanner 4 with winCATS software, absorption measurement at 282 nm; slit dimension: 3.00 × 0.20 mm; evaluation via peak height, linear regression (20–50 ng); alternatively 20–150 ng polynomial regression.
Results and Discussion
As an example, 10 samples each from 6 different batches and 12 standards of various concentrations were applied on a 20 × 10 cm HPTLC plate and developed in a horizontal developing chamber from both sides. The handling of the analysis was very easy due to the use of toluene as solvent for the sample and as mobile phase for chromatography. Only 86 min in total were required for the entire analysis of 72 samples.

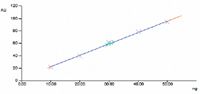
Figure 2: Calibration function for coenzyme Q10 at UV 282 nm. Measurement of 10 samples and 5 standards using linear calibration (P323_101011_03).
Summary
The test for content uniformity was performed with 10 samples according to the European Pharmacopoeia (1) and the USP 34 (2), respectively. The target content of the soft gel capsules according to the label claim was 30 mg. The average of the measured samples was 30.08 mg. The mean of individual contents expressed as a percentage of the label claim was calculated and resulted in = 100.25 with a standard deviation of s = 2.76. According to (1,2) the acceptability constant k for 10 samples is defined as k = 2.4. For the final calculation of the acceptance value (AV) the reference value M must be known; here for case 1 M = (1,2). The calculated AV = 6.6 was smaller than the maximal allowed AV of 15. Therefore, the content of the soft gel capsules was determined as uniform.
References
(1) European Pharmacopoeia 7.0, 2.9.40. Uniformity of Dosage Units.
(2) USP 34 /NF29, The United States Pharmacopeial Convention 12601 Twinbrook Parkville, MD 20852, <905> Uniformity of Dosage Units, s. 403-406.
CAMAG Scientific Inc.
515 Cornelius Harnett Drive, Wilmington, N.C. 28401
tel. (800) 334-3909, (910) 343-1830, Fax: (910) 343-1834
Email: Lab@camag.com, Website: www.camag.com


A Guide to (U)HPLC Column Selection for Protein Analysis
April 16th 2025Analytical scientists are faced with the task of finding the right column from an almost unmanageable range of products. This paper focuses on columns that enable protein analysis under native conditions through size exclusion, hydrophobic interaction, and ion exchange chromatography. It will highlight the different column characteristics—pore size, particle size, base matrices, column dimensions, ligands—and which questions will help decide which columns to use.
The Benefits of Custom Bonded Silica
April 1st 2025Not all chromatography resins are created equal. Off-the-shelf chromatography resins might not always meet the rigorous purification requirements of biopharmaceutical manufacturing. Custom bonded silica from Grace can address a wide range of separation challenges, leading to real performance improvements. Discover more about the latest innovations in chromatography silica from Grace, including VYDAC® and DAVISIL®.
5 Things to Consider When Selecting a Chromatography Silica
April 1st 2025Particularly in the pharmaceutical industry, drug purity isn’t just a goal – it’s essential for achieving safety, stability and efficacy. However, purification is easier said than done, especially with challenging molecules like DNA and RNA “oligonucleotides,” due in large part to their diversity and the range of impurities that can be generated during production. Enter DAVISIL® chromatographic silica, with a wide range of pore diameters and particle sizes to meet your specific application, performance and sustainability requirements. Before you choose the chromatography resin for your next purification application, take a look at these 5 considerations.
Automating Protein Purification: Efficiency, Yield, and Reproducibility
March 27th 2025Recent advancements in automated protein purification stress the importance of efficiency, scalability, and yield consistency. This eBook compares different purification platforms, highlighting their impact on downstream applications and demonstrating how automation enhances throughput and process control.

