Quantification of Total w-6 and w-3 Fatty Acids and w-6/w-3 Ratio in Human Serum Using GC-MS
LCGC North America
This article demonstrates the superiority of the GC-MS approach over spectrophotometry.
The ratio of ω-6 to ω-3 fatty acids as a biomarker for many clinical conditions such as breast cancer, coronary cancer, and cardiac arrest has become an issue of concern to many researchers (1–4). ω-3 fatty acids are essential for human development and also are most helpful for achieving and sustaining good health (5). An acceptable balance between the fractions is essential for development of human beings (6). Artemis and colleagues (1), for example, suggested that the most important aspect of polyunsaturated fatty acids (PUFAs) in the prevention of cancer is the PUFA ratio rather than the absolute amount of either. Many studies have found that the ratios in Western diets lie between 10 to 20 (1–4). Epidemiological and experimental research indicates that a ratio ranging from 1/1 to 2/1 has a protective effect against the development and growth of breast and colon cancers. Short-term biomarker studies in human beings suggest that ω-3 PUFA supplemented at an ω-6/ω-3 ratio of about 2.5/1 may protect against colorectal carcinogenesis (1,4). Little information is yet available on the role of ω-6 PUFA relative to ω-3 PUFA on prostate cancer, and the findings are controversial (1). It has been cited that ω-3 fatty acids compete with ω-6 fatty acids for the cyclo-oxygenase enzymes, and their products often have the inverse physiologic effect of the ω-6 fatty acid eicosanoid products (7). This effect therefore calls for use of an analytical method that can detect very low concentrations of ω-6 and ω-3 fatty acids and hence more exact ω-6/ω-3 ratio predictions.
Studies have noted that consumption of ω-6 over the past 100–150 years has increased enormously due to the increased intake of vegetable oils from corn, sunflower seeds, safflower seeds, cotton seeds, and soybeans (1,4). Intake of ω-3 fatty acids has continued to decrease because of a decline in fish consumption and the industrial production of animal feeds rich in grains containing ω-6 fatty acids, which has led to the production of meat, eggs, and cultured fish rich in ω-6 fatty acids and poor in ω-3 fatty acids (1,4,8). In the same way, modern agriculture with the emphasis on production has resulted in decreased ω-3 fatty acid content in many foods, green leafy vegetables, animal meat, eggs, and fish (1,4). This change of feeding behavior has affected the ω-6/ω-3 ratio in the human body. Hence, research on application of ω-6/ω-3 ratios as a clinical biomarker is of great significance and importance in dietetics and nutrition. The ω-6/ω-3 ratio in the diet also varies with location. In the United States, United Kingdom, and Northern Europe the ratios range from 15.00:1 to 16.74:1 (4,8). For Japan the ratio is 4.00:1 (4), and in India rural population ratios range from 5:1 to 6.1:1 and urban population ratios range from 38:1 to 50:1 (4). The concern is how these changes have affected the health of the people in general and how the ω-6/ω-3 ratio can be used effectively as a biomarker for diseases.
Methods commonly used for analysis of PUFAs in human serum include high performance liquid chromatography (HPLC), gas chromatography (GC), and thin-layer chromatography (TLC) (8,9). The main challenge in these analyses is the fact that the methods obtain the total amount of PUFAs instead of ω-6/ω-3 ratios. In GC analyses, results reported as relative percentages of the calculated total peak areas or peak heights are prone to change when the number of the integrated peak height or peak area is reduced or increased. This method of expressing data has been shown to be less accurate than absolute concentration data and of lesser meaning in relation to the clinic issue earlier discussed as compared to the ω-6/ω-3 ratios (9). This study therefore has quantified the total concentrations for three ω-6 and three ω-3 fatty acids as well as the ratios.
Experimental
Chemicals: Stable internal standards included the methyl esters of the ω-6 fatty acids (linoleic, conjugated linoleic, and arachidonic), the ω-3 fatty acids (linolenic, eicosapentaenoic, docosahexaenoic), and tridecanoic acid, all of which were obtained from Sigma-Aldrich (St. Louis, Missouri). The standards were 90–99% pure based on GC analysis. All other chemicals and solvents used in the study were of high purity and were obtained from Sigma-Aldrich and used without further purification.
Stock solutions for each of the analytes with maximum total concentrations of 0.02 M were prepared. The stock solutions were used to prepare mixtures that were analyzed to plot the calibration curve. Serum samples for this work were provided by staff and volunteers at the Hillcrest Medical Center (HMC) in Tulsa, Oklahoma. The anonymous samples from HMC were from volunteers who were already requesting a lipid profile and had given consent. No attempt was made to solicit samples nor was any extensive medical information derived from the samples (except for the cholesterol concentration, which was determined by an outside clinical laboratory using an enzymatic test). Subjects fasted for at least 12 h before the samples were collected. A venous blood sample was collected into a Vacutainer red and grey capped separation tube. After inversion of the tube five times to mix the blood and the components of the collection tube, the sample was centrifuged at 3400 rpm for 15 min. The collection tube contained a clotting activator that takes approximately 30 min to activate and a floating gel that separates the red blood cells from the serum during the centrifugation step. The serum, which was the top layer in the tube, was then transferred to a 10-mL glass vial with a screw cap. The samples were analyzed using GC–MS and the Purdie assay technique (11,12). The GC–MS analyses and Purdie assay were completed on the sample within one day of receiving the sample. Samples were stored in a refrigerator at 2–4 °C and were allowed to return to room temperature before analyses. HMC samples were drawn from patients with normal to elevated cholesterol levels.
Sample Preparation for GC–MS Analysis: Human blood serum was esterified using the method given by Guy Lepage and C. Roy (10,11). The benzene upper phase was drawn using a 100-µL micropipette and topped to 500 µL using benzene (11,12). Analysis was performed using GC–MS. Six PUFAs were quantified using tridecanoic acid methyl ester (TDAME) internal standard. A 1-µL aliquot of the upper benzene phase of the esterified serum was chromatographed as methyl esters on a 30 m × 0.320 mm, 0.25-mm df DB-23 fused silica column (Agilent Technologies, Santa Clara, California). Analysis was performed on Shimadzu (GCMS-QP2010) gas chromatograph (Columbia, Maryland). Helium was used as the carrier gas. The injection temperature was held at 250 °C. Splitless injection mode was used. The oven temperature was held for 2.0 min at 50 °C and then was raised to 180 °C at 10 °C/min; after 5.0-min hold, the temperature was raised to 240 °C at a rate of 5.0 °C/min and held for 13 min. The GC–MS system was tuned everyday before running the samples. Peaks were identified by the use of pure reference compounds.
Calibration Curve: A stock 0.02 M mixture of ω-6 and ω-3 PUFAs and TDAME was made using benzene as the solvent. A 1.5-mL volume of this the stock solution was diluted with benzene to create a series of 2:1, 4:1, 8:1, and 16:1 stock solution:benzene mixtures, and 50 µL of 0.03-g/mL TDAME in 4:1 methanol–benzene was added to each diluted solution. A 1-µL volume of each diluted sample was analyzed four times (n = 4) at different dilutions. Calibration curves of peak area against concentration in moles per liter for TDAME, linoleic acid methyl ester (LAME), linolenic acid methyl ester (LNAME), conjugated linoleic acid methyl ester (CLAME), arachidonic acid methyl ester (AAME), eicosapentaenoic acid methyl ester (EPAME), and dicosahexaenoic acid methyl ester (DHAME) were plotted. Consecutive calibration (n = 4) exhibited linearity with R2 values ranging from 0.9414 to 0.9967.
Identification and Quantification: The identities of the sample methyl esters were determined by comparing their relative retention times with those of fatty acid methyl ester (FAME) standards. Quantification of FAMEs (peak area response) was accomplished using the TDAME C13 methyl ester internal standard. The peak area percentages were obtained by converting the peak area responses to concentration from which the percentage of individual PUFAs was determined using the following equation:
(Conc. of the PUFA of interest [g/L]/Total conc. of ω-3 + ω-6 [g/L]) × 100
The peak area percentages obtained were used for the calculation of the total ω-3 and ω-6 amounts and hence the ω-6/ω-3 ratio.
The reproducibility of the method was assessed through analysis of PUFAs prepared from the same blood serum sample and repeated in a sequence within the same day or of duplicate samples collected simultaneously from the subject and processed and analyzed four times (immediately, and after a 1–3 week storage period at –4 °C in the presence of BHT.) Calibration (n × 4) exhibited linearity and reproducibility with a CV of 4.24 and R2 = 1.
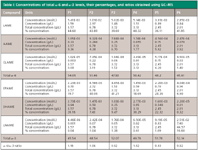
Postanalytical Processing: At the end of the data acquisition, customized reports of the splitless run were automatically generated. Calculations were based on the peak area of the PUFAs of interest, the peak area and concentration of well-known FAMEs that correspond in their retention time with the analyte, and the peak area of the internal standard. Table I shows the results obtained from the calculations.

Table I: Concentrations of total Ï-6 and Ï-3 levels, their percentages, and ratios obtained using GCâMS
Sample Preparation for Spectrophotometric Analysis: A 10-µL sample of serum was added to a 13 mm × 100 mm borosilicate disposable test tube. A 1-mL volume of 98% acetyl chloride (Acros) was added to the test tube. A 40-µL aliquot of perchloric acid (70% ACS reagent grade, GFS) was carefully added down the inside of the test tube and slowly introduced to the acetyl chloride and sample solution. The process must be slow and controlled to prevent the excessive splashing that can occur if the solution is added too quickly because of the reaction of acetyl chloride with water in the acid. The reaction starts when the sample solution first contacts the perchloric acid. The solution was shaken by hand for 20 s to allow for the release of the small amount of hydrochloric acid gas from the reaction test tube. The test tube was covered with a PTFE cap and centrifuged for 3 min at 3400 rpm. After centrifugation, precipitated proteins were separated, and the reagent solution was transferred to a 10-mm-pathlength optical glass cuvette that was fitted with a PTFE stopper. Absorbance spectra were measured after 15 min using an HP8452A Hewlett-Packard spectrophotometer. A 5-s integration time and 2-nm resolution were used to collect the spectra over the 350–550 nm range. The blank for each reaction was pure acetyl chloride. The reagent mixture of acetyl chloride with perchloric acid produced a slight color at 15 min. Due to the possibility of variability and small absorbance value, the combination of acetyl chloride and perchloric acid was not used as a blank (12,13). The results obtained were analyzed using chemometrics with the PLS2 algorithm.
Results and Discussion
Quantification of total ω-6, total ω-3, and ω-6/ω-3 ratios using GC–MS was performed as described in the experimental section. The results (n = 6) are shown in the Table I.
Table I shows the conversion of the peak areas obtained from GC–MS analysis into concentration in grams per liter and to percentage concentration. The total ω-6 and total ω-3 concentrations and the ω-6/ω-3 ratio were calculated using the total percentages of the PUFAs obtained from GC–MS analysis as explained earlier. The study therefore was able to convert the peak area percentages obtained from GC–MS analysis to concentration percentages that cannot be altered even when the peak areas integrated are increased or decreased. This approach makes it possible for GC–MS quantitative measurements to be compared with quantitative measurements performed using other instruments. However, the process of analysis and calculations involved in quantification are tedious and cannot be done in one step. More research is necessary to develop analytical methods that can quantify PUFAS in a single step.
Analysis of Spectrophotometric Data: The data obtained using spectrophotometry was analyzed using the PLS2 algorithm. Table I shows the comparison of results obtained from GC–MS analysis and the PLS2 analysis.

Table II: Comparison of data obtained using spectrophotometry and partial least squares (PLS2) analysis (350â550 nm) with data obtained using GGâMS analysis
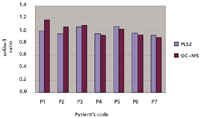
The results obtained with GC–MS were compared with the results obtained by analyzing the same serum sample with spectrophotometry and the PLS2 algorithm. Table II lists the total omega ω-6 and ω-3 levels and their ratios obtained using GC–MS and spectrophotometry. It was noted that the ω-6 and ω-3 total concentration and the ω-6/ω-3 ratios obtained using GC–MS analysis were substantially identical to those obtained using spectrophotometry with partial least squares (PLS2 chemometric) analysis. These results are further supported by Figure 1, which shows the ω-6/ω-3 ratio obtained from GC–MS and spectrophotometry (PLS2) analysis. The samples from patients 1 and 2 showed higher percentages that may have resulted from sample preparation error.

Figure 1: Comparison of Ï-6/Ï-3 ratios obtained from GCâMS and spectrophotometry (PLS2) analysis.
Limiting Factors
Long storage periods, resulting from a backlog of samples to be analyzed, can result in changes in the profiles of the polyunsaturated fats, because these are temperature- and oxygen-sensitive compounds (9). Careful storage under nitrogen gas and at –80 °C will minimize these changes. Degradation and loss may also be caused by the sample preparation steps in which the sample is processed and heated for 1 h. The throughput for analyses of these compounds can be a limiting factor in sample turnover, causing analyses in many cases to take months or even years to be completed. GC–MS analyses are time consuming, laborious, and expensive (9). The spectrophotometric analysis has shortcomings as well, in that it is limited to a certain concentration range; if the concentration of the analyte is below a threshold of 10–3 the PLS2 logarithm gives the concentration of the analyte as zero. Conversely, GC–MS was able to quantify the analytes even at very low concentrations.
More research on methods that can be used to analyze and quantify PUFAs in a single step using GC–MS is necessary.
Conclusions
This study demonstrates that GC–MS can be used successfully for quantitative analysis of total ω-6 and ω-3 levels and ω-6/ω-3 ratios as shown in Table I. Human serum analysis using the GC–MS method and the spectrophotometric method with PLS2 analysis yielded comparable results for total ω-6 and ω-3 levels and ω-6/ω-3 ratios, and the GC–MS results had the minimum percentage error. A Student's t-test analysis showed that there is no significant deference between the GC–MS and spectrophotometric analyses of total ω-6 and ω-3 levels and ω-6/ω-3 ratios (GC/MS tcal < tcri so we accept the null hypothesis, H0:µspectrophotometry=µGC/MS ω=0.05, tcal=-0.59, tcri=2.18, P=0.57).
This study is the first to apply the described GC–MS separation method to blood serum for the quantification of total ω-6 and ω-3 levels and ω-6/ω-3 ratios.
Acknowledgments
We sincerely acknowledge the receipt of serum samples provided by the medical staff of Hillcrest Medical Center in Tulsa, Oklahoma, and the financial support from the Oklahoma State University Technology Business Assessment Group (OSU-TBAG) for funding this research.
Mary W. Muriuki, Gerard G. Dumancas, Neil Purdie, and Lisa Reilly are with the Chemistry Department, Oklahoma State University, Stillwater Oklahoma. The authors can be contacted at marywm@okstate.edu.
References
(1) A.P. Simopoulos and L.G. Cleland, World Review of Nutrition and Dietetic 92, 0084–2230 (2003).
(2) M.B. Covington, American Family Physician 70(1), 133–140 (2004).
(3) E. Siguel, Circulation 97, 2580–2583 (1998).
(4) A.P. Simpoulos, "Importance of the ratio of Omega-6/Omega-3 Essential Fatty Acids: Evolutonary Aspects," in Omega-3 Essential Fatty Acid Ratio: The Scientific Evidence, A.P. Simopulos and L.G. Cleland, Eds. (Karger, Basel, 2003), pp. 1–22.
(5) A.L. Susan, R.H. Dallas,.M.B. Susan,. J.M. Mark, R. Piero, and P.M. Joseph, Molecular Genetic and Metabolism 73, 38–45 (2001).
(6) J.A. Nettleton, Omega-3 Fatty Acids and Health (Chapman and Hall, New York, 1995).
(7) D.F. Horrobin, Prog. Lipid Res. 31, 163–194 (1992).
(8) M.R. Lisa, PhD dissertation, "Development of a Spectrometric and Chemometric Method for the Direct Determination of Lipids in Serum and Synthetic Mixtures" (2006).
(9) A. Lenore, J. Nutr. 133, 925S–932S (2003).
(10) G.D. Gerard, M. Mary, P. Neil, and R. Lisa, Lipid Technology 21(5/6), 1–5 (2009).
(11) G. Lepage and C.C. Roy, J. Lipid Res. 27, 114–120 (1986).
(12) L. Tshugaev, A. Gastev, and I. Cholesterol, Ber. Dtsch. Chem. Ges. 42, 4631–4634 (1910).
(13) H.K. Hanel and H. Dam, Acta Chem. Scand. 9, 677–682 (1955).

Sorbonne Researchers Develop Miniaturized GC Detector for VOC Analysis
April 16th 2025A team of scientists from the Paris university developed and optimized MAVERIC, a miniaturized and autonomous gas chromatography (GC) system coupled to a nano-gravimetric detector (NGD) based on a NEMS (nano-electromechanical-system) resonator.
Miniaturized GC–MS Method for BVOC Analysis of Spanish Trees
April 16th 2025University of Valladolid scientists used a miniaturized method for analyzing biogenic volatile organic compounds (BVOCs) emitted by tree species, using headspace solid-phase microextraction coupled with gas chromatography and quadrupole time-of-flight mass spectrometry (HS-SPME-GC–QTOF-MS) has been developed.
Fundamentals of Benchtop GC–MS Data Analysis and Terminology
April 5th 2025In this installment, we will review the fundamental terminology and data analysis principles in benchtop GC–MS. We will compare the three modes of analysis—full scan, extracted ion chromatograms, and selected ion monitoring—and see how each is used for quantitative and quantitative analysis.


