Optimization of Asymmetrical Flow Field-Flow Fractionation
LCGC North America
This article illustrates how to choose the best experimental parameters for asymmetrical flow field-flow fractionation.
Asymmetrical flow field-flow fractionation (FFF) is a versatile technique for the size-based separation of macromolecules, molecular aggregates, colloids, and solid particles. The first experimental study on flow FFF by J.C. Giddings and colleagues (1) was published over 40 years ago, but for a long period the development and application of asymmetrical flow FFF (or its symmetrical variant) was largely limited to a small number of research laboratories. This was at least partly related to a lack of suitable ready-to-use instruments. In recent years, however, several reliable asymmetrical flow FFF instruments have become available on the market and the use of them in routine applications has become more widespread. Several recent literature reviews can be found on the application of FFF in various application fields (2–6).
In many laboratories it has been shown that asymmetrical flow FFF can be used as an alternative for size-exclusion chromatography (SEC), with a strongly extended molecular-size range. It is typically used for ultrahigh molecular weight (UHMW) polymeric materials such as starches and other carbohydrates (7,8), for the study of protein aggregation (9,11), or for the fractionation and characterization of synthetic and natural colloids (12,13). However, the separation principles and characteristics of asymmetrical flow FFF and SEC are quite different and optimization strategies and rules-of-thumb for SEC are not always applicable in asymmetrical flow FFF. In this study, we have tried to derive some rules for the optimization of asymmetrical flow FFF separations, starting from the first principles of the technique, and we have validated the outcome with experimental data on the separation of a number of model compounds (proteins).
The Principles of Asymmetrical Flow FFF
The principle and experimental set-up for flow FFF are shown schematically in Figure 1. The separation in flow FFF is performed with a carrier liquid pumped through a flat channel, formed by a spacer between two walls (although a hollow fiber can also be used). In the first (so-called symmetric) system both walls were porous, and a second pump was used that drove a flow of the same carrier liquid in the perpendicular direction, through both walls of the channel. Macromolecular sample components are retained in the channel by an ultrafiltration (UF) membrane on top of one of the porous walls. Later, Wahlund and Giddings (14) proposed a simplified instrumental system, with only one porous wall, for what was called asymmetrical flow FFF. In asymmetrical flow FFF the in-going flow (Fin) is split, with the help of flow regulators or an extra pump, in two parts. One part, the channel flow (FOUT), is flushed through the channel in the axial direction towards the detection side outlet. The other part of the in-going flow, the cross flow (FC), passes through the ultrafiltration membrane and the porous wall. The asymmetrical flow FFF set-up requires one pump or flow regulator less than a symmetric system. Commercial instruments use the asymmetrical flow FFF principle.
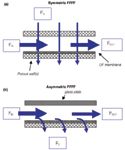
Figure 1: Experimental set-up for (a) symmetrical and (b) asymmetrical flow FFF.
The procedure for a separation by asymmetrical flow FFF includes different steps (see Figure 2). First, a specific volume of the sample solution is introduced in the channel. This can be done with the inlet flow or through an extra inlet port close to the carrier solution inlet. During and after sample injection a part of the in-going flow enters the channel from the inlet side, but most of the carrier liquid is pumped into the channel from the back end. In this way macromolecules or particles (anything that can not pass the ultrafiltration membrane) introduced into the channel are concentrated in a thin layer on top of the ultrafiltration membrane and focused in a thin band close to the inlet port.
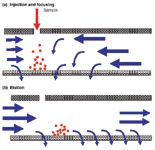
Figure 2: Flow regimes in asymmetrical flow FFF during (a) sample injection and focusing and (b) elution.
After this focusing step the elution can start. A valve is switched to change the flow regime. The carrier liquid now enters the channel from the inlet side, with a regulated part leaving the channel through the porous wall and the remainder flowing to the detector. The channel flow is laminar (that is, its velocity is high in the center of the channel and zero at the walls). Sample components, concentrated by the cross flow in a thin layer on top of the ultrafiltration membrane, are all flushed with the channel flow towards the detector, but the velocity of a sample band depends on the thickness of the layer into which the particles or macromolecules are concentrated: the smaller the layer thickness of a band, the lower its velocity in the axial direction. The layer thickness for a specific analyte, in the steady state situation after focusing, depends on the cross-flow velocity on the one hand and the molecular diffusion of the analyte on the other. Because the cross-flow velocity is an instrumental parameter, elution velocity and retention time differences between analytes are purely based on differences in diffusion constant and, by that, in molecular size.
Experimental
As model compounds β-lactoglobulin (with a MW of 35 kDa), bovine serum albumin (69 kDa), aldolase (160 kDa), and ferritin (440 kDa) were used, all obtained from Sigma-Aldrich (St. Louis, Missouri). The carrier solution was a 10 mM phosphate buffer at pH 7.4. An Agilent 1100 series degasser and a 1200 HPLC series isocratic pump (Santa Clara, California) were coupled with an Eclipse2 asymmetrical flow FFF separation system (Wyatt Technology Europe GmbH, Dernbach, Germany) to perform the fractionations. Separation channels with spacers of trapezoidal shape of different dimensions were used and a regenerated cellulose ultrafiltration membrane with a molar mass cut-off of 10 kDa. Samples were injected with a six-port valve with 10–500 μL loops. For detection the UV absorbance was measured at 280 nm with a Spectroflow 757 UV detector (Applied Biosystems, Foster City, California).
Sample Injection and Focusing
Analytes to be separated by asymmetrical flow FFF have typically low diffusion coefficients and, therefore, enough time should be taken to flush injection loops or autosampler tubing with carrier solution during injection, to transfer the analytes to the separation channel quantitatively. While the sample amount is limited to a certain maximum due to possible overloading effects (see below), the focusing step that is part of the asymmetrical flow FFF procedure eliminates any limitation for the sample volume. When samples are strongly diluted a large volume can be injected to improve the detectability. This is shown in Figure 3a. Here, a certain mass of the model proteins was injected, either as a small volume of a concentrated solution or as a larger volume of a diluted solution. The separation was not significantly affected. In applications with very dilute sample solutions, sample volumes of as large as 1 L have been introduced into a normal-size FFF channel (15).

Figure 3: (upper) Asymmetrical flow FFF separation of a protein standard mixture with different injection volumes: (a) 10-μL sample containing 500 μg/mL of each protein; (b) 200-μL of a 25 μg/mL sample. (lower) The effect of the focusing time in asymmetrical flow FFF; separation of a standard mixture of proteins after (a) 1 min focusing; (b) 5 min focusing.
The focusing time should be optimized for a specific application. When the time allowed for focusing is too short, the sample band in the channel before the elution starts is wider than necessary and the resolution obtained is below optimum. However, when the focusing is long, there is a risk of loss of low molecular weight material. This is illustrated in Figure 3b. The recovery of the 35 kDa protein β-lactoglobulin decreases at longer focusing time, even when in this experiment an ultrafiltration membrane was used with a nominal cut-off value of 10 kDa. The cut-off value of a membrane is an indication for the average pore size of it, but the membrane will contain pores with a wide size distribution. During focusing macromolecules may be lost through the largest pores or through pinholes in the membrane. In practice, the focusing is often found to be optimal when the channel volume has been "swept" 2–5 times with the cross flow.
Retention and Efficiency
The simplicity of the principle of retention in asymmetrical flow FFF, which relies only on liquid flows and molecular diffusion, makes it easy to predict the relation of the retention of compounds and their molecular size. With some approximations and simplifications of the original treatment (14), the elution time of a compound can be calculated as

where w is the height of the channel (the thickness of the spacer) and Di the diffusion coefficient of the component. D can be related to size through the well-known Stokes–Einstein formula. Equation 1 shows different crucial aspects of asymmetrical flow FFF separations:
- The elution order in asymmetrical flow FFF is opposite to that encountered in SEC: Small molecules or particles, with a high diffusion coefficient, elute first.
- The retention time of a specific analyte depends on the flow ratio (FC/FOUT). A particular compound can be given any desired retention time by choosing the appropriate flow ratio.
- Retention times do not depend on the length or width of the channel. With a thin spacer elution times will be shorter than with a thicker spacer (at the same flow ratio). Of course, for a fractionation not only the retention times of the analytes are of importance, but also the widths of the peaks obtained. From basic theory (see, for example, reference 16), a simplified formula can be derived for the standard deviation (in time units) σt of a peak of a monodisperse compound with sufficient retention:

where uc is the cross-flow velocity, the cross-flow rate divided by the area of the porous channel wall. A remarkable feature of this theoretical formula is that it only contains instrumental parameters. This implies that in a specific fractionation all (monodisperse) compounds are eluted ideally as peaks with the same width.
Although the elution time of a peak depends on the flow ratio (equation 1), the peak widths depend also on the magnitude of the (cross) flow (equation 2). For efficient separations the system should be run at flow rates as high as possible. This is illustrated in Figure 4. The model proteins are separated with different flow regimes, using different flow rates but the same flow ratio. The peaks are eluted at approximately the same time in the different runs, but the resolution between the peaks increases with increasing (absolute) flow rates.
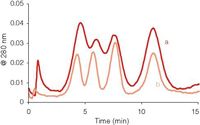
Figure 4: Effect of the flow rates on the separation efficiency in asymmetrical flow FFF. Separation of model proteins with a flow ratio of 2.5, with (a) FC = 1.5, FOUT = 0.6 mL/min; (b) FC = 2.5, FOUT = 1.0 mL/min.
The pressure accompanying a high cross-flow velocity will be a limiting factor in practice. As will be shown below, the detectability of the separated compounds is another limiting factor.
Because peak widths do not increase with retention time in a specific fractionation, the efficiency of an asymmetrical flow FFF separation can not be quantified with a single plate number. Optimization approaches as used normally in chromatography (for example, to obtain the highest number of plates per time unit, or to obtain a certain plate number in the shortest time) cannot be used in asymmetrical flow FFF. Therefore, we propose to use another parameter for optimization, TREQ: the minimum time required to get baseline separation between peaks of compounds differing in MW by a factor of 2. A TREQ value then indicates the time required to separate a protein from its dimer, or a 1 MDa narrow polymer standard from a 2 MDa standard. Taking a resolution value of 1.5 as the minimum for baseline separation and assuming that diffusion coefficients are inversely proportional to the square root of the molecular mass of macromolecules (which is a reasonable approximation for, for example, globular proteins or random-coil linear polymers), a surprisingly simple equation can be derived from basic theory that shows the way for the optimization of asymmetrical flow FFF separations:

where D1 is the diffusion coefficient of the first eluting compound (the monomer, or the 1 MDa standard in the examples above). The numerical factor in the equation includes the assumed ratio of the diffusion constants and the desired value for the resolution.
Some clear conclusions can be drawn from equation 3:
- For fast separations the highest possible cross-flow velocity should be applied. The channel flow should then be adapted to obtain the desired resolution (between monodisperse analytes) or selectivity (for samples with a broad distribution).
- Two high molecular weight compounds, having low diffusion coefficients, can be separated in a shorter time than two low molecular weight analytes.
- The channel size (length, width, thickness of the spacer) is irrelevant for the separation speed. Of course, with a larger channel a higher cross-flow rate is required to obtain the same cross-flow velocity.
The cross-flow velocity that can be applied will be restricted due to experimental difficulties. At high cross flows a channel may start to leak, low molecular weight material may be lost through pinholes in the membrane, or sample components may be forced into the pores of the membrane and be irreversibly adsorbed. Such limitations will have to be studied for any specific application.
Overloading and Dilution
When the sample is introduced into the channel and macromolecular analytes are focused in a thin layer on the accumulation wall in a narrow band close to the inlet, a considerable concentration of the sample components takes place before elution starts. In a typical asymmetrical flow FFF experiment an analyte moves through the channel as a band with a volume in the order of 1–2 μL. Therefore, even when the original sample solution can be regarded as "diluted," during the asymmetrical flow FFF process, the interaction between analyte molecules may start to play a role. In the highly concentrated bands proteins may spontaneously start to form dimers or aggregates (17), linear polymers can get entangled, and with charged compounds electrostatic interaction becomes important.
When the concentration of an analyte in its band becomes too high, such intermolecular interactions start to affect the elution behavior, and peaks become wider and distorted. These overloading phenomena are most pronounced with polyelectrolytes (see, for example, reference 18) and ultrahigh molecular weight compounds (19), but as Figure 5 shows it can also occur in protein separations. Peak times are shifted and peak widths have increased. The maximum amount of sample (mass, not volume) that can be introduced in the channel before overloading starts to be important depends on the flow regime. With a high cross flow the analytes are more concentrated on top of the ultrafiltration membrane and overloading is more readily observed.
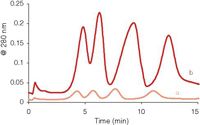
Figure 5: Overloading in asymmetrical flow FFF. Injected amounts of the model proteins: (a) 5 μg, (b) 50 μg.
The obvious thing to do when a separation is jeopardized by overloading is to inject less sample. However, the detectability may then become problematic. It should be realized that the concentrated analyte bands that travel through the channel are strongly diluted once they are eluted from the channel toward the detector. The thin layer of solution containing the analytes is merged with the bulk channel flow at the exit port of the channel. We propose to use the dilution factor (DILF) as a parameter to describe these concentrations and dilution processes in the optimization of an asymmetrical flow FFF separation. DILF can then be defined as the ratio between the local concentration c* of an analyte in the thin band moving in the channel and its concentration in the detector, cdet:

A high DILF value means that one has to choose between two evils. A relatively large amount of sample can be injected, which results in a high true analyte concentration during elution (c*), with the accompanying risk of overloading, or a low amount is injected and the detectability (cdet) will be poor. From basic theory (see, for example, reference 18) a simple equation can be derived that describes the influence of instrument and analyte parameters on the dilution factor:

Equation 5 gives some clear indications for the optimization of an asymmetrical flow FFF separation:
- High cross flows, as desired for fast separations, will result in a strong dilution and may cause detection problems.
- The use of a thinner channel (spacer) will strongly decrease dilution.
- High molecular weight (low D) compounds are the most strongly diluted.
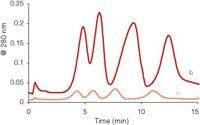
The effect of the spacer thickness on dilution is shown in Figure 6. The model proteins were separated using different spacers in the channel, while the other experimental parameters (flow rates, amount of sample) were kept the same. When the 350-μm spacer is replaced by a 250-μm-thick one, elution times are shorter (see equation 1), and the resolution between the peaks deteriorates. However, the dilution with the 250 μm spacer is less and sensitivity is improved. (The last peak in the chromatogram of Figure 6b can be attributed to the dimer of ferritin; it was not eluted within the data aquisition time window in Figure 6a.)
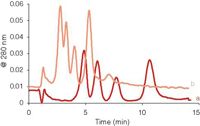
Figure 6: Effect of the spacer thickness on elution: (a) 350 μm, (b) 250 μm spacer. Other experimental conditions are the same.
Cross-Flow Programming
In many applications of asymmetrical flow FFF the components of the sample that have to be separated have a wide range of molecular sizes. For such samples it is difficult to find an optimal cross-flow rate. On the one hand a high cross flow is required to obtain enough retention and selectivity for the low molecular weight sample components. On the other hand, with a high cross-flow rate the high molecular weight sample components will be eluted very late and very strongly diluted. A valuable tool for the asymmetrical flow FFF separation of samples with a high polydispersity is cross-flow programming. For this, the cross flow is gradually decreased during elution of the sample components. Different flow programs can be used in asymmetrical flow FFF (20). Some programs are illustrated in Figure 7a. In the linear decay mode, the cross flow is first kept constant for a certain time and next slowly decreased to zero in a linear way. In the time-delayed exponential (TDE) decay mode, the cross flow is also kept constant first for a certain time and then is decreased exponentially, ideally with a time constant equal to the delay time (the time the cross flow was kept constant). Figure 7b shows the effect of flow programming on the expected elution time for globular proteins. It shows that with a constant cross flow the retention time of high molecular weight compounds becomes impractically long. The size range that can be separated in a reasonable time is clearly wider with the linear decay programming mode. However, at some point (when the cross flow is reduced to zero) all further selectivity is lost. The TDE mode results in a linear relation between the elution time and log MW, with — in theory — no limit on the high side of the size range. An illustration of the power of flow programming was shown in previous work in our laboratory, on the characterization of β-lactoglobulin aggregates (9). The aggregates, that could have molecular weights well over 10 MDa, had to be analyzed together with the remaining monomer (35 kDa). With a constant cross flow the aggregates were eluted as a very broad, difficult to quantify peak; with TDE programming the peak was characterized much easier (see Figure 8).

Figure 7: Cross-flow programming in asymmetrical flow FFF, with (a) constant cross flow, (b) linear decay, and (c) TDE program. (upper) Flow program. (lower) Predicted retention of proteins as a function of their molecular weight.
Conclusions
Theoretical considerations and experimental results show that the optimization of an asymmetrical flow FFF separation always involves finding the most suitable compromise between separation speed (as quantified with the TREQ value) and detectability (as manifest in the DILF value). The crucial experimental parameter for optimization is the cross-flow velocity. The TREQ and DILF parameters are affected in opposite directions when the cross-flow velocity is changed.
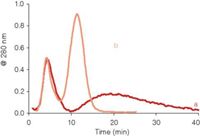
Figure 8: Asymmetrical flow FFF separation of β-lactoglobulin aggregates with (a) constant cross-flow programming and (b) TDE programming.
When speed is the main issue, the cross-flow velocity should be chosen as high as allowed by practical limitations (leakage, loss of recovery, and adsorption problems). The channel flow can then be chosen to give the optimal compromise between speed and resolution. Of course, with a high cross flow a correspondingly high channel flow will be required for a fast separation. The channel dimensions are not relevant for the separation speed that can be obtained.
When detection sensitivity is an issue and overloading phenomena prohibit injection of simply more sample, it may be necessary to restrict the cross-flow velocity to decrease the dilution of the sample components. The dilution can be reduced, without sacrificing speed, by the use of a thinner spacer for the channel. When the available sample amount is not limited, length and width of the channel are also not relevant for the sensitivity that can be obtained. However, in cases when there is only a small amount of sample available (for example, in biomedical applications), using a smaller channel will improve the detectability. Miniaturization of the asymmetrical flow FFF channel will also help to reduce the consumption of carrier liquid.
Furthermore, the power of cross-flow programming has been made clear in many practical applications. Flow programming makes it possible to fractionate samples with very wide distributions of molecular mass or particle size.
Rashid N. Qureshi is a PhD student in the Polymer-Analysis Group of the van't Hoff Institute for Molecular Sciences at the University of Amsterdam (Amsterdam, Netherlands). His area of research is in the development and application of flow field-flow fractionation for the characterization and analysis of biomacromolecules.
Wim Th. Kok is a senior lecturer in the same research group. He teaches courses in general analytical chemistry, separation sciences, and statistics. His research is focused on the development and application of separation methods (LC, CE, and FFF), with an emphasis on miniaturization and on methods for high-MW compounds.
References
(1) J.C. Giddings, F.J.F. Yang, and M.N. Myers, Science 193, 1244–1245 (1976).
(2) S.K.R. Williams and D. Lee, Journal of Separation Science 29, 1720–1732 (2006).
(3) J. Chmelik, Proteomics 7, 2719–2728 (2007).
(4) B. Roda et al., Analytica Chimica Acta 635, 132–143 (2009).
(5) F.A. Messaud et al., Progress in Polymer Science 34, 351–368 (2009).
(6) S. Cao, J. Pollastrini, and Y.J. Jiang, Current Pharmaceutical Biotechnology 10, 382–390 (2009).
(7) G. Modig, P.O. Nilsson, and K.G. Wahlund, Starch-Starke 58, 55–65 (2006).
(8) W.J. Kim et al., Bulletin of the Korean Chemical Society 28, 2489–2492 (2007).
(9) R.H. Zhu et al., Analytical Chemistry 77, 4581–4586 (2005).
(10) A. Samontha et al., Journal of Agricultural and Food Chemistry 56, 8809–8814 (2008).
(11) P. Reschiglian and M. H. Moon, Journal of Proteomics 71, 265–276 (2008).
(12) M. Bouby, H. Geckeis, and F.W. Geyer, Analytical and Bioanalytical Chemistry 392, 1447–1457 (2008).
(13) S. Dubascoux et al., Journal of Chromatography A 1206, 160–165 (2008).
(14) K.G. Wahlund and J.C. Giddings Analytical Chemistry, 59, 1332–1339 (1987).
(15) H. Lee et al., Analytical Chemistry 70, 2495–2503 (1998).
(16) A. Litzen and K.G. Wahlund, Analytical Chemistry 63, 1001–1007 (1991).
(17) V. Levi and F.L.G. Flecha, Biochimica Et Biophysica Acta-Proteins and Proteomics 1599, 141–148 (2002).
(18) M. Van Bruijnsvoort, R. Tijssen, and W.T. Kok, Journal of Polymer Science Part B-Polymer Physics 39, 1756–1765 (2001).
(19) C. Arfvidsson and K.G. Wahlund, Journal of Chromatography A 1011, 99–109 (2003).
(20) K.G. Wahlund et al., Analytical Chemistry 58, 573–578 (1986).

Retaining Talent in Field-Flow Fractionation: An Initiative
The authors present their motivation for establishing the Young Scientists of FFF (YSFFF) initiative within the FFF community.
Developments in Field‑Flow Fractionation Coupled to Light Scattering
December 8th 2020Field-flow fractionation (FFF) coupled to light scattering is a powerful method to separate and characterize nanoparticles, proteins, and polymers from a few nanometres to a few micrometres. The technique is one of the few that can cover the full size range of nanomaterials and provide high-resolution size distributions and additional characterization. New developments in FFF enhance performance and productivity.
Field-Flow Fractionation: Virtual Optimization for Versatile Separation Methods
August 8th 2017Flow-field flow fractionation (flow-FFF) offers highly versatile separations for the analysis of complex fluids, covering a size range of macromolecules and particles from 1 nm to 10,000 nm. However, flow-FFF is often perceived as a difficult technique to learn because of the multiple parameters available for adjustment. Recent advances in software for simulating flow-FFF overcome this obstacle, enabling the virtual optimization of flow-FFF methods and opening up the power of flow-FFF separations to non-experts. An added benefit is the ability to easily analyze particle size distributions by elution time from first principles.


