The Direct Analysis of Diquat and Paraquat in Lake Water Samples by per Aqueous Liquid Chromatography
LCGC North America
The authors discuss an LC method for the direct analysis of diquat and paraquat in lake water.
Diquat and paraquat are used throughout the world as effective herbicides. These compounds are the active ingredients in a range of formulations aimed at terrestrial weeds and crops, as well as aquatic weeds. The ever-increasing need to control invasive aquatic weeds in the United States will increase the demand for the use of herbicides such as diquat, which can quickly and effectively control weeds in water. The popularity of these herbicides is attributed to the efficacy, speed, and localization with which they act: These herbicides are effective within days of application, act only upon the parts of the plant they are in contact with, and deactivate upon contact with soil.
A variety of scientific disciplines use high performance liquid chromatography coupled to mass spectrometry (HPLC–MS) with methodology for the analysis of paraquat and diquat (1–17). The most common configuration uses an electrospray ionization (ESI) interface. The fields typically interested in pesticide determination are environmental monitoring, drinking water quality, and food safety where soil (1), produce (2), and water (3–7) are among the matrices of interest. The LD50 levels for paraquat and diquat are, according to World Health Organization data, 150 mg/kg and 231 mg/kg, respectively (8). In the United States, paraquat is a restricted use pesticide (RUP) that can be applied only by or under the direction of a trained individual. The elevated toxicity of paraquat coupled with availability in concentrated solutions led to it being used as an agent for suicide (9,10). Diquat, although of lower toxicity, has also been linked to intoxication (11) and fatality following ingestion (12). Therefore, clinical chemistry and forensic toxicology also use methodology for these compounds in matrices such as whole blood (13), serum (14,15), and urine (15). In recent years, neuroscientists have been studying paraquat exposure as a possible contributing factor to the onset of Parkinson's disease and a method for extracting and analyzing paraquat from brain tissue has been developed (16).
The per aqueous liquid chromatography (PALC) method was defined in 2009 by dos Santos Pereira and colleagues (17), and there are only four other publications that specifically refer to the technique (17–19), including this article. In PALC, the separation conditions are a silica stationary phase with a mobile phase containing a high proportion of water. Hydrophilic interaction chromatography (HILIC), for which several silica columns are marketed, generally uses a high proportion of organic solvent in the mobile phase. HILIC has the advantage of eluting compounds of a polar nature in an eluent rich in organic solvent that is highly amenable to LC–ESI-MS (20,21). However, the advantages of HILIC are lost with compounds that have high water solubility and do not easily transfer to the organic phase in extraction. For these compounds, such as paraquat and diquat, PALC presents a very interesting alternative. The significance of the dos Santos Pereira publication is that it definitively shows that the chromatographic parameters of the selected analytes were enhanced using high-water-content mobile phases. Excellent peak shape and separation was observed for amino acids, nucleo-bases, catecholamines, and a standard mixture containing acidic and basic compounds (17).
The retention of analytes on silica columns with high-water-content mobile phases has been investigated in the past (22,23). However, in these studies, high water content did not produce optimal results for the analytes of interest. In Dong and Wang's study (23) on epirubicin and related analogues, a high proportion of organic solvent produced better resolution and peak shape. In the investigation by Bidlingmeyer (22) on amine analytes, high amounts of water in the mobile phase were not investigated due to the excessive retention and poor peak shape of the compounds. There is a long history of the use of silica columns in HPLC. It is beyond the scope of this communication to review previous publications that may have used the conditions now defined as PALC. However, it is important to mention the work by Pesek and colleagues (24) where silica hydride surfaces were used with water rich mobile phases in aqueous normal phase.
The trend observed for retention time with mobile phase composition in PALC is a U-shaped curve. The retention time decreases as the proportion of organic solvent decreases to a minimum, after which retention increases with increasing amounts of water or buffer. The investigation by McCalley and Neue (25) showed that for both Atlantis (Waters Corp., Milford, Massachusetts) and HALO (Advanced Materials Technology, Wilmington, Delaware) columns in an acetonitrile–water mobile phase, the retention time minimum occurred at about 30% (v/v) water for the unretained compounds, benzene and toluene. In studies with acetonitrile–water mobile phases using HALO columns of identical dimensions, the retention factor minimum was at 15% (v/v) water for pyridine (18) and 50% (v/v) acetonitrile–water for caffeine (19). In the study by dos Santos Pereira and colleagues (17), a selection of amino acids with acetonitrile–ammonium formate buffer (pH 3) had a retention time increase at about 90% buffer. The U-shaped retention plot indicates that analytes retained on a silica column with a predominantly aqueous environment follow the PALC mechanism whereas those in an organic-rich mobile phase follow a HILIC mechanism. A comparison of the adsorption mechanisms of pyridine in both HILIC and PALC conditions (18) indicated that, in the PALC region, the presence of active adsorption sites in the heterogeneous silica surface was the dominant factor in retention whereas the hydrophobic siloxane groups on the silica surface were found to have a contribution to retention of less than 10%. The sites that adsorb the pyridine molecule are proposed by Gritti and colleagues (18) to be hydrophobic silica micropores.
Experimental
Chemicals and Materials: Paraquat and diquat standards were obtained from the United States Environmental Protection Agency National Pesticide Repository (Fort Meade, Maryland). HPLC-grade acetonitrile and formic acid were obtained from JT Baker, Mallinckrodt Baker (Philipsburg, New Jersey). Deionized water was obtained in-house using a Millipore ELIX and Element A10 purification system (Bedford, Massachusetts). Ammonium formate was obtained from Fluka (Zurich, Switzerland). Buffer solutions of ammonium formate were made by adjusting a solution of the buffer salt in water with formic acid to the required pH of 3.70. The lake water was treated with a solution of Reward herbicide (Syngenta Crop Protection, Inc., Greensboro, North Carolina), which contains diquat at 37.5%. All solutions containing the herbicides were in polypropylene containers, including the use of polypropylene HPLC vials. The samples from the lake water study were immediately frozen in liquid nitrogen after collection. On arrival in the laboratory, the water samples were equilibrated to room temperature, filtered through a 45-µm syringe filter, and analyzed. In cases where the samples could not be immediately analyzed, they were stored in the freezer.
Instrumentation: The LC–MS-MS data were collected using an Agilent 1200 HPLC system (Palo Alto, California) coupled with a degasser (G1379B), binary pump (G1312B), column heater (G1316B), and autosampler (G1367C), and a thermostat (G1330B). The HPLC system was attached to an LTQ linear ion-trap mass spectrometer with an ESI interface used with positive ionization (Thermo Fisher Scientific, Waltham, Massachusetts). Because even volatile buffers can cause material build-up on the outside of the source, we limited the amount of buffer entering the source to the retention windows of interest.
HPLC Column and HPLC Method Conditions: The separations were performed using 150 mm × 2.1 mm, 3-µm dp Waters Atlantis HILIC silica columns. Two of these columns were used in this study and both columns were from the same lot. Before using the columns, attention was paid to the column handling instructions and the columns were washed before any analysis was performed.
Method Details: The study of retention time response to mobile phase composition was performed isocratically. The mobile phase consisted of 20 mm or 50 mM ammonium formate buffer (pH 3.70) with acetonitrile. The column temperature was 30 °C, the injection volume was 20 µL, and the flow rate was 0.4 mL/min. The mass spectrometer was set up with three scans. The initial scan was a full scan positive ion, the second scan was a selected reaction monitoring mode for the diquat ion at [M2+ –H+ ]+ at m/z 183, and the third scan was for the paraquat [M2+ –H+ ]+ ion at m/z 185. Identification was confirmed by monitoring the product ions of m/z 157 and m/z 106 for the diquat [M2+ –H+ ]+ ion and m/z 171 for the paraquat ion. The sheath, sweep, and auxiliary gas values were 30, 10, and 10 arbitrary units, respectively, and the capillary temperature was 300 °C. The isolation width used for the ions was 3.0 m/z and the normalized collision energy was 35.
The method developed for the lake water study used the following optimized conditions: The mobile phase consisted of 20 mM ammonium formate adjusted to pH 3.70 (mobile phase A) in addition to acetonitrile (mobile phase B). The gradient conditions were 0–1 min, 55% A; 1–3 min, 55–75% A; 3–8 min, 75% A; 8.5 min, 55% A; and 20 min, 55% A. The flow rate was 0.4 mL/min and a column temperature of 30 °C was used. The injection volume was 20 µL. For the mass spectrometer, the initial scan was a positive ion full scan. Because it was unclear what potential interferents could be present in the lake water, the second scan was a selected reaction monitoring mode for diquat at m/z 183.5, which trapped both the [M2+ –H+ ]+ ion at m/z 183 and the [M]+ ion at m/z 184. Identification was confirmed by monitoring the product ions of m/z 157, m/z 106, and m/z 169 for the diquat [M2+ –H+ ]+ ion. For paraquat, the MS conditions were a precursor ion of [M2+ –H+ ]+ at m/z 185 and a product ion of m/z 171. The sheath, sweep, and auxiliary gas values for the gradient method were 30, 10, and 10 arbitrary units, respectively, and the capillary temperature was 250 °C. The isolation width used for the ions was 3.0 m/z and the normalized collision energy was 35.
Results and Discussion
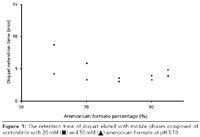
Figure 1 shows the retention times obtained for the analysis of diquat using 60% to 95% concentrations of 20 mM and 50 mM ammonium formate buffer. The plotted retention times are average values, averaged over 6–10 consecutive injections. The data in this figure were all collected using one column with one batch of buffer for each concentration to ensure straightforward comparison. The concentration of the diquat standard was 100 ppb in water. Figure 1 shows that the retention time minimum for diquat occurred at about 80% buffer. The higher concentration of buffer reduced the retention time of the compounds marginally, which is indicative of ion-exchange behavior.
The effect of the concentration of the buffer was investigated by using 20 mM and 50 mM ammonium formate buffers in an isocratic study; the results are shown in Figure 2. The selection of buffer at pH 3.70 was initially made due to the prevalence of the use of this pH value for the analysis of these compounds. Because good performance was attained, pH was not further investigated as a parameter. In Figure 2, it can be seen from the isocratic elution of paraquat and diquat that the higher concentration of buffer enhanced the peak shape and marginally reduced the retention times. For paraquat, however, the peak shape improvement is far more dramatic than for diquat.
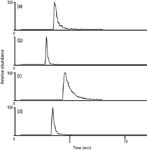
Figure 2: Chromatograms of diquat and paraquat with mobile phase composition of 80% buffer and 20% acetonitrile. The sample was 100 ppb of diquat and paraquat in water. (a) Chromatogram of the sum of ions m/z 106 and 157 produced by fragmentation of the m/z 183 ion (diquat), eluted with 20 mM ammonium formate at pH 3.70. (b) Chromatogram of the sum of ions m/z 106 and 157 produced by fragmentation of the m/z 183 ion (diquat), eluted with 50 mM ammonium formate at pH 3.70. (c) Chromatogram of the ion m/z 171 produced by fragmentation of the m/z 185 ion (paraquat), eluted with 20 mM ammonium formate at pH 3.70. (d) Chromatogram of the ion m/z 171 produced by fragmentation of the m/z 185 ion (paraquat), eluted with 50 mM ammonium formate at pH 3.70.
An optimized method to monitor diquat in lake water following application of Reward herbicide solution was developed and is listed in the method details section. The aim of the method was to quantitatively monitor diquat in the lake water following application, until a timepoint was reached where diquat could no longer be detected. Samples of lake water were taken at multiple sites across the lake, and, for some specific sites, surface water and lake bottom water samples were collected. Water sample collection occurred before application of the herbicide and for many days following application of the solution. To ascertain method performance, diquat and paraquat were spiked into samples collected from the surface and at depth for one particular lake site (n = 2) at 10, 50, and 500 ppb before application of the herbicide. The recoveries for these samples ranged from 79.5% to 106.5% for diquat and 97.1% to 106.7% for paraquat. The method had a limit of detection of 2 ppb and a limit of quantitation of 6 ppb for diquat. The linearity of the method was an R2 value of 0.9963 for diquat. The recorded full scan data matched the MS-MS data very well, but the MS-MS data monitored ions unique to diquat and therefore provided a higher level of identification. Figure 3 shows the chromatograms of both a standard and an authentic lake water sample that contain the herbicide diquat; the lake water sample was obtained the day after application of the Reward solution. The standard was at the level of 250 ppb and the lake water sample was determined to be at 309 ppb. The fragmentation of the m/z 183.5 ion shows the same fragment ions present in the same proportion and confirms the peak identity as diquat. The short run time of this method allowed us to have a high throughput of samples, which was necessary to perform analysis of the water samples collected from multiple sites across the lake each day after collection for many days. Figure 4 shows the decrease of diquat concentration over a number of days at one particular site in the lake following the application of the Reward solution.
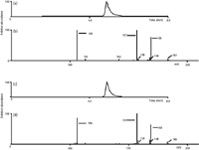
Figure 3: Chromatograms and mass spectra of lake water where the Reward herbicide solution had been applied. Chromatograms were eluted with the gradient method documented in the method details section. (a) Chromatogram of the sum of ions m/z 106 and 157 produced by fragmentation of the m/z 183.5 in a standard of 250 ppb in water. (b) Corresponding mass spectrum from the diquat peak in (a). (c) Chromatogram of the sum of ions m/z 106 and 157 produced by fragmentation of the m/z 183.5 in a lake water sample determined to be 309 ppb in diquat. (d) Corresponding mass spectrum from the diquat peak in (c).
Conclusion
The chemical characteristics of paraquat and diquat make them particularly difficult to analyze. However, the widespread use of these compounds coupled with the elevated toxicity of them makes it even more important to have methods of analysis. In this study we found that the herbicides could be analyzed effectively using a silica column with a buffered mobile phase. The U-shaped curve that results from the response of retention time to mobile phase composition and the enhanced response at high concentrations of buffer was indicative of a PALC mechanism. The methods developed here were sensitive, amenable to MS detection, required only syringe filtering the samples before analysis, and had run times of less than 10 min. Future work will include exploring the analysis of these herbicides on a superficially porous silica stationary phase, expanding the study to include other beverages and food matrices, and studying additional buffer concentrations.
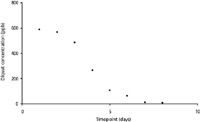
Figure 4: Graph of diquat concentration monitored at one site in the lake over time.
Acknowledgments
We thank the FDA Food Emergency Response Network (FERN) Chemistry Cooperative Agreement Program (cCAP) for financial support.
References
(1) M. Pateiro-Moure, E. Martínez-Carballo, M. Arias-Estévez, and J. Simal-Gándara, J. Chromatogr. A, 1196-1197, 110–116 (2008).
(2) M.A. Aramendía, V. Borau, F. Lafont, A. Marinas, J.M. Marinas, J.M. Moreno, J.M. Porras, and F.J. Urbano, Food Chemistry 97, 181–188 (2006).
(3) V.Y. Taguchi, S.W.D. Jenkins, P.W. Crozier, and D.T. Wang, J. Am. Soc. Mass Spectrom. 9, 830–839 (1998).
(4) M. Takino, S. Daishima, and K. Yamaguchi, Analytical Science 16, 707–711 (2000).
(5) J.C. Marr and J.B. King, Rapid Commun. Mass Spectrom. 11, 479–483 (1997).
(6) J.L. Martínez Vidal, A. Belmonte Vega, F.J. Sánchez López, and A. Garrido Frenich, J. Chromatogr. A 1050, 179–184 (2004).
(7) O. Núñez, E. Moyano, and M.T. Galceran, Anal. Chim Acta 525, 183–190 (2004).
(8) The WHO recommended classification of pesticides by hazard and guidelines to classification 2009.
(9) S.K.Lee, K. Ameno, S.W. In, J.Y. Yang, K.U. Kim, K.S. Koo, Y.C. Yoo, S. Ameno, and I. Ijiri, Int. J. Legal. Med. 112, 198–200 (1999).
(10) N. Tabata, M. Morita, S. Mimasaka, M. Funayama, T. Hagiwara, and M. Abe, Forensic Sci. Intl. 100, 117–126 (1999).
(11) L.G. McCarthy and C.P. Speth, Annals of Emergency Medicine 12(6), 394–396 (1983).
(12) D.M. Schmidt, J. Neale, and K.R. Olson, Clinical Toxicology 37(7), 881–884 (1999).
(13) M.M. Ariffin and R.A. Anderson, J. Chromatogr. B 842, 91–97 (2006).
(14) K-C. Wang, S-M. Chen, J-F. Hsu, S-G. Cheng, and C-K. Lee, J. Chromatogr. B 876, 211–218 (2008).
(15) C. Fuke, K. Ameno, S. Ameno, H. Kinoshita, and I. Ijiri, Arch. Toxicol. 70, 504–507 (1996).
(16) B. Winnik, D.B. Barr, M. Thirucelvam, M.A. Montesano, E.K. Richfield, and B. Buckley, Anal. Bioanal. Chem. 395, 195–201 (2009).
(17) A. dos Santos Pereira, F. David, G. Vanhoenacker, and P. Sandra, J. Sep. Sci. 32, 2001–2007 (2009).
(18) F. Gritti, A. dos Santos Pereira, P. Sandra, and G. Guiochon, J. Chromatogr. A 1216, 8496–8504 (2009).
(19) F. Gritti, A. dos Santos Pereira, P. Sandra, and G. Guiochon, J. Chromatogr. A 1217, 683–688 (2010).
(20) H.P. Nguyen and K.A. Schug, J. Sep. Sci. 31, 1465–1480 (2008).
(21) R. Kostiainen and T.J. Kauppila, J. Chromatogr. A 1216, 685–699 (2009).
(22) B.A. Bidlingmeyer, J.K. Del Rios, and J. Korpi, Anal. Chem. 54, 442–447 (1982).
(23) L. Dong and J. Huang, Chromatographia 65, 519–526 (2007).
(24) J.J. Pesek and M.T. Matyska, J.Sep.Sci. 28, 1845–1854 (2005).
(25) D.V. McCalley and U.D. Neue, J. Chromatogr. A 1192, 225–229 (2008).

Common Challenges in Nitrosamine Analysis: An LCGC International Peer Exchange
April 15th 2025A recent roundtable discussion featuring Aloka Srinivasan of Raaha, Mayank Bhanti of the United States Pharmacopeia (USP), and Amber Burch of Purisys discussed the challenges surrounding nitrosamine analysis in pharmaceuticals.
Extracting Estrogenic Hormones Using Rotating Disk and Modified Clays
April 14th 2025University of Caldas and University of Chile researchers extracted estrogenic hormones from wastewater samples using rotating disk sorption extraction. After extraction, the concentrated analytes were measured using liquid chromatography coupled with photodiode array detection (HPLC-PDA).


