Profiling Nonionic Surfactants Applied in Pharmaceutical Formulations by Using Comprehensive Two-Dimensional LC with ELSD and MS Detection
LCGC North America
Comprehensive 2D-LC using HILIC and reversed-phase LC is a robust tool to characterize nonionic ethoxylated surfactants in pharmaceutical formulations.
Comprehensive two-dimensional liquid chromatography (2D-LC) was used for detailed profiling of various nonionic ethoxylated surfactants applied in pharmaceutical formulations. Hydrophilic-interaction chromatography (HILIC) and reversed-phase liquid chromatography (LC) were used as the first and second dimensions, respectively. Detection was performed with evaporative light-scattering detection (ELSD) for general profiling and with single-quadrupole mass spectrometry (MS) for structure elucidation of individual peaks and for class-type confirmation of peak-groups.
Nonionic ethoxylated oligomers and polymers are extensively used as surfactants, emulsifiers, wetting agents, solubilizers, and dispersants in various fields. They are applied as additives in agricultural and food products, personal care products, and in pharmaceutical and biopharmaceutical products and intermediates. For the latter applications, polysorbates (Tween), fatty alcohol ethoxylates (Brij), and polyethoxylated castor oil (Kolliphor) are widely applied because of their low toxicity. As an example, polysorbates are added in biopharmaceutical formulations where they act as stabilizing agents for therapeutic proteins present at high concentration. Their addition in such formulations prevents protein aggregation and denaturation.
The properties and actual activity depend on water dispersity, hydrophilic-lipophilic balance (HLB), microstructure, and polymer or oligomer distribution (1). The amphiphilic additives contain ethoxylate units (ethylene oxide, EO) and fatty alcohol or acid end groups and they can be built up from a particular central moiety. Each of these parts can, and generally will, exhibit a distribution since the surfactants are not synthesized from pure base materials. Fatty alcohol or acid carbon number (CN) and number of double bonds (NB) will depend on the type and quality of fatty acids or oil used for synthesis. The degree of ethoxylation is influenced by time and conditions applied for the reaction with ethylene oxide. The central molecule can be a pure product or a more disperse technical material and will potentially be modified during surfactant synthesis. All these variables will lead to complex mixtures of compounds with various size and polarity that will compose a given surfactant. The functional properties and application area of the surfactant will depend mainly on the HLB determined by the size and distribution on both the hydrophilic and hydrophobic parts of the oligomers. In addition, side products formed during synthesis or degradation can alter the activity.
The complexity of the surfactants requires performant analytical techniques for their characterization. Among others, high performance liquid chromatography (HPLC) in various modes is commonly applied for this type of analysis. Size-exclusion chromatography (SEC) enables analysis of large ethoxylates according to molecular weight or size, but will not be able to show small differences such as fatty alcohol or acid CN and NB (2). Liquid chromatography at critical conditions (LCCC) is used to perform a separation of the end groups (fatty alcohol or acid) while eliminating selectivity for the ethoxylate chain length (3–7). The separation conditions in this LC mode are chosen in such a way that contribution of entropy and enthalpy on retention for the EO units compensate each other. All components with the same composition will be eluted at the same retention time, regardless of their molecular weight. Reversed-phase LC enables efficient separation of oligomers according to the equivalent carbon number (ECN), which is the fatty alcohol or acid CN minus two times NB (ECN = CN – 2NB). Selectivity for the ethoxylation number is somewhat limited in reversed-phase LC, but depends largely on the applied conditions. Analyzing nonionic emulsifiers with hydrophilic-interaction chromatography (HILIC) is more powerful to determine ethoxylation distribution but shows only little selectivity for variations in ECN (8,9). Liquid-exclusion-adsorption chromatography (LEAC) is an alternative isocratic technique to separate oligomers on a reversed-phase column (3).
It is obvious that a combination of two orthogonal modes in an online setup (two-dimensional liquid chromatography, 2D-LC) should be very powerful for characterizing nonionic surfactants. Several combinations and setups have been evaluated and described, such as HILIC or normal-phase LC and reversed-phase LC or LCCC (4,6–8,10–13), LEAC and LCCC (3), and mixed-mode and reversed-phase LC (14).
In this report, a comprehensive 2D setup is applied to the analysis of a selection of commercially available emulsifiers and surfactants applied in pharmaceutical formulations. HILIC is used in the first dimension and combined with reversed-phase LC in the second dimension. The separation is hyphenated to single-quadrupole mass spectrometry (MS) and with evaporative light-scattering detection (ELSD). The information obtained by MS and ELSD in combination with the high peak capacity and orthogonality of the multidimensional analysis enables structure elucidation and detailed profiling of the selected samples and is a valuable tool for quality control and process control analyses.
Materials and Methods
Samples
A selection of polysorbates (Tween), alcohol ethoxylates (Brij), and Kolliphor EL were analyzed individually or as mixtures. All products were purchased from Sigma-Aldrich. Products were dissolved in acetonitrile to the appropriate concentration.
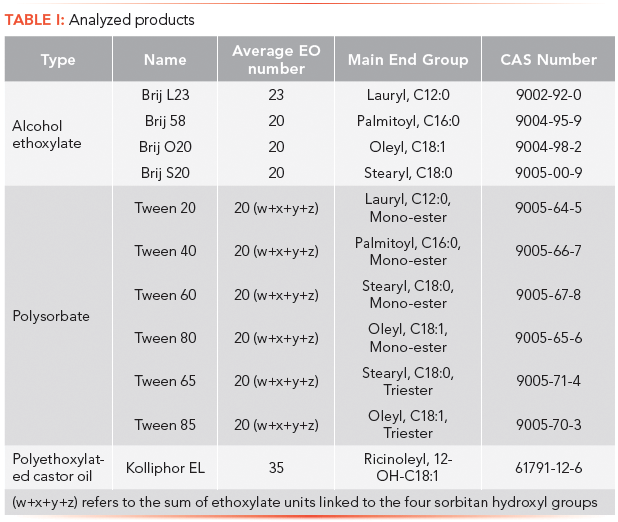
Table I summarizes the products investigated in this work.
Instrumentation and Methods
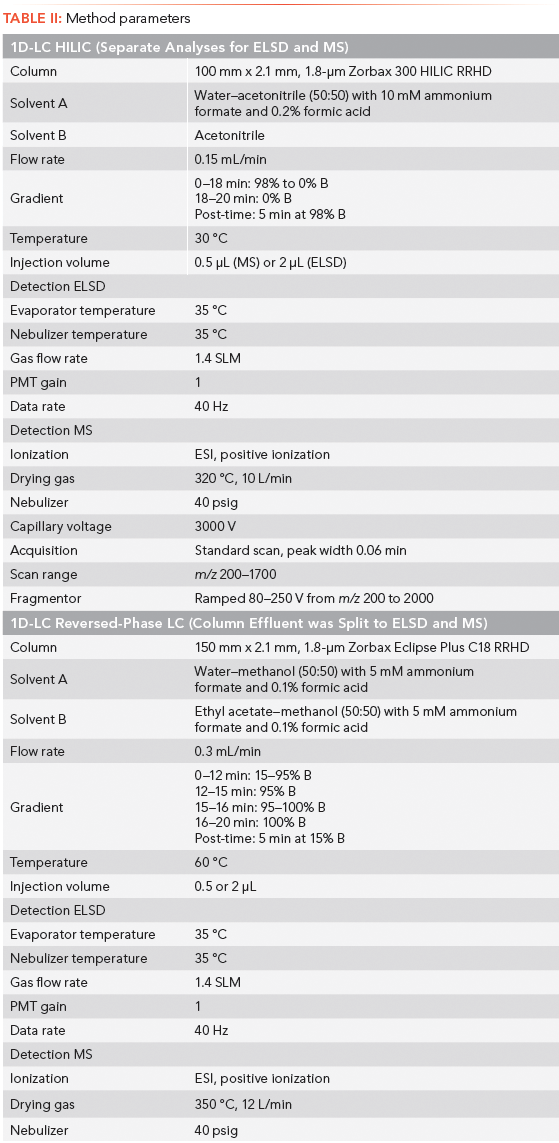
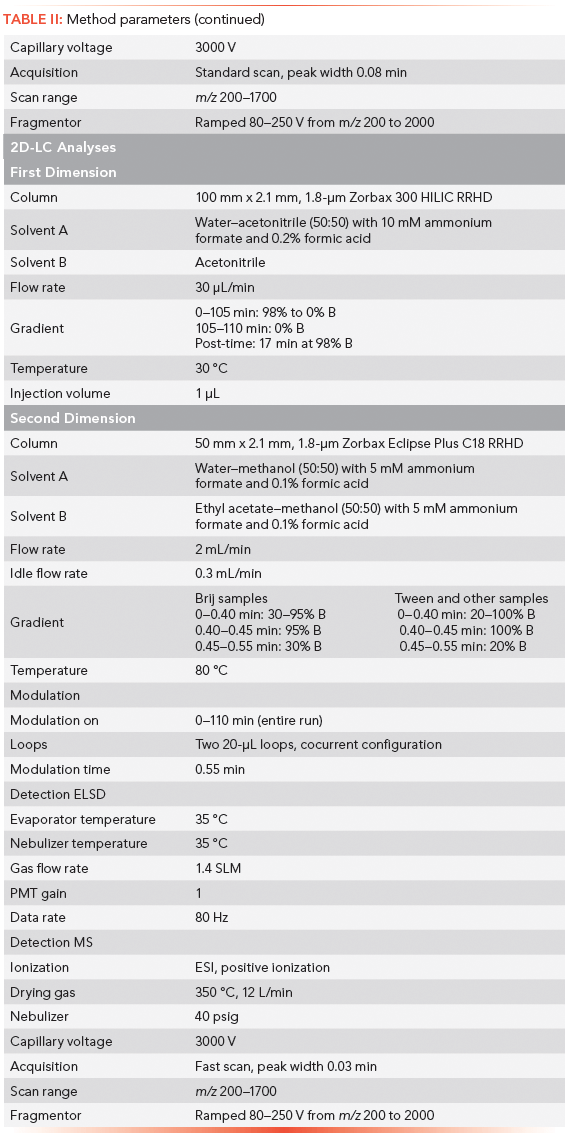
The 2D-LC instrument used for this study was an Agilent 1290 Infinity 2D-LC Solution system. The system comprised the following modules: two binary pumps, a high-performance autosampler, two thermostated column compartments, an external valve drive with a two-position, four-port duo valve equipped with two 20-µL loops for 2D-LC, and an evaporative light scattering detector (Agilent Technologies). For LC–MS analysis a G6130B single-quadrupole LC–MS system with an electrospray ionization (ESI) source was used (Agilent Technologies). First- and second-dimension columns were a 100 mm × 2.1 mm, 1.8-µm Zorbax 300 HILIC RRHD column and a 50 mm × 2.1 mm, 1.8-µm Zorbax Eclipse Plus C18 RRHD column (Agilent Technologies), respectively. The second-dimension column effluent was split between ELSD and MS using a zero-dead volume T-piece and two 340 mm × 0.075 mm stainless steel capillaries. For the one-dimensional reversed-phase screening runs a 150 mm × 2.1 mm, 1.8-µm Zorbax Eclipse Plus C18 RRHD column (Agilent Technologies) was used. The method details are summarized in Table II. Instrument control and data analysis were carried out with Agilent OpenLAB chromatography data system (CDS) ChemStation, revision C.01.07 with 2D-LC add-on software (Agilent Technologies) and GC Image LC×LC Edition Software for 2D-LC data analysis (GC Image, LLC), respectively.
Results and Discussion
Alcohol Ethoxylates
Alcohol ethoxylates are synthesized by ethoxylation of fatty alcohols or by etheration of fatty alcohols with polyethylene glycols (PEG). The reaction process yields mainly ethoxylated surfactant, but nonreacted PEG and fatty alcohols may also be present. Depending on the type and quality of the fatty alcohol starting material (synthesized via fatty acids), the product will show a single distribution or multiple distributions for each fatty alcohol present.
To develop both chromatographic dimensions to be used in the final LC×LC setup, one-dimensional (1D) separations were carried out on the samples with MS and ELSD. All samples were analyzed with HILIC and reversed-phase LC separately. Brij samples are relatively simple and a well-defined distribution can be visualized in a HILIC 1D-LC set-up. Separation is based mainly on degree of ethoxylation and the organic end group plays a less dominant role. An overlay of the ELSD signal for the Brij samples 58, O20, and S20 is shown in Figure 1a together with a detail of the slight EO 20 separation for S20 (C18:0), O20 (C18:1), and 58 (C16:0). The higher the ECN the earlier the compounds are eluted in HILIC mode. Figure 1b shows that for Brij L23 the EO maximum is higher and that the profile is clearly composed of more than one distribution. MS data of Brij L23 shows that the major distribution is attributed to different ethoxylation degree homologues (low to high) of lauryl (C12:0) ethoxylates and that the minor peaks are myristyl (C14:0) ethoxylates eluting slightly earlier compared to the C12:0 main compounds with identical degree of ethoxylation, which is in accordance with expectations when using HILIC.
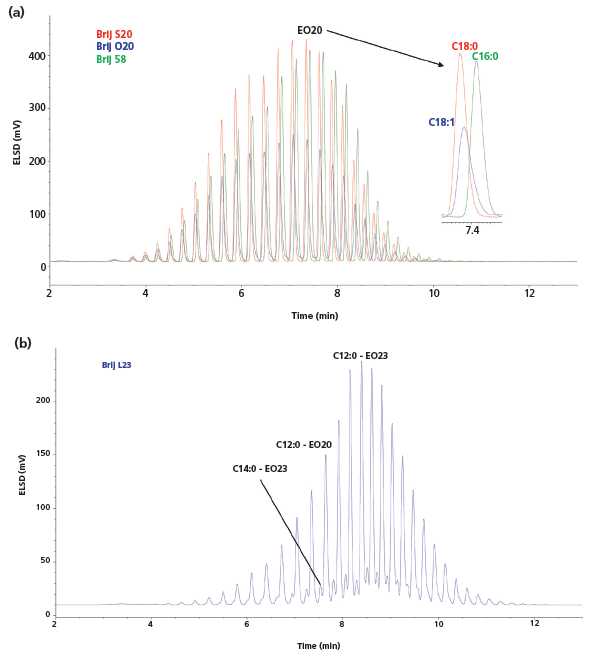
Figure 1: 1D-LC HILIC analysis of alcohol ethoxylates with ELSD: (a) Overlay of Brij 58, O20, and S20; (b) L23.
Analyzing the same samples with reversed-phase LC (Figures 2a and 2b), the separation is driven by hydrophobic interaction between the hydrocarbon end group and the stationary phase. The degree of ethoxylation will have an influence on retention, but depending on the chromatographic conditions (degree of hydrophobicity of the mobile phase), this may or may not be significant. As can be observed in Figures 2a and 2b, the degree of ethoxylation is clearly visible for the Brij S20 sample (C18:0 end group) and much less for the Brij L23 sample. The LC mode where the impact of ethoxylation is suppressed is referred to as LCCC (LC under critical conditions) and can be used for group type analyses and quantification. In fact, for Brij L23 the applied conditions are very close to this point and three groups can be detected, namely C12:0, C14:0, and C16:0 (Figure 2b).
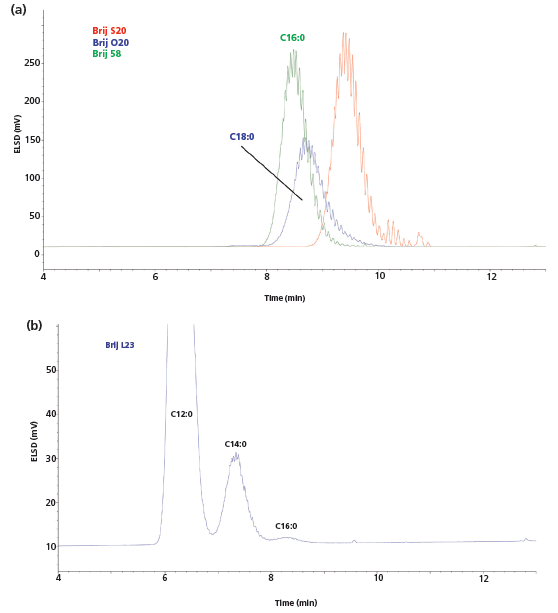
Figure 2: 1D-LC reversed-phase LC analysis of alcohol ethoxylates with ELSD: (a) Overlay of Brij 58, O20, and S20; (b) L23.
The combination of HILIC and reversed-phase LC in an LC×LC analysis illustrates the detailed composition of the surfactant. Figure 3 shows all MS and ELSD contour plots for the Brij samples. For these experiments the second-dimension column effluent was split to MS and ELSD using a T-piece. The degree of ethoxylation is shown in the first dimension (x-axis, 110 min, HILIC) while the second dimension (y-axis, 33 s, reversed-phase LC) separates the different end groups present in the product. For the Brij L23 sample, traces of distributions C10:0 and C18:0 alcohols were detected next to the main distribution of C12:0 and the previously mentioned C14:0 and C16:0 from the 1D-reversed-phase LC analysis. It is obvious that the fatty alcohol used for synthesis of this product was a technical mixture comprising different carbon chain lengths. The observed degree of ethoxylation ranged from mono- and di-ethoxylate up to more than 50 EO units. Also detected is nonreacted polyethylene glycol material used during or created in production. The distribution can be seen for all Brij samples along the bottom of the contour plot since very little retention is present under the applied second-dimension reversed-phase LC conditions. The EO distribution of Brij samples 58, O20, and S20 is similar but the end group composition varies in both type of fatty alcohol (which determines the name of the ethoxylate) and purity or number of fatty alcohol lengths. Brij O20 also contains a wide variety of end groups next to the labeled C18:1 fatty alcohol. Brij S20 and Brij 58 show less distribution in fatty alcohol type. All of these parameters can play an important role in the final properties of the nonionic surfactant.
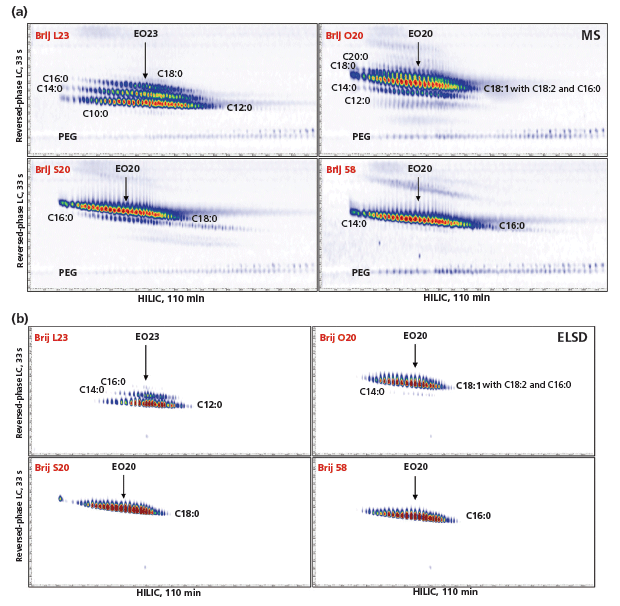
Figure 3: 2D-LC HILIC×reversed-phase LC analysis of alcohol ethoxylates, with (a) MS detection and (b) ELSD.
ELSD is obviously less sensitive than MS and because of its nonlinear concentration or response ratio, less-abundant distributions and ethoxylations at the front and back end are observed. However, the profiles are useful and ELSD can be considered as a routine detection method for profiling the major components.
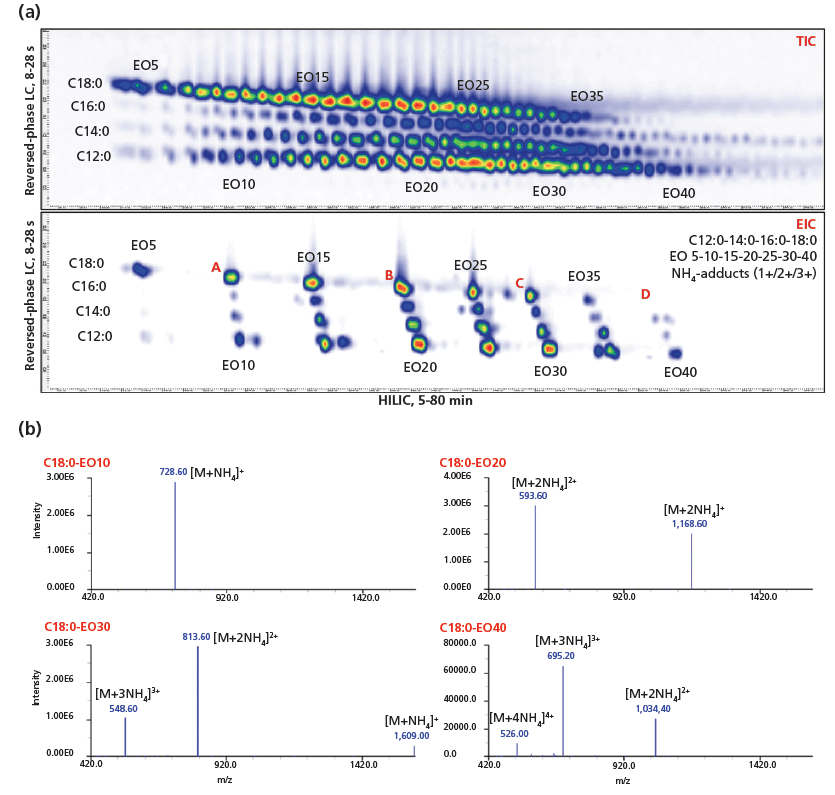
Figure 4: 2D-LC HILIC×reversed-phase LC analysis of alcohol ethoxylates, MS detection: (a) TIC and EIC for a mixture of all Brij samples and (b) a selection of mass spectra.
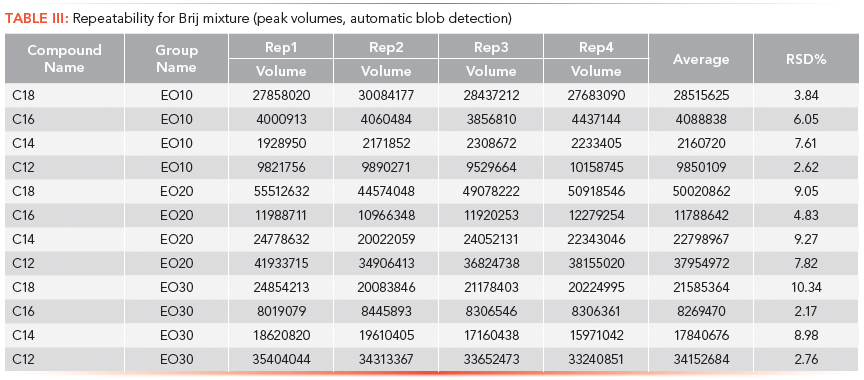
Mass spectra of ethoxylated compounds generally show ammonium adducts as base peak ions and larger compounds will show multiple charged species, which enables identification of highly ethoxylated compounds, for example, up to EO50. Examples of recorded mass spectra for C18:0 with 10, 20, 30, and 40 ethylene oxide units taken from an analysis of a mixture of the four Brij samples are shown in Figure 4 together with the total ion chromatography (TIC) and extracted ion chromatogram (EIC) contour plots for a selection of oligomers. This analysis was carried out four consecutive times to determine the precision of the method. A number of spots were selected to cover the entire ethoxylation and end group range. The respective masses were extracted and the spots were integrated. The results summarized in Table III show that precision ranged from 2–10%. Keeping in mind that this is a complex setup with MS detection, the precision is acceptable for profiling and quantitative comparison between batches.
Polysorbates
Although alcohol ethoxylates are relatively simple in composition and show homogeneous distribution patterns, polysorbates exhibit a much larger complexity. The synthesis of polysorbates is generally carried out in several steps (15). In the first step sorbitol is dehydrated into sorbitan through a condensation reaction. Sorbitan is then reacted with ethylene oxide and fatty acids to yield fatty acid esters of ethoxylated sorbitan. During the synthesis, several by-products can be formed. Condensation of sorbitol will not only yield sorbitan, but also isosorbide, which will undergo ethoxylation and esterification as well. Sorbitan ethoxylates can occur as mono-, di-, -tri-, and tetraesters and isosorbide ethoxylates as mono- and diesters. A fraction of the sorbitan and isosorbide ethoxylate will remain nonesterified, and free poleythylene glycol and free fatty acids may also be present after the reaction. In summary, the reaction will yield many different types of molecules. Depending on the reaction conditions and quality of the starting materials, the distribution within each of these groups can vary. Tween 20, 40, 60, and 80 are polyethoxylated sorbitan monoesters, and they all have an average ethoxylation number of 20. The number in the actual name refers to the fatty acid end groups. Tween 65 and 85 are the polyethoxylated sorbitan triesters of the surfactants Tween 60 and 80, respectively.
It is obvious that the reaction mixture can be quite complex and that one-dimensional LC will not be able to resolve all compounds within those samples. Figure 5 shows the comparison of a Tween 60 and Tween 65 analysis with ELSD using HILIC and reversed-phase LC. HILIC basically separates according to degree of ethoxylation regardless of the length and type of end group linked. Retention decreases with increased degree of esterification. Various types of components are coeluted although isosorbide and sorbate type derivatives are somehow separated. Isosorbide derivatives are eluted earlier then sorbate derivatives as confirmed by MS results. Reversed-phase LC results are shown in Figure 5b and a completely different profile is recorded in which the different classes are partially separated from each other. Nonesterified sorbate (PS) and isosorbide (PI) ethoxylates show little or no retention under the applied conditions. Monoesters (PSM and PIM) are eluted before diesters (PSD and PID) and sorbate derivatives before isosorbides. Last to be eluted are the polysorbate tri-(PSTri) and tetra (PSTetra)-esters, respectively. Nonreacted fatty acids are also detected in various Tween samples, in this case palmitic (C16:0) and stearic (C18:0) acids.
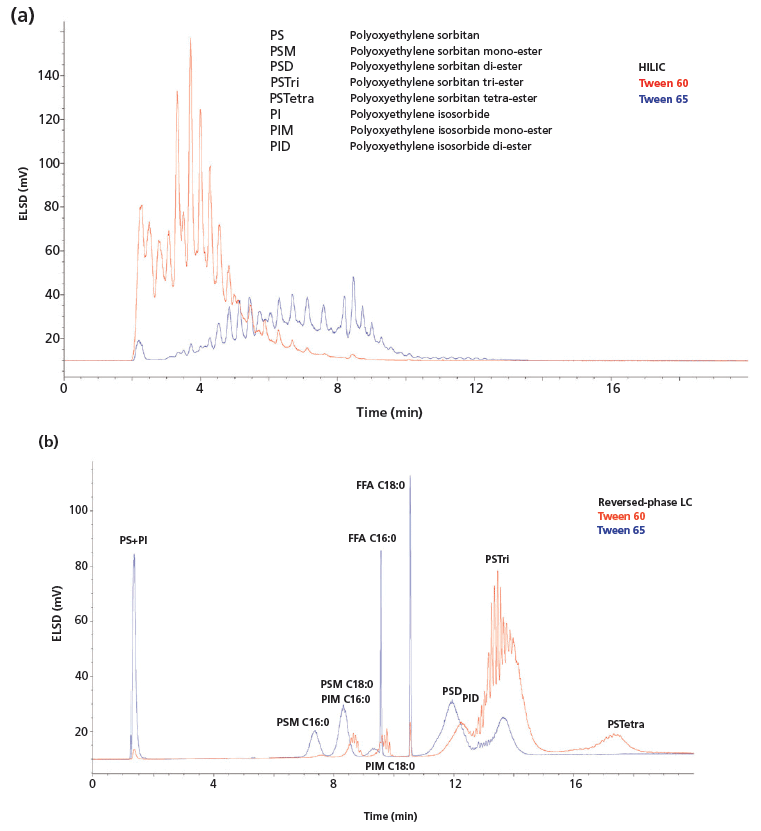
Figure 5: 1D-LC (a) HILIC and (b) reversed-phase LC analysis of polysorbates (Tween 60 and Tween 65) with ELSD.
If the distribution within each group is relatively narrow (degree of ethoxylation, fatty acid), a well-developed one-dimensional reversed-phase LC method could potentially be sufficient to profile the Tween sample. However, often mixtures of fatty acids are used in synthesis and the ethoxylation degree is relatively broad making it very difficult to clearly separate all groups from each other. MS can be used to increase selectivity, but care should be taken for components with the same elemental composition and molecular weight. Consequently, a better spatial separation will improve the profiling power of a method. The combination of LC×LC with MS is very powerful for this type of analysis.
Using the same setup as for the alcohol ethoxylates, the polysorbate samples were analyzed by LC×LC with MS and ELSD. The second-dimension gradient range was set somewhat more broad for these samples. This was necessary because of the higher complexity observed in the reversed-phase LC chromatograms compared to alcohol ethoxylates. 2D-LC results demonstrate the real complexity of these samples with distributions and compound groups separated along both the HILIC and reversed-phase LC axes. Figure 6 shows the contour plots for an analysis of Tween 60 and 65 with MS detection. The product description of Tween 60 states that these products are composed of mainly ethoxylated sorbitan monoesters with different fatty acid end groups while Tween 65 is described as the ethoxylated sorbitan triesters.
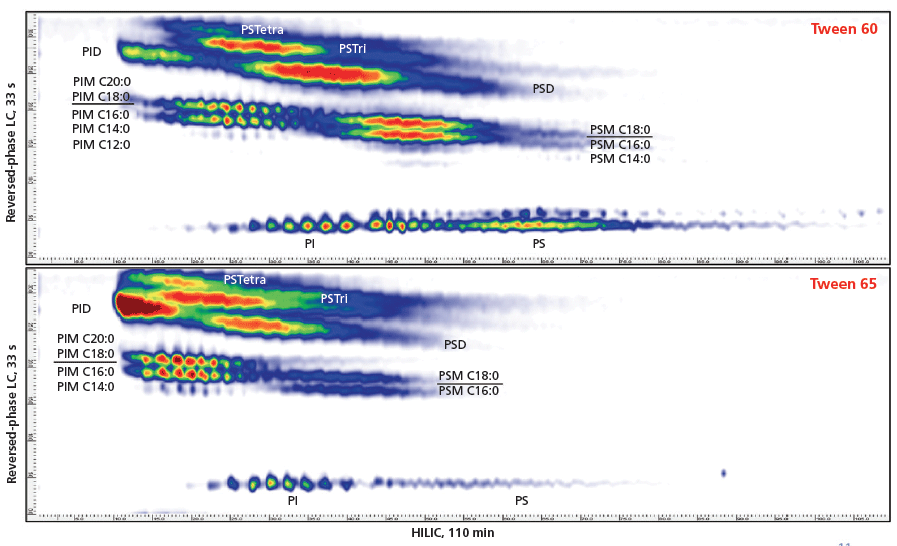
Figure 6: 2D-LC HILIC×reversed-phase LC analysis of polysorbates (Tween 60 and Tween 65) with MS detection.
The LC×LC results clearly show that such samples contain significant amounts of other compounds and distributions next to the main distribution. The following remarks could be made:
- Various esterification degrees of sorbitan are detected. Significant amounts of mono-, di-, tri-, and tetraesters were observed in all samples. As expected, a higher degree of ethoxylation leads to decreased retention in the first-dimension HILIC mode and increased retention in the second-dimension reversed-phase LC mode.
- In addition to the sorbitan esters, large amounts of isosorbide mono- and diesters are noticed.
- Polysorbates with various chain lengths present in some samples are not resolved in HILIC mode but are separated in the second-dimension reversed-phase LC.
- Isosorbides have an ethoxylation distribution ranging from approximately 5 to 20, sorbitans from approximately 15 to 55.
- Nonesterified ethoxylated sorbitan and isosorbide oligomers are clearly visible at the bottom of the contour plots. These will be eluted unretained from the second-dimension reversed-phase LC column.
As a proof of concept, a comparative analysis was carried out on the commercial Tween 20 sample and a noncommercial Tween 20 research sample. The 2D-LC–MS tridimensional plot for Tween 20 and the contour plots for both samples are shown in Figure 7. Composition and distributions between both samples differ largely and differentiation of the two samples from each other is straightforward. The research sample shows a larger fatty acid distribution compared to the commercial sample. C10:0 and C8:0 esters can clearly be detected. It is also observed that the ratio of monoesters–oligoesters is significantly higher. The ethoxylation range is slightly broader in the research sample. It is obvious that these observations can be of use to characterize various batches and suppliers of polyethoxylated sorbitan esters.
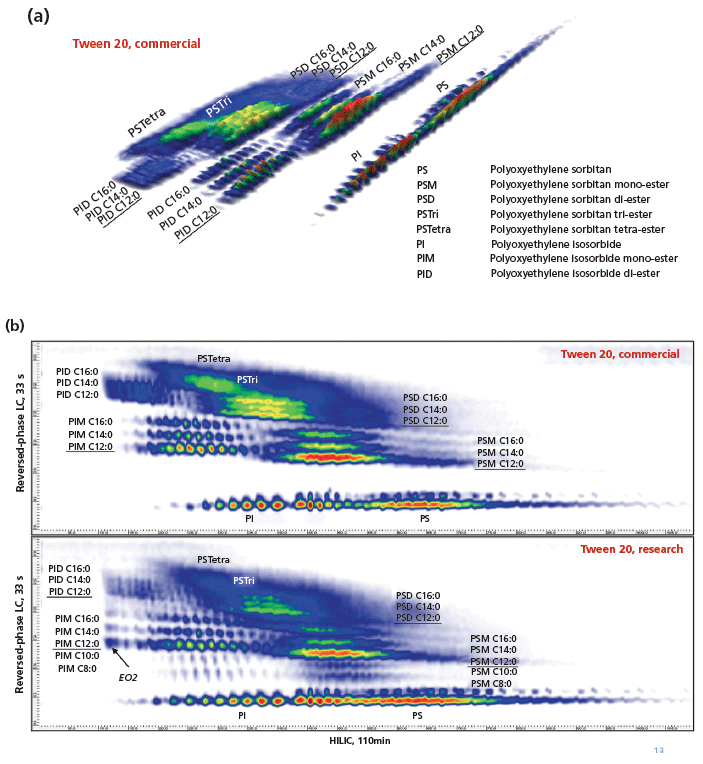
Figure 7: 2D-LC HILIC×reversed-phase LC analysis of polysorbates with MS detection: (a) Three-dimensional plot of commercial Tween 20 sample and (b) contour plots of commercial Tween 20 and a Tween 20 research sample.
Kolliphor EL
Kolliphor EL (also known as Cremophor EL or Polyoxyl 35 hydrogenated castor oil) is a polyethoxylated triglyceride prepared by reacting hydrogenated castor oil with ethylene oxide. Castor oil is a vegetable oil containing triglycerides with mainly ricinoleic acid (2-hydroxy-9-cis-octadecenoic acid) and smaller quantities of oleic and linoleic acid. It is commonly used as an emulsifier or solubilizer in pharmaceutical formulations (for example, to solubilize Paclitaxel, a chemotherapy drug used to treat a variety of cancers) in aqueous drug products. The reaction process results in a complex mixture in which fatty acid ethoxylates, ethoxylated mono-, di-, and triglycerides, and ethoxylated glycerol make up the majority of the product. The average degree of ethoxylation is about 35.
It is impossible to generate sufficient selectivity and peak capacity to separate all groups present in a 1D-LC setup. Applying the LC×LC method developed for the polysorbate analysis to this sample further demonstrates the complexity of this product (Figure 8).
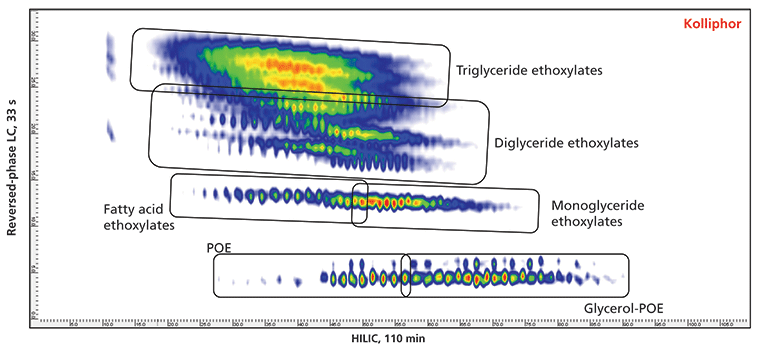
Figure 8: 2D-LC HILIC×reversed-phase LC analysis of Kolliphor EL with MS detection.
At the bottom of the contour plot polyethylene oxide and ethoxylated nonesterified glycerol species are detected. The latter seems to be made up out of multiple distributions, probably because of the position of the ethoxylation on the glycerol backbone. Moving upwards in the plot, with more retention in reversed-phase LC, the fatty acid ethoxylates and monoglyceride ethoxylates are visible, followed by diglyceride and triglyceride ethoxylates. The various groups show significant complexity on their own, which again demonstrate the vast number of compounds present in the sample. The complexity is increased even more with various positions of ethoxylation and esterification and the presence of other fatty acids besides the ricinoleic acid. Complete elucidation of all groups and solutes present in the plot was possible by using high-end MS detection, such as quadrupole time-of-flight (QTOF) (data not shown and discussed).
Conclusion
The comprehensive 2D-LC setup with HILIC in the first dimension and reversed-phase LC in the second dimension is a reliable and robust tool to characterize nonionic ethoxylated polymers used in pharmaceutical formulations. This approach is of major importance for evaluation of the quality of the surfactant and its potency to stabilize the product it is applied in. The features of 2D-LC have greatly improved now that state-of-the-art 2D-LC equipment is commercially available. ELSD can be used as a single detection method for routine work while MS can be used additionally or in combination with ELSD for in depth characterization and identification.
Disclaimer
This article was received January 2, 2018, and accepted for publication on February 7, 2018.
References
(1) R. Zhang, Y. Wang, L. Tan, H.Y. Zhang, and M. Yang, J. Chromatogr. Sci. 50, 598–607 (2012).
(2) K. Rissler, J. Chromatogr. A 742, 1–54 (1996).
(3) B. Trathnigg, C. Rappel, R. Raml, and A. Gorbunov, J. Chromatogr. A 953, 89–99 (2002).
(4) S. Abrar and B. Trathnigg, J. Chromatogr. A 1217, 8222–8229 (2010).
(5) G. Vanhoenacker and P. Sandra, J. Chromatogr. A 1082, 193–202 (2005).
(6) A. Micó-Tormos, E.F. Simó-Alfonso, and G. Ramis-Ramos, J. Sep. Sci. 33, 1398–1404 (2010).
(7) J.-A. Raust, A. Bruell, P. Sinha, W. Hiller, and H. Pasch, J. Sep. Sci. 33, 1375–1381 (2010).
(8) V. Elsner, S. Laun, D. Melchior, M. Köhler, and O.J. Schmitz, J. Chromatogr. A 1268, 22–28 (2012).
(9) S. Abrar and B. Trathnigg, Anal. Bioanal. Chem. 400, 2119–2130 (2011).
(10) R.E. Murphy, M.R. Shure, and J.P. Foley, Anal. Chem. 70, 4353–4360 (1998).
(11) A.F.G. Gargano, M. Duffin, P. Navarro, and P.J. Schoenmakers, Anal. Chem. 88, 1785–1793 (2016).
(12) P. Jandera, J. Fischer, H. Lahovská, K. Novotná, P. Cesla, and L. Kolárová, J. Chromatogr. A 1119, 3–10 (2006).
(13) G. Groeneveld, M. Dunkle, A. Gargano, A. de Niet, M. Pursch, E. Mes, and P. Schoenmakers, Abstract HPLC 2017, FUN 2-P15-Mo, Prague 18-22 June, p. 120 (2017).
(14) Y. Li, D. Hewitt, Y.K. Lentz, J.A. Ji, T.Y. Zhang, and K. Zhang, Anal. Chem . 86, 5150–5157 (2014).
(15) N.S. Erdem, N. Alawani, and C. Wesdemiotis, Anal. Chim. Acta 808, 83–93 (2014).
Gerd Vanhoenacker, Mieke Steenbeke, Koen Sandra, and Pat Sandra are with the Research Institute for Chromatography in Kortrijk, Belgium. Direct correspondence to: gerd.vanhoenacker@richrom.com
Polysorbate Quantification and Degradation Analysis via LC and Charged Aerosol Detection
April 9th 2025Scientists from ThermoFisher Scientific published a review article in the Journal of Chromatography A that provided an overview of HPLC analysis using charged aerosol detection can help with polysorbate quantification.
Analyzing Vitamin K1 Levels in Vegetables Eaten by Warfarin Patients Using HPLC UV–vis
April 9th 2025Research conducted by the Universitas Padjadjaran (Sumedang, Indonesia) focused on the measurement of vitamin K1 in various vegetables (specifically lettuce, cabbage, napa cabbage, and spinach) that were ingested by patients using warfarin. High performance liquid chromatography (HPLC) equipped with an ultraviolet detector set at 245 nm was used as the analytical technique.
Removing Double-Stranded RNA Impurities Using Chromatography
April 8th 2025Researchers from Agency for Science, Technology and Research in Singapore recently published a review article exploring how chromatography can be used to remove double-stranded RNA impurities during mRNA therapeutics production.


