Chromatography Fundamentals, Part II: Thermodynamics of Liquid Chromatography: Energetics
LCGC North America
We examine the connection between the distribution coefficient and Gibbs free energy, and contributions from enthalpy and entropy.
We continue our discussion on the thermodynamics of liquid chromatography by examining the connection between the distribution coefficient and Gibbs free energy, and contributions from enthalpy and entropy. A brief review of the principles of thermodynamics, as applied to separation science, is also presented.
From our previous discussion on thermodynamics of liquid chromatography (LC), we showed that retention, and thus separation, depends upon the distribution of solutes between mobile and stationary phases during migration through a chromatographic column (1). Separation depends on distribution coefficient differences among solutes. Since thermodynamics is the underlying science that governs distribution behavior of solutes, it is instructive to know some relevant properties of free energy, enthalpy, and entropy, as they apply to LC.
Review of Thermodynamics
The energetics of the distribution process involves the energy content of mobile and stationary phases containing solute at equilibrium. By definition, energy is force times the distance over which it acts. Thus in LC, intermolecular forces are those between solute, mobile-phase, and stationary-phase molecules, as well as between solute and mobile-phase molecules and solute and stationary-phase molecules. Mobile phase–stationary phase forces are ignored, since we assume phase immiscibility.
Thermodynamic equilibrium is reached when corresponding volumes of mobile and stationary phases containing solutes have equal energies, or chemical potentials. At this stage, solutes are apportioned between phases at a ratio indicated by the distribution coefficient, which is ultimately responsible for retention time at peak maximum.
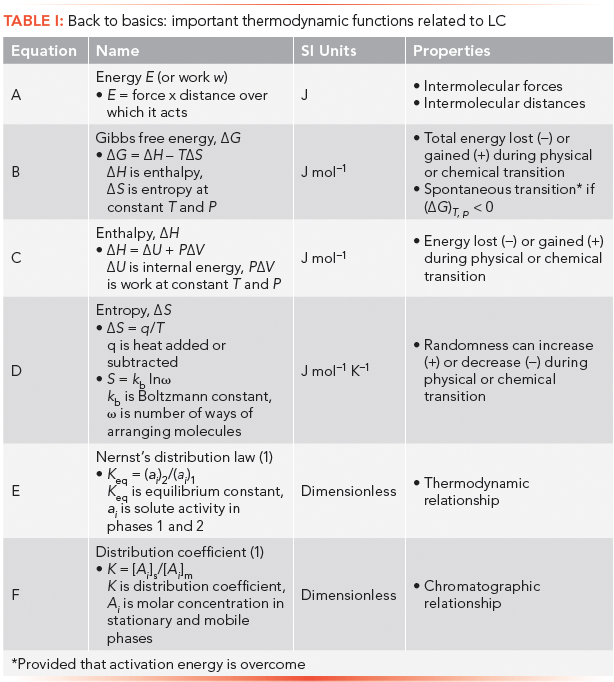
Thermodynamic state functions are Gibbs free energy, ΔG (J/mol), enthalpy, ΔH (J/mol), and entropy, ΔS (J mol-1K-1). Energy liberated is a negative value, and when adsorbed, a positive value.
For the benefit of readers, Table I presents an outline of some important thermodynamic equations and concepts covered in this article.
Enthalpy
The internal energy u of a system is the sum of the kinetic energy from the stretching, twisting, bending, and translational motions of molecules, plus the potential energy from intermolecular forces and chemical bonds. Since it is difficult to determine absolute internal energy of systems, changes in energy content are determined when going from one energy state to another.
Only two sources of energy are considered in thermodynamics: heat q and work w:

Click here to view full-size graphic
Because heat and work are quantities of energy that are added or removed, they are not preceded by a delta sign.
The most familiar state function is enthalpy (first law of thermodynamics):

where PΔV is work done in the form of a volume change at constant pressure. In LC, we often neglect the PΔV term because of the small compressibility of liquids; however, in ultrahigh-pressure LC (UHPLC), this term may become important. As we shall see in a future article, the PΔV term must be included in gas chromatography.
Entropy
Entropy is a fascinating concept that established the second law of thermodynamics. The classical definition originates from heat engines, as the amount of heat developed or lost at constant temperature, ΔS = q/T. Perhaps the most interesting and profound definition of entropy was introduced by Boltzmann and modified by Planck, which expresses entropy in terms of disorder:

In this equation ω is the number of ways molecules can be arranged with respect to position and energy when spontaneously moving from a state of low to high probability at equilibrium. This definition implies that equilibrium between mobile and stationary phases is established spontaneously as molecules attain a disordered state.
Gibbs Free Energy
The most important thermodynamic concept in chemistry is Gibbs free energy, ΔG, which is the total amount of energy that is liberated from or required for a chemical or physical transformation:

where ΔH is the enthalpy and ΔS is the entropy of a physical or chemical transition. A transition will only occur if ΔG ≤ 0. In LC, we are interested in Gibbs free energy that occurs during the distribution of a solute between mobile and stationary phases. Under this condition, a solute must have a finite distribution coefficient.
Distribution Coefficient
Part I of this series (1) gives details on the distribution coefficient, as it relates to LC. We need to introduce it once again, however, to develop needed relationships.
During a chromatographic separation, solute molecules diffuse between mobile and stationary phases, in a dynamic manner, always maintaining a given concentration ratio, as described by a distribution coefficient,

Click here to view full-size graphic
Here Ai is the molar concentration in the respected phase. (If surface area is used for the stationary phase, as with adsorption chromatography, units of mol m-2 are needed.) In principle, the value of K does not depend upon solute concentration, but remains constant for a given temperature, solute, mobile phase, and stationary phase.
Thermodynamic Standard States
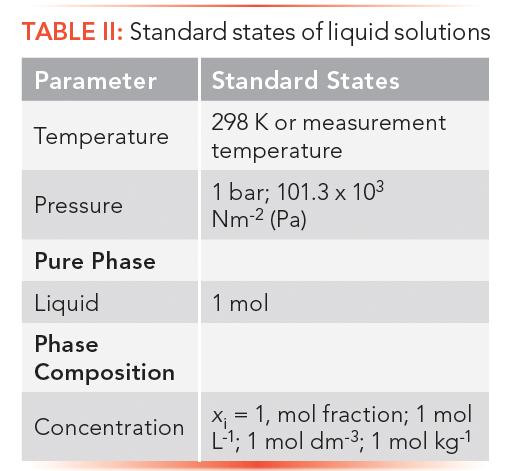
Thermodynamic quantities are experimentally measured or calculated using standard state conditions of temperature, pressure, phase, or concentration-real or hypothetical. This approach furnishes the data points needed for energy transformations going from one state to another.
When thermodynamic quantities are reported at standard state, either a superscript zero or capital theta is used, as in G0 or Gθ. Other conditions are listed in series as subscripts.
Standard states of (liquid) solutions are listed in Table II. Because logarithms are used, concentrations must be dimensionless via normalization.
Energetics of LC
Gibbs free energy equations for mobile Gm and stationary Gs phases containing solute i, at constant pressure and temperature, respectively, are

In these equations, G0s and G0m are Gibbs free energy of the pure phases at standard state conditions, R is the gas constant (8.31 J K-1mol-1), T is absolute temperature (298 K), and (ai) is the molar activity of component i in the respected phase, normalized at 1 M.
According to equations 6 and 7, the Gibbs free energy of a phase with solute is simply the sum of free energies of the pure phase plus the dilute solute. Although, for the most part, derivations have been avoided, we have nevertheless included the origin of the general form of equations 6 and 7 in Table III for readers to appreciate the beauty, simplicity, and power of thermodynamics.

Each time equilibrium is established during migration of solutes through an LC column, three simultaneous events occur spontaneously:
• ΔS reaches a maximum positive value.
• ΔG decreases to a minimum negative value.
• Gibbs free energy values of both phases become equivalent, thus Gm = Gs and ΔG = 0.
We can therefore set equations 6 and 7 equal to one another at equilibrium. After rearranging, we obtain

Substituting the equilibrium distribution constant Keq for (ai)s/(ai)m in equation 8, we obtain

Since ΔG0 = ΔH0 – TΔS0, we can express ln Keq in terms of enthalpy and entropy:
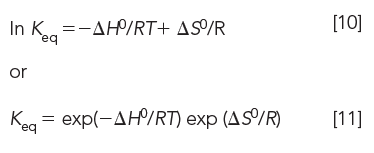
Furthermore, since Keq ≈ K, where K is the chromatographic distribution coefficient,

Chromatographic retention is proportional to K; thus to encourage solute solubility or interaction with the stationary phase, more energy must be liberated or entropy must be increased when solute molecules diffuse from mobile to stationary phase. It does not matter which term predominates, as long as ΔG remains negative. In LC, enthalpy is the dominating function by several orders of magnitude, as compared to entropy, when solutes move from mobile to stationary phase. Exceptions are size-exclusion chromatography (SEC), where ΔH = 0, and hydrophobic interaction chromatography (HIC), where ΔH > 0. In other words, SEC relies on entropy, not enthalpy, for its energy source; whereas for HIC, entropy is the dominant energy term.
Effect of Temperature on Distribution Coefficient
Equation 12 shows a reciprocal relationship between temperature and the distribution coefficient. By plotting ln Keq, ln K, or ln k (where k is the retention factor) against 1/T, referred to as a van 't Hoff plot, we obtain ΔH0/R as the slope and ΔS0/R as the intercept (see Figure I).
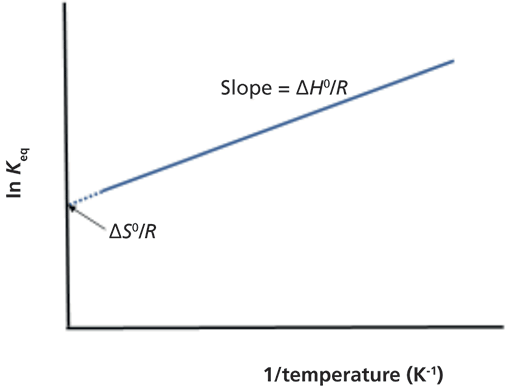
Figure 1: Van ’t Hoff plot showing the relationship between the equilibrium constant and temperature, see equation 10. Ordinate can also be ln K or ln k, where k is the retention factor, k = (tr – t0)/t0, in which tr is peak retention time of the solute and t0 is elution time of an unretained peak.
For most LC methods the slope is linear, if not, results would suggest a mixed-mechanism separation. Furthermore, the slope is usually positive, in which case solute solubility is favored toward the stationary phase rather than the mobile phase. Please note that the slope of van 't Hoff plots are (or should be) zero for SEC and negative for HIC.
Conclusions
LC is a dynamic process whereby the distribution coefficients of solutes fluctuate between equilibrium and nonequilibrium states throughout the separation. Gibbs free energy also varies in concert with the distribution coefficient-always driving toward an equilibrium state.
The thermodynamics of chromatography are established by the distribution coefficient whose energetics are governed by the enthalpy and entropy of the distribution process. These two energy terms are controlled by column temperature and the intermolecular forces between solute molecules and components of the mobile and stationary phases. The equations presented here are applicable to all modes of chromatography.
The next series of articles on chromatography fundamentals will be on plate theory, peak broadening, and LC performance characteristics, after which we will continue our discussion on LC energetics with a focus on intermolecular interactions.
Recommended References
(1) H.G. Barth, LCGC North Am. 36(3), 200–202 (2018).
(2) X. Li, A.M. Hupp, and V.L. McGuffin, Advances in Chromatography, vol. 45, E. Grushka and N. Grinberg, Eds. (CRC Press, Boca Raton, 2007), pp. 1–88.
(3) G. Price, Thermodynamics of Chemical Processes (Oxford University Press, Oxford, 1991).
(4) G. Socrates, Thermodynamics and Statistical Mechanics (Buttersworth, London, 1971).
(5) L. Ulickây and T.J. Kemp, Eds., Comprehensive Dictionary of Physical Chemistry (Ellis Horwood and PTR Prentice Hall, New York, 1992).
Howard G. Barth is with Analytical Chemistry Consultants, Ltd., in Wilmington, Delaware. Direct correspondence to: howardbarth@gmail.com

Evaluating Body Odor Sampling Phases Prior to Analysis
April 23rd 2025Researchers leveraged the advantages of thermodesorption, followed by comprehensive two-dimensional gas chromatography coupled to time-of-flight mass spectrometry (GC×GC/TOF-MS), to compare and assess a variety of sampling phases for body odor.

.png&w=3840&q=75)

.png&w=3840&q=75)


.png&w=3840&q=75)


.png&w=3840&q=75)


