Biomimetic Chromatography to Accelerate Drug Discovery: Part I
LCGC North America
Drug discovery can be accelerated by chromatographic profiling of analogs by measuring their nonspecific binding to proteins and lipids.
The drug discovery process can be accelerated by chromatographic profiling of analogs by measuring their nonspecific binding to proteins and lipids and then by modeling in vivo distribution. A balanced potency and chromatographically determined membrane and protein binding ensure the selection of compounds with the highest probability to show the desired in vivo distribution behavior for efficacy and reduced toxicity. The first part of the article will discuss the high performance liquid chromatography (HPLC)-based measurements of lipophilicity and biomimetic properties, and the second part will discuss the models derived from the measured data of known drug molecules and drug discovery compounds.
High performance liquid chromatography (HPLC) is widely used in almost all stages of the drug discovery process. It starts with the HPLC–mass spectrometry (MS) analysis of the newly synthesized compound to check the identity and the purity before testing its potency against the desired receptor or target. At later stages of the drug development process, HPLC most often coupled with MS is applied to monitor the concentration of the compounds in various biological media, such as blood and tissues. HPLC is also used to monitor the concentrations of the components in the synthetic mixtures during the development process, research to scale-up, and when optimizing the synthesis of the putative drug molecules. The final quality control, impurity checks, stability investigations, and many other areas of the drug development process also use HPLC as a major analytical tool. In these examples, HPLC is used to separate very closely related compounds because they gain different migration speeds in a chromatographic system as a result of the slight differences in the compound's interaction with the stationary phases.
In this article, the applicability and the advantages of using the chromatographic separation principles for the characterization of physicochemical and biomimetic binding properties of compounds are highlighted. When applied at an early stage of the drug discovery process, this technology enables the characterization of many discovery compounds and the prediction of their in vivo behavior at a much earlier stage.
What Are the Important Characteristics of Drug Discovery Compounds?
Lipophilicity is one of the most often used properties that can be related to a compound's in vivo distribution behavior. Lipophilicity shows how the compound prefers the lipophilic environment relative to the aqueous environment. A drug's binding to proteins may also involve lipophilic attractions, and their partition to tissues is also related to their lipophilicity. Since the early work of Corwin Hansch, the octanol–water partition coefficients are used as a measure of the loss of the concentration of drug molecules at the site of action relative to the administered dose (Figure 1). The octanol–water partition system appeared to mimic the compound's nonspecific binding to proteins and lipids very well.
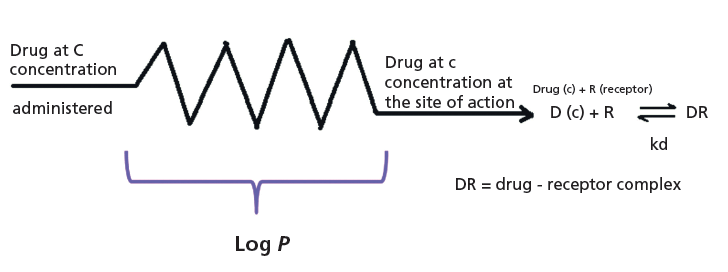
Figure 1: The Hansch model of using octanol–water partition coefficients (log P) to explain the reduced drug concentration (c) at the site of action.
The octanol–water partition coefficient can be determined by measuring a compound's concentration in water (usually buffer at pH 7.4) and in octanol, after thorough equilibration using shaking and then separating the two liquid phases. This is a tedious procedure and, usually, HPLC is used for the concentration determination via peak area measurements from the injected and the octanol phases.
Using Reversed-Phase Chromatographic Retention to Measure Lipophilicity
It has been recognized and elegantly described by the solvophobic theory (1,2) that retention in reversed-phase chromatography is governed by lipophilicity or more exactly by hydrophobicity. It means that the chromatographic retention times are directly related to the compound's dynamic distribution coefficient between the stationary and the mobile phases. The chromatographic method has numerous advantages over the traditional method for measuring liquid–liquid partition coefficients. A much smaller amount of compound is needed for the reversed-phase retention measurements and small impurities do not alter the results as they are separated from the main component. The retention time measurements are inherently more precise than the concentration determination process for the shake flask (octanol–water) method.
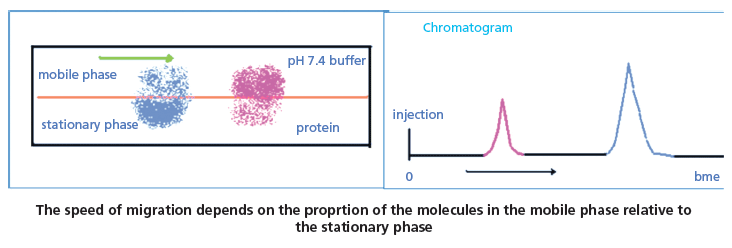
Figure 2: The chromatographic retention process. The average proportion of the molecules in the stationary and the mobile phase determine the rate of migration of the compound in the chromatographic system.
The HPLC retention is a result of the dynamic equilibrium of the compound between the stationary and mobile phase, and the retention factor (k) is directly proportional to the average number of moles of the molecule in the stationary phase relative to the mobile phase (see equation 1). Figure 2 illustrates the process. The higher the proportion of the molecules in the stationary phase the longer the retention time will be.

The retention factor (k) is the retention of the compound expressed relative to the dead time (to), which is the time needed for a compound to go through the chromatographic system without any interaction with the stationary phase.

The partition coefficient (K) of a compound between the stationary and the mobile phase can be expressed using the retention factor by expressing the compound concentration in the stationary and mobile phase as moles/volume.
Equation 3 shows the relationship between the logarithmic retention factor and the logarithmic partition coefficient of a compound in the chromatographic stationary and mobile phases.

Vs and Vm are the volumes of the stationary and mobile phases, respectively. Equation 3 shows that the log k values are in a linear relationship with log K values, the partition coefficients. The intercept is the so-called phase ratio, the proportion of the volumes of the stationary phase and mobile phase in the column. This is a constant value for each HPLC column and is difficult to determine accurately. Therefore, it is a good idea to calibrate the chromatographic retention times of compounds using their respective distribution coefficients, preferably containing the same phases. For the analysis of compounds with a wide range of lipophilicity, we need to change the mobile phase composition and mix the aqueous buffer with various concentrations of miscible organic solvents (usually acetonitrile or methanol). Higher organic phase concentrations in the mobile phase will reduce the retention of more lipophilic compounds. The relationship between the reversed phase retention and the concentration of the organic phase in the mobile phase has been analyzed in detail (3). We can expect a linear relationship between the log k values and the concentration of the organic phase in the mobile phase in reversed-phase chromatography. The question arose of how we can extrapolate the retention factors to a single scale for comparison. Equations 4 and 5 describe the linear or quadratic relationships between the retention factor and the organic phase concentration in volume percentage (φ) in the mobile phase and may provide a solution.

There is a quasi-linear portion of the function for which we can establish the a and b constants by performing the log k measurements using three to five different organic phase concentrations (φ) in the mobile phase. The b constant is the extrapolated log k value to zero organic phase concentration, that is, the neat water (buffer) often referred to as log k0 or log kw. The guide of the Organization for Economic Co-operation and Development (OECD) (4) suggested the extrapolation of the logarithmic retention factor (log k0) for lipophilicity determination. One can use known compounds to calibrate the system to the octanol–water scale by plotting the logarithm of octanol–water partition coefficients (log P) in the function of log kw values. A straight line can be expected and the slope and intercept values of this line can be used to convert the log kw values to log P values.
The approach described above raises some potential questions. It is possible that the straight line is valid only in a limited range of organic phase concentrations, and so other equations and numerical methods have been suggested (5,6) to derive log kw values. The straight lines of the compounds may cross each other, as shown in Figure 3. This has been observed in the past and the use of slope values as the second variable in correlation to the octanol–water coefficient was suggested (7).
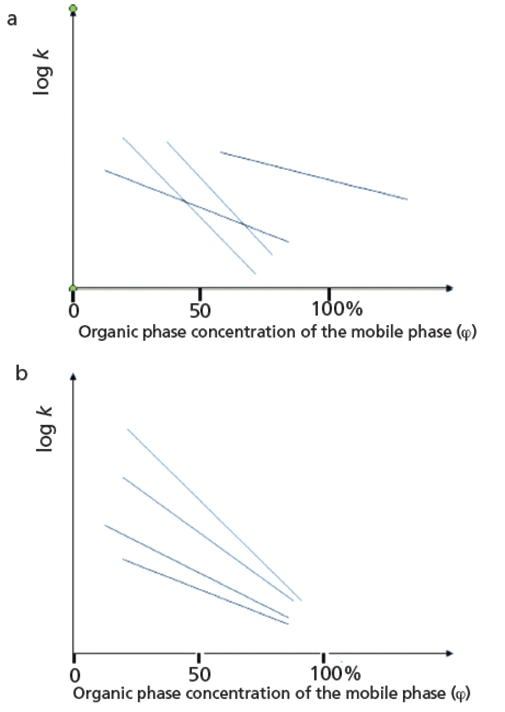
Figure 3: Relationships between the organic phase concentration in the mobile phase (φ) and the logarithmic retention factor: (a) Structurally unrelated compounds, (b) structurally related compounds.
To avoid several isocratic measurements, fast gradient reversed-phase chromatography has been proposed to derive the chromatographic hydrophobicity index (CHI), which approximates the organic phase concentration in the mobile phase when the compound elutes in gradient mode (8). When a fast-organic phase gradient is applied on a reversed-phase column the compounds do not move in the chromatographic system until the appropriate organic phase concentration reaches the column and starts eluting the compound practically with the dead time. Acetonitrile gradient reversed-phase chromatography has been introduced to measure lipophilicity of drug discovery compounds and has been compared with octanol–water lipophilicity (9). It was found that the isocratically determined organic phase concentration that resulted in retention factor 1 (φ0) showed a linear relationship with the fast gradient retention times of the compounds. The CHI has been derived from this linear relationship. The CHI value approximates the organic phase concentration in the mobile phase by which the compound retention time is double the dead time-that is, the retention factor (k) = 1 and log k = 0. In this way, we do not have to perform several isocratic measurements and the extrapolation to zero organic phase concentration in the mobile phase or backward extrapolation to a certain organic phase concentration. The CHI values range between 0 to 100 (for very hydrophilic or lipophilic molecules it can go below zero or above 100, respectively). The higher the value the more lipophilic the compound because higher organic phase concentrations in the mobile phase are needed to elute the compound from the nonpolar stationary phase. To help the medicinal chemist to develop structure lipophilicity relationships, we can project the CHI values to the octanol–water log D scale to obtain CHI log D or Chrom log D as described by equations 6 and 7.

Both the CHI log D and Chrom log D scales are linear with the CHI scale. CHI log D was derived from 98 diverse compounds with CHI and octanol–water log D values, while the Chrom log D scale was derived from over 40,000 compounds with calculated log D and related to CHI. Chrom log D gives approximately a 2-log unit higher lipophilicity value than the octanol–water log D for compounds, with 3- to 5-log D values in the octanol–water system. Combining the number of aromatic rings in the molecule with the Chrom log D value gives the so-called PFI (Property Forecast Index) values (10). PFI values between 3 and 6 are ideal for expecting good absorption, distribution, and metabolism (ADME) properties for drug discovery compounds.
The chromatographic distribution process is a better model for in vivo distribution processes because they are dynamic and develop on large surfaces (stationary phase and protein–phospholipid membrane).
The chromatographic lipophilicity that is determined using a C18 stationary phase with acetonitrile as an organic mobile-phase component does not provide an octanol–water type lipophilicity. It provides a dynamic partition coefficient of a compound between hydro-organic mobile phase and C18. When comparing the two types of lipophilicity using the Abraham solvation equation approach (11), it was found that the major difference is the sensitivity toward H-bond acidity. H-bond donor compounds partition into octanol because it has an H-bond acceptor OH group, unlike the C18 stationary phase, which does not accept H-bonding. Equations 8 and 9 show the solvation equation obtained for octanol–water partition coefficients and the reversed-phase chromatographic lipophilicity (s). Both equations are derived from the data of neutral compounds or measured at a pH where the compound is not ionized (12,8):
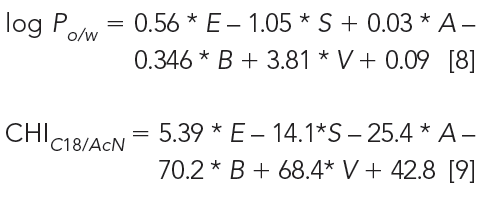
where E, S, A, B, and V are the molecular descriptors of excess molar refraction, dipolarity–polarizability, H-bond acidity, H-bond basicity, and McGowan volume, respectively. From equation 8 and 9 we can see that the major difference between the octanol–water and CHI lipophilicity scale is their sensitivity toward H-bond acidity. Compounds with H-bond donor groups partition into octanol, but they show shorter retention on a C18 stationary phase because it has not got the H-bond acceptor group. It also provides a possibility to convert the CHI scale to the octanol–water scale using the number of H-bond donor groups in the molecule or the Abraham H-bond acidity descriptor (13,11). Equation 10 shows how to estimate octanol–water log P from the CHI values of the neutral form of the molecules (CHIN):

Figure 4 shows the plot of octanol–water log P and CHI for compounds with and without H-bond donor groups.
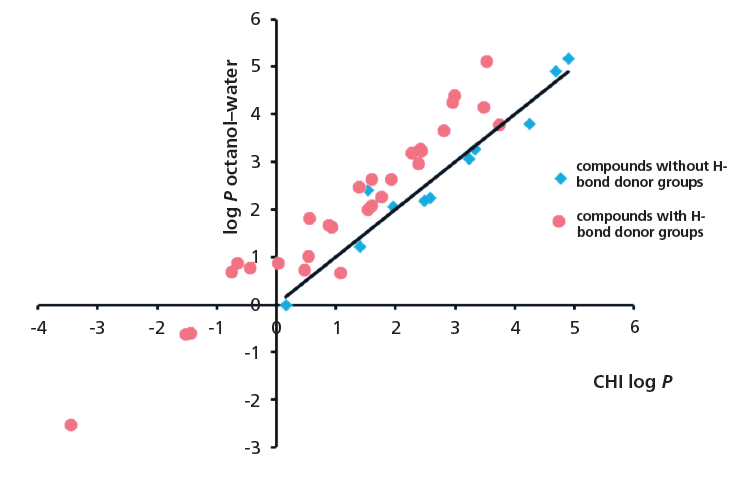
Figure 4: The plot of log P and CHI for compounds with and without H-bond donor groups.
The octanol–water lipophilicity and the chromatographic lipophilicity determined using a C18 reversed phase stationary phase are different measures of lipophilicity. They differ from each other in their sensitivity toward H-bond donor groups in the molecules.
It has been recognized that the two methods of measuring compound lipophilicity are different and several approaches have been published to modify the chromatographic partition system to make it more like the octanol–water system. Thus, some authors have suggested using octanol-coated stationary phases or applying octanol in the mobile phase with methanol organic modifier (14,15).

Figure 5: Biomimetic stationary phases that are used to measure albumin, glycoprotein, and phospholipid binding of drug discovery compounds.
Protein and Immobilized Artificial Membrane Biomimetic Stationary Phases
Why do we want to transform our chromatographic partition system to model the octanol–water partition system, which is only a model for biological partition–distribution properties? When we apply the major components in the body as stationary phases we can investigate a compound's interactions with the major components of the body. Figure 5 shows the current biomimetic stationary phases used to measure a compound's interaction with proteins and lipids.
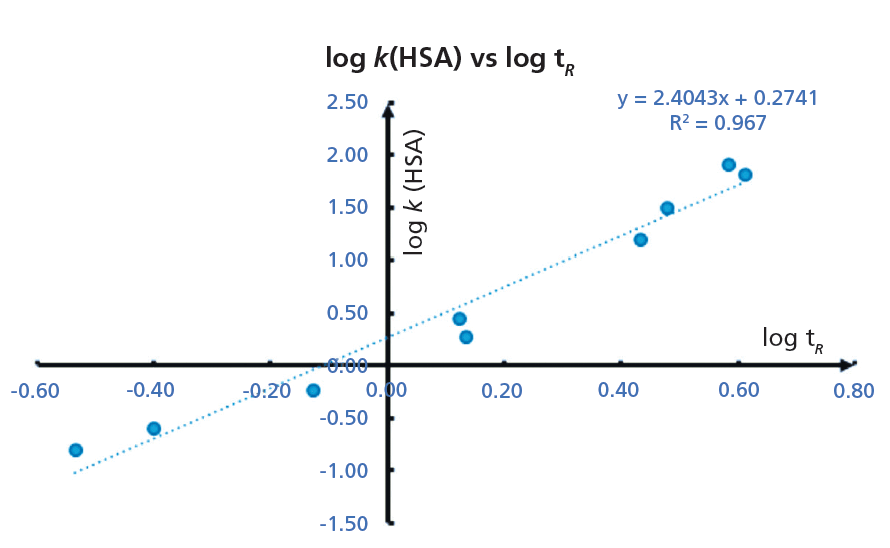
Figure 6: The calibration plot obtained for the data listed in Table I. The slope and the intercept of the straight line can be used to convert the retention time of a new compound to % HSA binding using equation 12. (HPLC conditions: 50 mm × 4.6 mm, 5-µm Chiral HSA column [Chiral Technologies Inc.], 1.5 mL/min flow rate, mobile-phase A: 50 mM ammonium acetate pH 7.4; mobile-phase B: 2-propanol, gradient 0 to 35% B from 0 to 3.5 min; 3.5 to 4.5 min 35% B; 4.5 to 5 min 0% B, run time 6 min).
Human serum albumin (HSA) and alpha-1-acid-glycoprotein (AGP)-coated stationary phases have been developed for chiral separation. Proteins are all optically active and therefore these stationary phases can differentiate between L- and D-enantiomers because they have different interactions with these phases. The retention times of compounds on these phases are proportional to the dynamic distribution constants of the compound between the mobile and stationary phases so that they measure a partition coefficient of the compound into the protein phases. As the retention times are dependent on chromatographic conditions such as flow rate and column dimensions, a standardization and validation has to be performed using HSA and AGP binding data obtained by techniques other than chromatographic methods, for example, by equilibrium dialysis. Even on the protein columns, the application of organic solvent is inevitable to elute strongly bound compounds within reasonably short retention times. On a protein phase, up to 30–35% of 2-propanol is used because acetonitrile would denature the protein into losing its native secondary structure. The HSA binding for a set of known drug molecules was taken from equilibrium dialysis results of human plasma that contains approximately 60% HSA. The % binding data were converted to partition coefficients as described by equation 11.

The 101 value was chosen arbitrarily to be able to handle stronger than 99.99% binding without the need for increasing the decimal points. These high bindings cannot be measured by equilibrium dialysis, which is based on the analytical measurement of the free concentration of the compound after equilibrium. However, the chromatographic method is able to distinguish and reproducibly rank compounds above the 99% binding range. The HSA binding method using a chemically bonded human serum albumin stationary phase with pH 7.4 ammonium acetate phosphate buffer and a 2-propanol gradient from 0 to 35% has been validated (16–18). The measured HSA binding data for a set of compounds with known Abraham molecular descriptors revealed that the HSA binding data expressed as log k HSA showed similar values to the Abraham solvation equation obtained for the octanol–water partition. However, negatively charged compounds bind stronger to HSA than would be expected from the octanol–water log D obtained at pH 7.4. The AGP binding data obtained from ultrafiltration experiments showed correlation to the logarithmic values of the gradient retention times obtained on an AGP stationary phase.
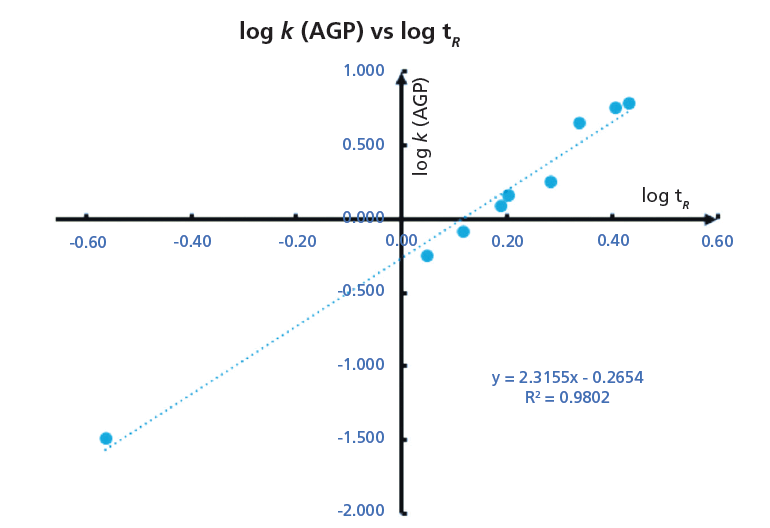
Figure 7: The calibration plot obtained for the data listed in Table II. The slope and the intercept of the straight line can be used to convert the retention time of a new compound to % AGP binding using equation 12. (HPLC conditions: 50 mm × 4.6 mm, 5-µm Chiral AGP column [Chiral Technologies Inc.], 1.5 mL/min flow rate, mobile-phase A: 50 mM ammonium acetate pH 7.4; mobile-phase B: 2-propanol, gradient 0 to 35% B from 0 to 3.5 min; 3.5 to 4.5 min 35% B; 4.5 to 5 min 0% B, run time 6 min).
As the gradient retention times are dependent on various HPLC conditions, such as flow rate, dwell volume of the instrument, and column dimensions, it is very important to calibrate the gradient retention times with a set of compounds for which the % binding data are available. In this way, we can convert the gradient retention times obtained on one HPLC system to another and the data can be collated in a database suitable for interlaboratory comparison. It is advisable to measure the retention times of the calibration set of compounds on a daily basis, and using the predefined binding constants the slope and intercept of the calibration lines were determined. Using the actual slope and intercept values on the day and on a particular instrument and column the gradient retention times can be converted to binding constants or to CHIs suitable for inter-laboratory comparison.
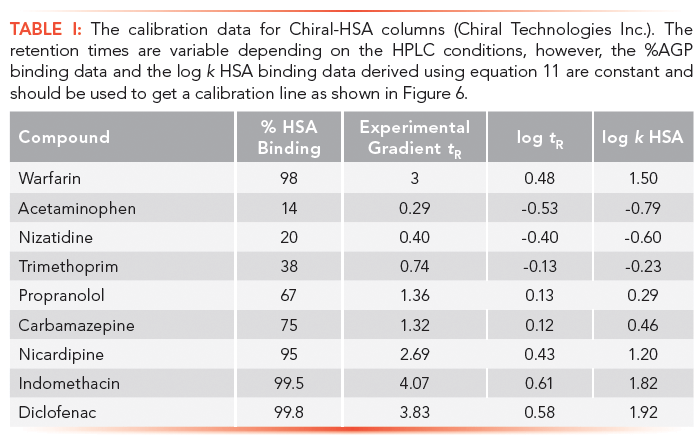
Tables I and II show the suggested compounds for calibrating the retention times obtained on chemically bonded chiral human serum albumin and alpha-1-acid glycoprotein stationary phases, respectively.
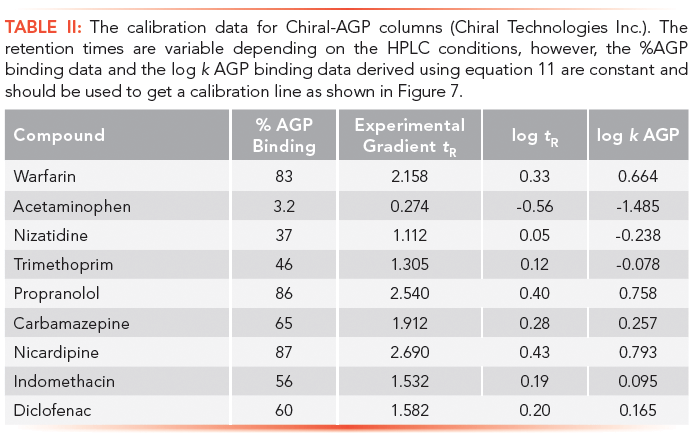
The column is suitable for measuring binding data if the calibration line has regression coefficient (r2) greater than 0.96. The log k (HSA) or log k (AGP) can be calculated using the slope and intercept values and the measured tR values. Equation 12 shows how to calculate the % binding data from the log k data.

In their native form both HSA and AGP can separate the warfarin enantiomers. Therefore, the warfarin enantiomer separation should be checked before using the protein phases for binding measurements. It is important to understand that during the chromatographic process the compound partitions between the stationary phase and the mobile phase, so the retention time is proportional to the partition–distribution coefficient and does not measure the compound's binding to one specific binding site. Some compounds, such as warfarin, bind specifically and strongly to one specific binding site on albumin. When this is the case, the retention time may be dependent on the injected amount of compound. Therefore, the smallest possible amount of sample should be injected so that the compound will not saturate the specific binding site. The usual injection amount is 3 µL to 5 µL of 1 mM to 10 mM stock solution. Wide peaks with tailing are often observed on the protein stationary phases. This is a result of the slower onset and offset rate of the compound's partitioning into the protein than to the chromatographic distribution process. In theory, the rate of binding from the peak width could be measured if the peak width could be calibrated with a compound that has a measured onset and offset rate using another measurement technique, such as surface plasmon resonance (SPR).
The immobilized artificial membrane (IAM) phase was developed by Pidgeon and colleagues (19) with the aim to emulate the lipid membrane on a solid surface. The commercialized version of this column contains the phosphatidylcholine head group and mimics the phospholipid membrane monolayer. A compound's partitioning to this stationary phase reveals the phospholipid affinity of the compound necessary to achieve permeability. However, very strong affinity reduces the compound's permeability through the membrane bilayer because the compound prefers to stay inside the membrane. These compounds usually cause membrane disruption or phospholipid metabolism disorder (phospholipidosis) in the cells.
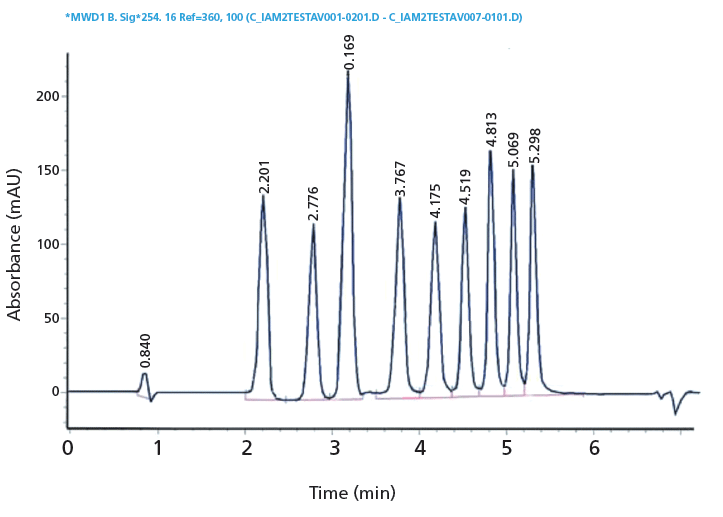
Figure 8: A chromatogram of the IAM.PC.DD2 calibration mixture obtained by using a 100 mm × 4.6 mm, 10-µM IAM.PC.DD2 column (Regis Technologies). Conditions as listed in the heading of Table III.
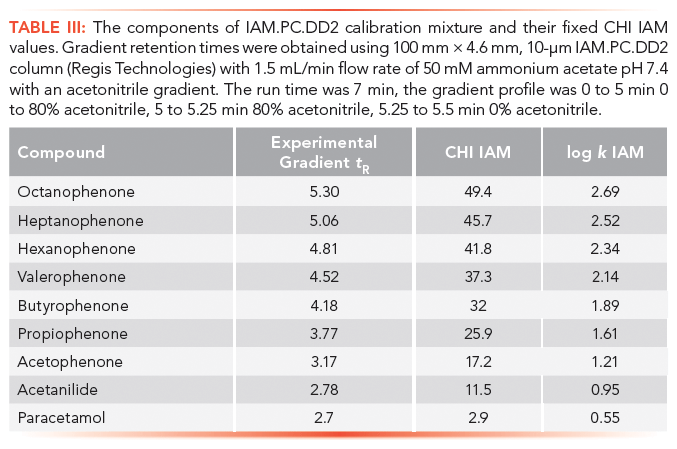
The retention times on IAM stationary phases are calibrated using acetophenone homologues based on their isocratically determined CHI values approximate to the acetonitrile concentration in the mobile phase that gives log k = 0 retention factor (20). Table III contains the compounds used for IAM calibration with gradient retention time values and the fixed CHI IAM values. Figure 8 shows the chromatogram of the IAM calibration mixture used. The CHI IAM values also show good correlation with the extrapolated logarithmic retention factors from the 0% organic phase concentration determined isocratically. The log k IAM values can be calculated from the CHI IAM values as shown by equation 13.

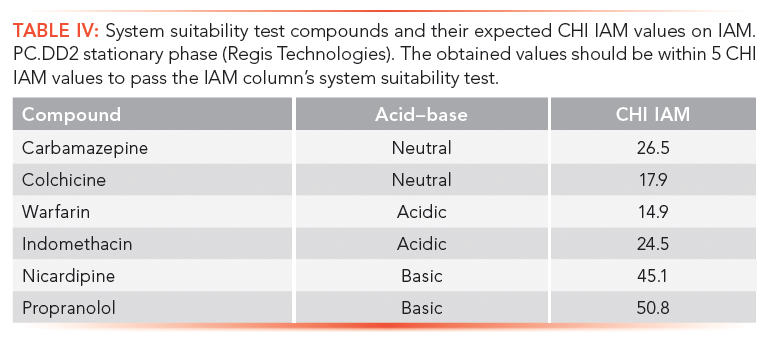
Faster gradients and shorter run times, as well as different column dimensions, can be used if the measured gradient retention times show a linear correlation with the given CHI IAM values in Table III. It was found that when positively and negatively charged drug molecules are analyzed on an IAM stationary phase, the positively charged compounds gave longer retention times and higher CHI IAM values relative to the isolipophilic neutral compounds. Negatively charged compounds, however, have shorter retention times. Therefore, a system suitability test is suggested to check the natural status of the phosphatidylcholine head groups on the stationary phase. Table IV contains the suggested set of compounds that should be run to check the system suitability for obtaining correct CHI IAM values that can be used in in vivo distribution models. This will be discussed in part II of this article.
Comparison of Various Biomimetic Properties
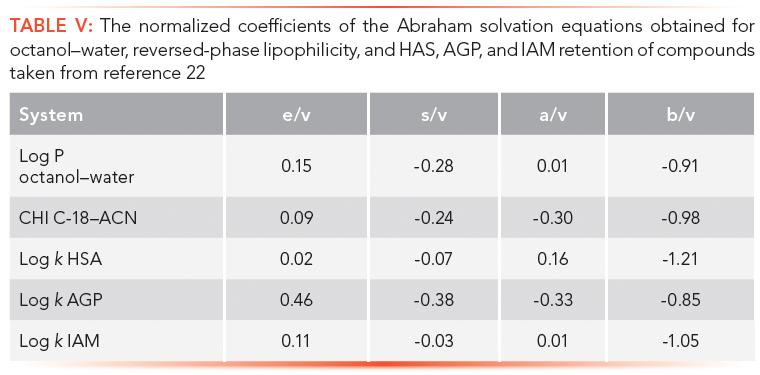
How to standardize the measurements of the properties of drug discovery compounds using HSA, AGP, and IAM biomimetic stationary phases has been described. It is important to know how these properties relate to each other and to the widely applied octanol–water partition–distribution coefficients log P–D. The Abraham solvation equation approach (21) can be used to set up linear regression equations using the measured properties and the known molecular descriptors like excess molar refraction (E), dipolarity–polarizability (S), H-bond acidity (A), H-bond basicity (B), and the McGowan volume (V) for a set of 30–50 compounds that are not charged at pH 7.4. The coefficients of the molecular descriptors are characteristic to the phase system. To help the comparison, we can divide each coefficient by the coefficient of the McGowan volume that measures the size of the molecules. This coefficient can be considered the same when water is one of the phases in the distribution process. Table V shows the coefficients obtained for octanol–water log P, reversed-phase lipophilicity (C18 CHI), HSA, AGP, and IAM retention.
The major differences in the various measurements are in their sensitivity toward H-bond acidity. The protein and phospholipid binding measured by the HSA and the IAM retention of compounds are very similar to the octanol–water system that was proposed to model the biological partition–distribution properties of drugs. This is why the octanol–water system has been successfully used in drug discovery over a period of time. However, when the measured IAM binding and the HAS binding for a set of known drugs that contained both positively and negatively charged compounds was plotted, large differences between the two types of binding were found (Figure 9). The HSA and IAM binding shows good correlation for neutral compounds only. The positively charged basic compounds show stronger IAM binding, while the negatively charged compounds show stronger albumin binding. The octanol–water log D is lower for both the positively charged and negatively charged compounds. This is when the octanol–water model fails to follow the biologically important binding properties.
Conclusions
The chromatographic retention factor in isocratic mode is directly related to the compound's distribution between the mobile and the stationary phases. When protein and phospholipid stationary phases are used, the retention factor reveals the compound's interaction and partition into proteins and lipids. The isocratic retention factors showed good correlation to the gradient retention times. It was also shown that the gradient retention times are in linear relationship with the protein and phospholipid binding data transformed as log K values similar to the logarithmic partition coefficients obtained by other methods, such as equilibrium dialysis. In the following article on this subject, the models for in vivo volume of distribution and drug efficiency will be shown using measured biomimetic data, which have been described here.
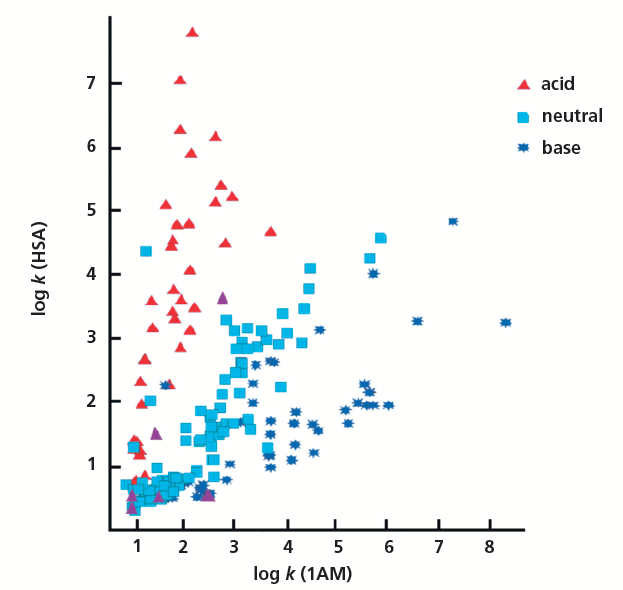
Figure 9: The plot of IAM and HSA binding measured for marketed drug molecules taken from reference 16.
In part II of this article, the in vivo models for volume of distribution, unbound volume of distribution, brain tissue binding, blood binding, and lung tissue binding will be discussed. The advantages of biomimetic properties over the traditional octanol–water lipophilicity will be demonstrated using data for marketed drugs.
References
(1) C. Horváth, W. Melander, and I. Molnár, J. Chromatogr. A 125(1), 129–156 (1976).
(2) A. Vailaya and C. Horváth, J. Phys. Chem. B American Chemical Society 101(30), 5875–5888 (1997).
(3) K. Valkó, L.R. Snyder, and J.L. Glajch, J. Chromatogr. A 656(1–2), 501–520 (1993).
(4) M. Harnisch, H.J. Möckel, and G. Schulze, J. Chromatogr. A 282, 315–332 (1983).
(5) M. Janicka, L. Kwietniewski, and N.U. PeriÅic-Janjic, Chromatographia 763(S13), S87–93 (2006).
(6) M. Janicka, J. Liq. Chromatogr. Relat. Technol. 32(19), 2779–2794 (2009).
(7) K. Valkó, J. Liq. Chromatogr. Relat. Technol. 7, 1405–1424 (1984).
(8) C.M. Du, K. Valko, C. Bevan, D. Reynolds, and M.H. Abraham, Anal. Chem. 70(20), 4228–4234 (1998).
(9) K. Valko, C.M. Du, C. Bevan, D. Reynolds, and M.H. Abraham, Curr. Med. Chem. 8(9), 1137–1146 (2001).
(10) R.J. Young, D.V.S. Green, C.N. Luscombe, and A.P. Hill, Drug Discov. Today 16(17–18), 822–830 (2011).
(11) M.H. Abraham, Chem. Soc. Rev. 22(2), 73 (1993).
(12) M.H. Abraham, H.S. Chadha, G.S. Whiting, and R.C. Mitchell, J. Pharm. Sci. 83(8), 1085–1100 (1994).
(13) K. Valko, C.M.M. Du, C. Bevan, D.P.P. Reynolds, and M.H. Abraham, Curr. Med. Chem. 8(9), 1137–1146 (2001).
(14) F. Lombardo, M.Y. Shalaeva, K.A. Tupper, and F. Gao, J. Med. Chem. 44(15), 2490–2497 (2001).
(15) A. Berthod and S. Carda-Broch, J. Chromatogr. A 1037(1–2), 3–14 (2004).
(16) K. Valko, S. Nunhuck, C. Bevan, M.H. Abraham, and D.P. Reynolds, J. Pharm. Sci. 92(11), 2236–2248 (2003).
(17) N.A. Kratochwil, W. Huber, F. Müller, M. Kansy, and P.R. Gerber, Biochem. Pharmacol. 64(9), 1355–1374 (2002).
(18) N.A. Kratochwil, W. Huber, F. Müller, M. Kansy, and P.R. Gerber, Curr. Opin. Drug Discov. Devel. 7(4), 507–512 (2004).
(19) C. Pidgeon et al., J. Med. Chem. 38(4), 590–594 (1995).
(20) K. Valko, C.M. Du, C.D. Bevan, D.P. Reynolds, and M.H. Abraham, J. Pharm. Sci. 89(8), 1085–1096 (2000).
(21) M.H. Abraham, Pure & Appl. Chem. 65(12), 2503–2512 (1993).
(22) K.L. Valkó, J. Pharm. Biomed. Anal. 130, 35–54 (2016).
New TRC Facility Accelerates Innovation and Delivery
April 25th 2025We’ve expanded our capabilities with a state-of-the-art, 200,000 sq ft TRC facility in Toronto, completed in 2024 and staffed by over 100 PhD- and MSc-level scientists. This investment enables the development of more innovative compounds, a broader catalogue and custom offering, and streamlined operations for faster delivery. • Our extensive range of over 100,000 high-quality research chemicals—including APIs, metabolites, and impurities in both native and stable isotope-labelled forms—provides essential tools for uncovering molecular disease mechanisms and exploring new opportunities for therapeutic intervention.
New Guide: Characterising Impurity Standards – What Defines “Good Enough?”
April 25th 2025Impurity reference standards (IRSs) are essential for accurately identifying and quantifying impurities in pharmaceutical development and manufacturing. Yet, with limited regulatory guidance on how much characterisation is truly required for different applications, selecting the right standard can be challenging. To help, LGC has developed a new interactive multimedia guide, packed with expert insights to support your decision-making and give you greater confidence when choosing the right IRS for your specific needs.

.png&w=3840&q=75)

.png&w=3840&q=75)


.png&w=3840&q=75)


.png&w=3840&q=75)

