Mixing and Mixers in Liquid Chromatography—Why, When, and How Much? Part 2, Injections
LCGC Europe
Is a mixer needed between the injector and column in high performance liquid chromatography (HPLC)?
Is a mixer needed between the injector and column in high performance liquid chromatography (HPLC)?
In the previous instalment of “LC Troubleshooting” (1), I reviewed the basic working principles behind the two most commonly used liquid chromatography (LC) pump designs in use today-so-called low- or highâpressure mixing systems. I then discussed why using a mobile phase mixer between the fluid convergence point at the pump and the sample injector is needed in both cases, albeit for different reasons. Finally, I showed the effect of using mixers with different volumes for different separation conditions, and discussed some of the advantages and disadvantages associated with changing mixer volumes.
This month I am continuing with the theme of mixing and mixers, but this time focusing on what happens when we inject a sample into the mobile phase stream, particularly in cases where there is a mismatch between the compositions of the two fluids. This mismatch most commonly exists as a difference in solvent composition (for example, injecting an analyte dissolved in 100% acetonitrile into a mobile phase of 20:80 acetonitrile–water) between the sample and mobile phase. However, there are certainly situations where differences in the pH or buffer composition of the two fluids can also be very important.
It is most certainly true that there are many analytical situations where the effect of the injected solvent is practically negligible; for example, injecting 1 µL of sample into a 150 mm × 4.6 mm internal diameter (i.d.) column that has a volume of about 1.5 mL. However, I also think many practitioners of LC are surprised to learn just how serious the effect of the injected sample solvent can be, most commonly when they observe bad results. I am hopeful that this instalment will shed a little more light on these issues, and particularly address the question of whether or not mixing is needed after the injector.
Combining Fluids in LC Systems – Where and How?
Three of the different ways that fluids are brought together in LC systems are illustrated schematically in Figure 1. The first two represent the ways fluids are brought together in either highâpressure or lowâpressure mixing pump systems. Although I discussed the differences between these designs in detail in the previous instalment of “LC Troubleshooting”, the differences are actually quite relevant to the topic of sample injection, and so worth repeating here. In short, the major fundamental difference between the two approaches (Figure 1[a] and 1[b]) is that in the first case the two fluid streams converge in a kind of parallel fashion, so that the two fluids are always in close contact, whereas in the second case small packets of each fluid are introduced into a single fluid path in a kind of serial fashion.
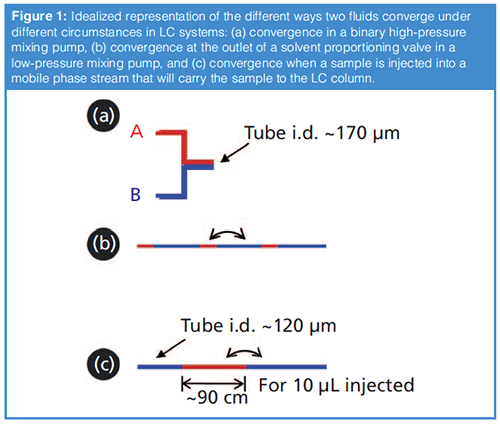
The third scenario of Figure 1 illustrates the way that a sample is introduced into the mobile phase stream for nearly all injectors in use in LC today. This is conceptually similar to the way that fluids are combined in the case of a low-pressure mixing pump; that is, volumes of the fluids are introduced to a single flow path in a serial fashion, or “end to end”. In the case of a typical sample injection, the consequence of this is quite striking. If we assume that a 10 µL portion of sample is injected into a 120 µm (0.005”) i.d. tube leading to the LC column; by dividing the sample volume by the cross-sectional area of the tube we find that the sample could occupy as much as a 90-cm length of this tubing, bracketed on both ends by mobile phase. Given the degree of physical separation of the middle of the sample plug from the closest mobile phase fluid (in this case 45 cm), and the relatively short time it takes for the sample to reach the column under typical conditions (a few seconds), there is absolutely no way that the two fluids will actually mix before the sample reaches the column. And so, this then leads to the question, “Under what circumstances should a physical mixer be deployed to ensure that the sample mixes with the mobile phase before reaching the column?”
Does it Really Matter if the Sample is Mixed with the Mobile Phase?
As with many things, the answer here is “It depends.” In my thinking about this, I divide different situations into two categories-conditions that favour focusing of the analyte at the column inlet, and those that do not. This is most effectively understood by way of example. Figure 2 shows the chromatograms obtained when a simple mixture of alkylphenones is injected into a reversed-phase column followed by solvent gradient elution, but with two different injection conditions. Clearly, the first case (Figure 2[a]) yields a very nice separation, whereas, in the second case (Figure 2[b]), the five compounds are not well separated and the peak shapes are terrible. The difference here is that, in Figure 2(a), the analytes are dissolved in a 30:70 acetonitrile–water mixture, and, in Figure 2(b), a 70:30 acetonitrile–water mixture. The solvent gradient starts at 50% acetonitrile, and runs to 90% acetonitrile at the end of the gradient. We explain this result by recognizing that, in Figure 2(a), the analytes are dissolved in solvent that contains less acetonitrile than the mobile phase itself (50%) at the beginning of the analysis. Under these conditions, the analytes will be well retained by the stationary phase, have a low velocity, and are effectively “stuck”at the column inlet. We say that they are “focused” or “compressed” into a narrow band, and that this narrow width establishes a kind of initial condition from which the rest of the separation (and subsequent peak broadening) develops. This effect has been known for decades (2), but also continues to be a subject of active research (3,4). On the other hand, in Figure 2(b), the sample contains more acetonitrile than the mobile phase at the starting point of the analysis. Under these conditions the analytes will be poorly retained, have a high velocity approaching the mobile phase velocity, and are spread out across a large fraction of the column bed. This too establishes a kind of initial condition for the analyte bands, but, in contrast to Figure 2(a), one that involves very broad peaks, from which the separation cannot recover because the peaks will only get broader as the separation develops.
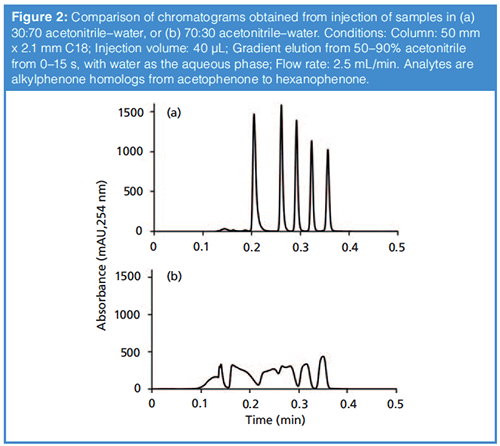
So, to answer the question that heads this section, I would say that, generally speaking, if the injection conditions favour focusing of the analytes at the column inlet, as is the case in Figure 2(a), then no actual mixing of the sample and mobile phase is needed to obtain good results. Indeed, the chromatogram in Figure 2(a) is convincing evidence for this. Of course there are always exceptions (see discussion later about viscous fingering); however, this view should be pretty broadly applicable. On the other hand, if the injection conditions are not favourable for focusing, as in Figure 2(b), then this can be a real problem, and solving the problem may or may not require a physical mixer, depending on how the solution is implemented.
Dealing with Situations Involving Unfavourable Solvent Mismatch
In my laboratory, we have studied the effect of the composition and volume of the injected sample on separation performance (for example, as in Figure 2) extensively. When I discuss this work with people the two things I hear most commonly are that: 1) extensive mixing of the sample with the mobile phase is needed to achieve good results as in Figure 2(a); and 2), it is physical differences between the sample and mobile phase (for example, viscosity) that are the root cause of poor results (as in Figure 2[b]). Here I’d like to discuss a few results that I think shed some light on these issues.
Viscous fingering is a physical phenomenon that can develop when a less viscous fluid (for example, acetonitrile) is injected into a more viscous one (for example, water) that flows into a porous medium. In this situation, local flow instabilities can develop that produce “fingers” of the injected fluid that appear to reach into the adjacent fluid (in the chromatographic context, the mobile phase). This effect has been known in preparative chromatography for some time, but more recently was also visually demonstrated under analytical scale chromatography conditions by Samuelsson, Fornstedt, and coworkers (5). This, and related work, provides compelling evidence that viscous fingering can occur in analytical chromatography columns and probably leads to effects on chromatographic efficiency (that is, plate number, or plate height) that cannot be accounted for using simple plate models of chromatography.
In our own work, we have adapted a simple plate model of liquid chromatography that enables us to simulate the effects of sample solvent composition and volume on chromatographic peak shape and efficiency (4,6). To summarize a great deal of work in this direction, I would say that, by using this simple plate model, we can account for a large majority of the effects of sample solvent composition and volume on peaks that we observe in real experiments without invoking the effects of more complex processes, such as viscous fingering (for example, we have been able to faithfully predict results like those shown in Figure 2 [4]). Nevertheless, there are some differences between simulation and experimental results that we cannot account for, and it is possible that the viscous fingering could explain some of these differences. Clearly more work on this is needed to more fully understand these effects.
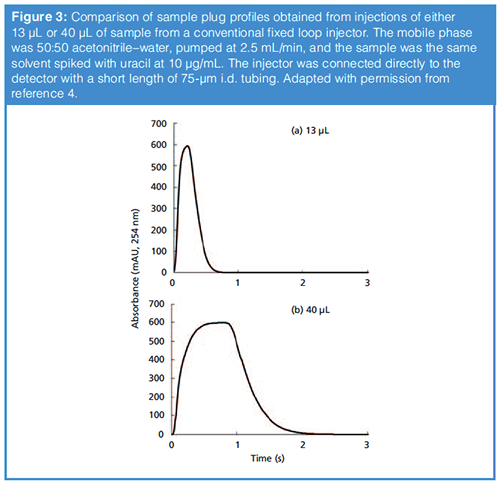
Our work on this topic has yielded some experimental results that are instructive here. First, the peaks shown in Figure 3 were obtained from experiments aimed at understanding the shape of the injected sample plug injected into the second dimension column in two-dimensional liquid chromatography (2D-LC). In this case the mobile phase was 50:50 acetonitrile–water, and the sample was the same solution but spiked with 10 µg/mL of uracil, which is used to trace the concentration profile by UV absorbance detection. In other words, the uracil is a proxy for other sample solvent components, such as acetonitrile. These experiments are done without a column installed, such that the profile we observe is essentially the sample profile as it would enter the LC column. The point I want to emphasize here is that even with a relatively small injection volume of 13 µL, there is a point in the centre of the profile where the fluid that is detected is essentially pure sample. In other words, there is very little mixing between the centre of the sample plug and the surrounding mobile phase. I think this is relatively easy to understand when we imagine what happens inside the system using the illustration in the third case of Figure 1. The practical consequence of this, then, is that if we have analytes dissolved in a sample with a high concentration of acetonitrile and we inject this into a mobile phase with a much lower concentration of acetonitrile, there will be a point where the sample solvent acts as the mobile phase inside the column because there is insufficient mixing with the surrounding mobile phase. This brings us back to the question, “Should we install a mixer between the injector and the column?” The main problem with installing a simple mixer (think spinning stir-bar) in this context is that effective mixing of the sample will require a relatively large volume mixer, which will both effectively increase the volume of the injected sample, and add gradient delay volume to the system. If neither of these issues is detrimental for the analysis at hand, then adding such a mixer could be a good solution to the problem. In our own work on the sample solvent problem in the context of 2D-LC where analysis time is a precious resource, we have developed an approach referred to as “active solvent modulation” (ASM) that works quite well (7).
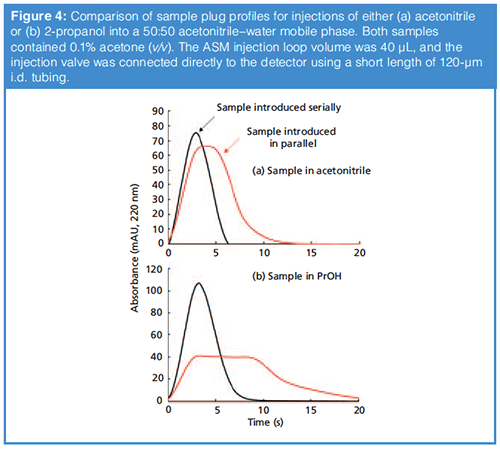
The last bit of data I’d like to discuss here actually comes from our work on ASM where an injected sample is mixed with the mobile phase stream in more of a parallel fashion (that is, like converging streams in Figure 1[a]) than the more typical serial fashion (as in Figure 1[c]). Figure 4 shows a comparison of the sample plug profiles observed when the injected sample is brought together with mobile phase in a serial fashion (black traces), or in a parallel fashion (red traces). In these cases, the mobile phase was 50:50 acetonitrile–water, and the injected sample was acetonitrile (Figure 4[a]), or 2-propanol (Figure 4[b]), each containing 0.1% acetone as a tracer that is observed by UV absorbance detection. There are two main points I’d like to make about these results. First, here, as in Figure 3, we see that in the case of serial sample introduction there is little mixing of the sample with the surrounding mobile phases. On the other hand, when the sample and mobile phase are brought together in a parallel fashion the mixing is very effective, as indicated by the lowered concentration of acetone detected during introduction of the sample plug. Note that the profile is wider in time because the effective volume of the sample plug is increased as it is mixed with mobile phase. The differences in the extent of dilution of the acetone (as indicated by the different peak heights) are related to the different viscosities of the two samples. Second, there are not obvious differences in the sample plug profiles observed for the two sample solvents injected, even though their viscosities vary by a factor of about seven.
Summary
When possible it is desirable to match the sample solvent to the mobile phase composition used in a LC method, and use an injection volume that is small relative to the volume of the LC column itself to minimize the effects of the injected sample on separation performance. However, there are some situations where this is not possible because of limitations on analyte solubility, or the need to inject large volumes to improve detection sensitivity. In these situations it is helpful to have a detailed understanding of what happens during the injection process. In situations where the relationship between the properties of the sample solvent and the mobile phase favour analyte focusing, most likely a mixer is not needed between the injection point and the LC column. However, if the situation does not favour analyte focusing, this can lead to very bad results (see for example, Figure 2[b]), and in these cases installing a mixer, or using an alternate means of sample injection may be helpful.
Acknowledgements
I want to thank Gustavus student Hayley Lhotka for collecting the data shown in Figure 4.
References
- D.R. Stoll, LCGC Europe31(10), 558–563 (2018).
- L.R. Snyder and D.L. Saunders, J.Chromatogr. Sci. 7, 195–208 (1969). doi:10.1093/chromsci/7.4.195.
- S.R. Groskreutz and S.G. Weber, J. Chromatogr. A1409, 116–124 (2015). doi:10.1016/j.chroma.2015.07.038.
- D.R. Stoll, R.W. Sajulga, B.N. Voigt, E.J. Larson, L.N. Jeong, and S.C. Rutan, J. Chromatogr. A.1523, 162–172 (2017). doi:10.1016/j.chroma.2017.07.041.
- J. Samuelsson, R.A. Shalliker, and T. Fornstedt, Microchem. J.130, 102–107 (2017). doi:10.1016/j.microc.2016.08.007.
- L.N. Jeong, R. Sajulga, S.G. Forte, D.R. Stoll and S.C. Rutan, J. Chromatogr. A1457, 41–49 (2016). doi:10.1016/j.chroma.2016.06.016.
- D.R. Stoll, K. Shoykhet, P. Petersson, and S. Buckenmaier, Anal. Chem.89, 9260–9267 (2017). doi:10.1021/acs.analchem.7b02046.
Dwight R. Stoll is the editor of “LC Troubleshooting”. Stoll is a professor and co-chair of chemistry at Gustavus Adolphus College in St. Peter, Minnesota, USA. His primary research focus is the development of 2D-LC for both targeted and untargeted analyses. He has authored or coauthored more than 50 peerâreviewed publications and three book chapters in separation science and more than 100 conference presentations. He is also a member of LCGC’s editorial advisory board. Direct correspondence to: LCGCedit@ubm.com

Regulatory Deadlines and Supply Chain Challenges Take Center Stage in Nitrosamine Discussion
April 10th 2025During an LCGC International peer exchange, Aloka Srinivasan, Mayank Bhanti, and Amber Burch discussed the regulatory deadlines and supply chain challenges that come with nitrosamine analysis.


