Stationary Phase Selectivity: The Chemistry Behind the Separation
LCGC Europe
“The column is the heart of the separation.” Perhaps more accurately, the column is where the chemistry that generates a separation happens. For chemists and non-chemists alike, the chemistry that drives the utility of a column to solve a separation problem can be complex and confusing. Selectivity describes the ability of a column to effect a separation. This instalment of “GC Connections” focuses on selectivity, its definition, and its importance for generating separations and resolution. We will also see how selectivity is the concept that underlies the idea of column polarity. We begin by asking two simple questions about common observations, then extend these observations into a capillary gas chromatography (GC) column, and conclude with an introduction to methods for evaluating the quality, selectivity, and polarity of a stationary phase or column.
“The column is the heart of the separation.” Perhaps more accurately, the column is where the chemistry that generates a separation happens. For chemists and non-chemists alike, the chemistry that drives the utility of a column to solve a separation problem can be complex and confusing. Selectivity describes the ability of a column to effect a separation. This instalment of “GC Connections” focuses on selectivity, its definition, and its importance for generating separations and resolution. We will also see how selectivity is the concept that underlies the idea of column polarity. We begin by asking two simple questions about common observations, then extend these observations into a capillary gas chromatography (GC) column, and conclude with an introduction to methods for evaluating the quality, selectivity, and polarity of a stationary phase or column.
Why does a puddle evaporate? The next time it rains, observe the puddles of water on the sidewalk or street after the storm is over. As we know, the water evaporates at the air temperature, say 25 °C, yet the boiling point of water is 100 °C and the water still evaporates. This is a result of the vapour pressure of water. Water will continue to evaporate until the air above the puddle becomes saturated (100% relative humidity). This relationship can be expressed chemically by the following equation:

[1]
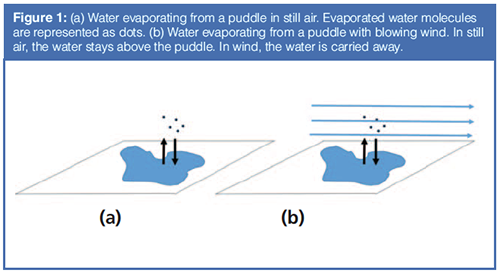
The vapour pressure of the water is represented as PH2O, and Kp is the pressure-based equilibrium constant for the evaporation process. Figure 1 shows a stylized puddle. Figure 1(a) shows some water molecules, represented by dots, evaporating on a calm (no wind) day. Figure 1(b) shows the same puddle, but with the wind blowing. In which situation does the water evaporate faster? On the calm day, there is no wind to carry the evaporated water molecules away, so the air above the puddle becomes more saturated and evaporation slows down. On the windy day, the wind carries water molecules away, so the air above the puddle does not approach saturation and the water evaporates more quickly. In both cases, the system (surface, puddle, and air above it) is driving towards equilibrium, saturation of the air above the puddle. A puddle evaporates faster on a windy day.
Why does rubbing alcohol evaporate faster than water? Try a simple experiment. Rub a small amount of water on your arm. As we know, when the water evaporates, energy transfers from your arm to the water, evaporating the water and making your arm feel cool. Try again with rubbing alcohol. The alcohol evaporates faster and your arm feels cooler. This difference arises from differences in the heat of vaporization and vapour pressure of water and rubbing alcohol. This is an example of selectivity.
The ability of the water (H2O) or alcohol (Alc) to evaporate is governed by simple chemical equations:

[2]
In this case, the rubbing alcohol mixture is considered a single substance as it evaporates as an azeotrope. Rubbing alcohol evaporates faster than water, due to its higher liquid-vapour partition coefficient, thus its higher vapour pressure.
Taking this further into chromatography, all separations are also governed by a similar phase equilibrium. Equation 3 represents the partitioning of an analyte (A) from the mobile phase, the phase in which it enters the column after the injection, into the stationary phase.

[3]
Kc is the partition coefficient for the process of sorption from the mobile phase into the stationary phase. A(mp) refers to an analyte dissolved in or moving in the mobile phase and A(sp) refers to an analyte dissolved in or sorbed on a stationary phase. A higher Kc indicates stronger analyte attraction to the stationary phase, leading to longer retention times.
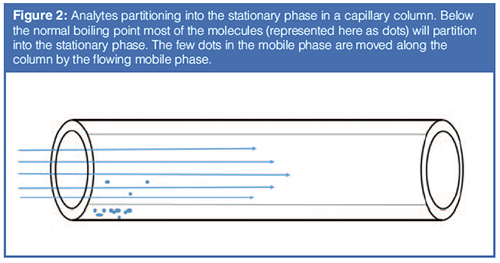
Figure 2 shows this relationship applied to a column with flowing mobile phase. Note how this figure looks very much like the puddle with the wind blowing shown in Figure 1(b). A column in gas chromatography behaves in a manner very similar to a puddle on a windy day, with the analyte being analogous to the puddle, the stationary phase being analogous to the surface, and the mobile phase being analogous to the wind. Like the rubbing alcohol versus water example, if the puddle were a mixture of two liquids, they would evaporate at different rates, based on their vapour pressures. In the column, if there are two analytes they will move at different rates, based on the difference in their partition coefficients and the resulting vapour pressures above the surface. For two analytes to be separated on a column, the difference in partition coefficient gives rise to selectivity, which gives rise to the separation.
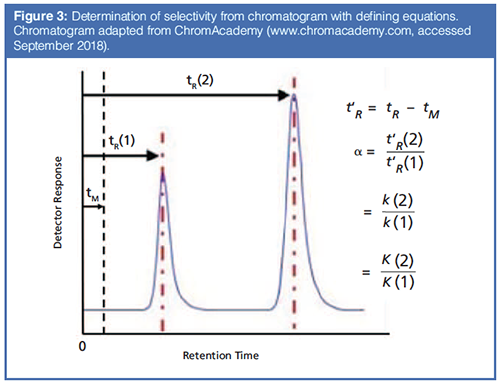
How is selectivity determined and where does it come from? Figure 3 shows the calculation of selectivity from a chromatogram, with the relevant equations. It is simply the ratio of the adjusted retention times (t’R, the difference between the retention time, tR and the gas hold up time tM) of two peaks in the chromatogram. It is also the ratio of the retention factors (k) and the partition coefficients (Kc). Detailed descriptions of the basic theory behind these relationships can be found in most basic textbooks on gas chromatography (GC) (1–3). Ultimately, selectivity comes from thermodynamics. From general chemistry, the Gibbs equation relates the partition coefficient to the standard free energy (4).

[4]
If two analytes are present, as seen in Figure 3, this equation becomes:

[5]
A more detailed description of the thermodynamic relationships involved in gas chromatography can be found elsewhere (5). Selectivity comes from the difference in free energy change for the partitioning of the analyte(s) from the mobile phase into the stationary phase, as seen in equation 3.
We have now seen the fundamental and thermodynamic basis of selectivity. Next, we discuss the impact of selectivity on the separation and resolution.
How does selectivity impact the separation and resolution? The first goal of any chromatographic method development is to optimize the resolution. Looking again at the chromatogram in Figure 3, the resolution may be calculated as the difference between the two retention times divided by the average of the two peak widths.

[6]
If Rs is greater than 1.5, the peaks are baseline separated. To understand the role of selectivity in resolution, the fundamental principles behind resolution in chromatography can be considered using the following equation:

[7]
Resolution is obtained from three basic principles:
- Retention factor (k), which is a measure of how long the analyte is in the column. Too small k (< 2), and there is not enough contact with the stationary phase for the most effective chromatography. Too large k (> 10), and there is a diminishing return with longer time.
- Theoretical plates (N), the measure of column efficiency. The more theoretical plates, the better the resolution.
- Selectivity (α), the separating power of the stationary phase based on differences in the strength of intermolecular interactions between the stationary phase and analyte molecules.
Figure 4 shows two chromatograms with equal selectivity. In Figure 4(a), an example from high performance liquid chromatography (HPLC), the column has 18,285 theoretical plates and in Figure 4(b), in an example from capillary GC, the column has 120,000 theoretical plates. With k being equal, a dramatic effect on resolution is seen. Note that, while the peak maxima are equally spaced in the two chromatograms, the peaks are broader in Figure 4(a), reducing the resolution. In classical packed column GC and in HPLC, with lower N, adjusting the selectivity is critical to obtaining nearly all separations. In today’s capillary GC, selectivity, with high N, is less important but still must be considered.
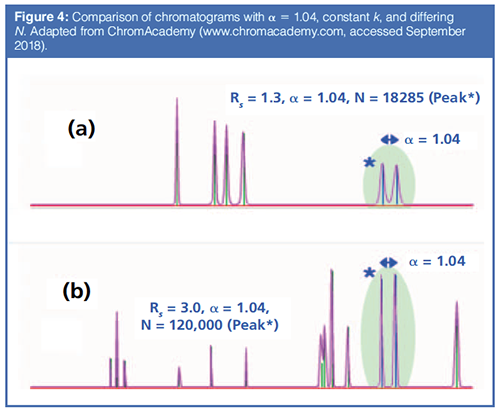
The lower the separation efficiency (low N), the higher the selectivity needed to achieve separation. In most applications, selectivity has a critical impact on separation and resolution. As columns and instruments become more efficient (more theoretical plates, N), the need for high selectivity lessens. In Figure 4(a), a selectivity of 1.04, which could be a nearly 1 min difference in retention time in a 20 min separation, is not sufficient to fully resolve the peaks. If the selectivity calculated by the equations shown in Figure 3 is one (1.00) then the two analytes are not separated at all and cannot be separated no matter how efficient the column and instrument. Fortunately, this is not often the case. Having seen the basics of the thermodynamic background of selectivity, we now turn to methods for evaluating the selectivity of stationary phases and to a better understanding of the term “polar”, which is often used to describe stationary phases in GC. Most of the development of these methods occurred in the early days of GC, when packed columns, with much lower efficiency than capillary columns, were predominant.
What does “polar” really mean in GC? Stationary phases are often described using terms such as “polar”, “nonpolar”, “moderately polar”, and the like. These terms are often used very broadly and can easily generate confusion and misunderstanding. The first problem with descriptions such as “polar” is that they require context. As an example of context, think about other simple terms: “hot” and “cold”. In the environs of New York City, in the winter, a day with a high temperature of 65 oF would be considered unusually hot, while in summer, unusually cold. When describing the weather, the meaning of “hot” and “cold” depends greatly on the environment. The meaning of “polarity” requires similar context. In describing columns, any discussion of “polarity” must be based on specific intermolecular interactions between the stationary phase and the analytes. The strength of these interactions determines the free energy required for the analytes to partition into the stationary phase and therefore determines the selectivity of the stationary phase and, along with the column dimensions, ultimately the separating ability of the column.
Over the years, numerous tests have been developed to evaluate the intermolecular interactions that occur in gas chromatographic columns. These interactions include the same ones we learned about in school: dipole–dipole, dipole–induced dipole, van der Waal forces, acid-base, electrostatic interactions, and hydrogen bonding. These classical studies generally involve injecting test mixtures containing a mix of compounds, each selected to probe a specific interaction. These tests and many other aspects of column evaluation are discussed in great detail in the textbook by Barry and Grob (6).
The Grob test mix, developed in the late 1970s, is the most commonly used mixture for testing the interactions and quality of capillary columns (7,8). Every time you purchase a column, you are provided with a column test mixture chromatogram that either uses the Grob test mix or is based on the principles described in the original papers. Figure 5 shows a typical chromatogram of a column test mix run on a commercially available column, with the test mix components identified. There are several quality tests resulting from this analysis, including reactivity and sensitivity to several intermolecular interactions, column efficiency, and overall separating power. The most important selectivity calculation is the spacing of the fatty acid methyl ester peaks. This spacing must be even as each methylene unit (-CH2-) is added, indicating proper selectivity. The resolution of adjacent peaks, which also results from selectivity is tested, as is the retention time and peak shape of each component, which is determined by the specific intermolecular interactions between that component and the column wall or stationary phase.
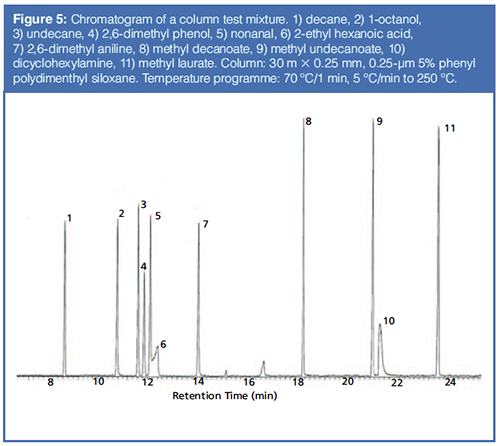
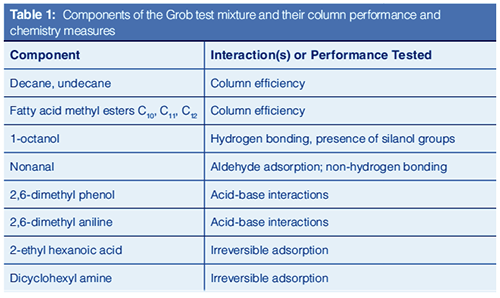
Table 1 lists the Grob test mix components with the specific intermolecular interactions they probe. Comparing Table 1 to the chromatogram shown in Figure 5, basic performance tests such as the spacing and shape of the hydrocarbon and fatty acid peaks indicate a properly installed generally well-performing column. The acceptable shapes of the alcohol, phenol, aldehyde, and aniline indicate a column that should perform well for weaker acids and bases. The very poor shapes of the hexanoic acid and dicyclohexylamine indicate that this column is likely to adsorb stronger acids and bases. The Grob test mix thus provides an excellent snapshot for the quality and performance of a column. Most column manufacturers use their own variation of the Grob test mix to demonstrate column quality and performance.
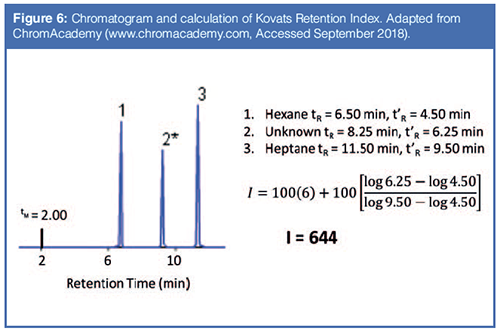
In order to discuss most measures of intermolecular interactions with proper context, retention time data must be corrected to account for differences in column dimensions, including length, inside diameter, and stationary phase film thickness. The classical means for this is known as calculating the Kovats Retention Index for each analyte using equation 8 (9).

[8]
The subscript u refers to the analyte. The subscript x refers to the number of carbon atoms in the normal alkane eluting immediately prior to the analyte. The subscript x+1 refers to the number of carbon atoms in the normal alkane eluting immediately following the analyte. For example, an analyte eluting between hexane (C6) and heptane (C7) might have a Kovats Retention Index of 650. An example calculation is shown in Figure 6. In theory, the Kovats Retention Index is linearly related to the free energy change for the sorption process into the stationary phase, as described in equation 5, and it accounts for differences in the column dimensions. The Kovats Retention Index of an analyte is a constant for a given stationary phase and temperature and is independent of column length, internal diameter, and film thickness.
In the 1960s, based on Kovats Retention Indexes, two systems for assessing stationary phase polarity, or really the strength of a stationary phase for separating various classes of compounds were developed by Rorhschneider and McReynolds (10,11). These are used in column evaluation and are most commonly termed MeReynolds Constants. The experiment is simple. A test mixture is injected under isothermal conditions and the Kovats Retention Index of each analyte is determined and compared to the retention index of that test analyte on a standard nonpolar stationary phase. The McReynolds constant for that analyte on that column at the given temperature is the difference between the measured retention index and the standard retention index. A list of the five most common test probes with the interactions they were proposed to probe is given in Table 2 and some constants for common stationary phases are given in Table 3 (12,13). Table 3 also includes Mondello polarity numbers, described below.
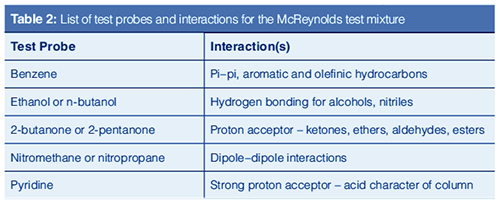
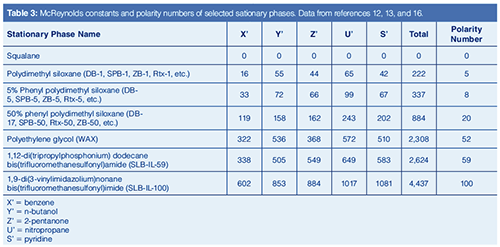
McReynolds constants can be used to estimate the ability of a stationary phase to separate analytes of various compound classes. For example, a high McReynolds constant for benzene indicates a stationary phase with strong pi–pi interactions and ability to separate aromatic analytes. If the McReynolds constants are high for all of the test probes, the stationary phase may be accurately described as “polar”. Note that a column may have a high constant for one test probe but a lower constant for another, indicating different degrees of “polarity” depending on the analyte. McReynolds constants provide the necessary context for describing whether a stationary phase is “polar”. In general, as the McReynolds constants increase, the stationary phase may be described as more polar.
This discussion leads to the final question: How polar is my column? This topic has seen renewed interest with the advent of ionic liquids as stationary phases for capillary GC in the mid-2000s (14,15). An ionic liquid is a molten organic salt that is in the liquid phase at or near room temperature. As stationary phases, ionic liquids are considered highly polar, plus they have low vapour pressure and do not decompose at the temperatures normally employed in GC. They seem to extend the polarity range of stationary phases available in capillary GC. An interesting difference between ionic liquid stationary phases and most traditional capillary GC stationary phases is that the ionic liquids are liquid salts whereas the traditional stationary phases are liquid polymers. At a molecular level, the actual partitioning process may be different for ionic liquid columns than for traditional polymeric columns. This possibility merits further research.
In 2011, while evaluating the new ionic liquid stationary phases, Mondello developed a straightforward overall column polarity scale, based on McReynolds constants (16). These values for some stationary phases are included in Table 3. To determine the polarity number, the five McReynolds constants are totalled, and then the ratio of this total to the total for a highly polar ionic liquid column (SLBâIL100) is expressed with the SLB-IL100 column having the value 100. Squalane is the standard nonpolar stationary phase for McReynolds constant determination (All McReynolds constants and polarity number are zero), but in practice, it is rarely used with capillary columns. The classical nonpolar phases, polydimethyl siloxane and 5% phenyl polydimethyl siloxane, have very low polarity numbers, so they are accurately described as nonpolar. 50% phenyl polydimethyl siloxane stationary phase, long considered moderately polar, shows a polarity number of 20, while polyethylene glycol phase, traditionally considered among the most polar capillary column stationary phases, only reaches a polarity number of 52.
Broad descriptions of polarity and polarity numbers are useful but with caution. In Table 3, the n-butanol McReynolds constant is higher for polyethylene glycol then for SLBâIL-59, yet the overall polarity number is lower. SLB-IL-59 is an overall more polar stationary phase, yet polyethylene glycol is likely to more strongly retain polar alcohols. Results such as this and the advent of ionic liquid columns are leading to new thinking about column polarity and how it is described.
Conclusions
The ability of a stationary phase to perform a separation is based on selectivity, the difference in the strength of intermolecular interaction between each analyte and the stationary phase. Selectivity derives from the partitioning process for the analytes between the mobile and stationary phases and it plays a key role in the ability to achieve desired resolution. Column quality and polarity are also determined by the intermolecular interactions that occur between compound classes of interest and the stationary phase. Methods including the Grob test mix, McReynolds constants, and polarity numbers provide the tools to analyze these interactions and to better understand the chemistry behind the separation.
References
- H.M. McNair and J.M. Miller, Basic Gas Chromatography, (John Wiley and Sons, New York, USA, 2nd ed., 2009).
- C.M. Poole, Ed., Gas Chromatography (Elsevier, Amsterdam, 2012).
- R.L. Grob, Ed., Modern Practice of Gas Chromatography (John Wiley and Sons, New York, USA, 4th ed., 2004).
- N. Tro, Chemistry: A Molecular Approach, (Pearson, New York, USA, 4th Ed., 2016) Chapter 18.
- N.H. Snow, J. Chem. Educ. 73(7), 592–597 (1996).
- E.F. Barry and R.L. Grob, Columns for Gas Chromatography Performance and Selection (John Wiley and Sons, New York, USA, 2007).
- K. Grob, Jr., G. Grob, and K.J. Grob, Chromatogr.156, 1–20 (1978).
- K. Grob, Jr., G. Grob, and K.J. Grob, Chromatogr. 219, 13–20 (1981).
- E. Kovats, Helv. Chim. Acta41, 1915–1932 (1958).
- L. Rohrschneider, J. Chromatogr.22, 6–22 (1966).
- W.O. McReynolds, J. Chromatogr. Sci. 8, 685–691 (1970).
- “Technical Bulletin 880: The Retention Index System in Gas Chromatography: McReynolds Constants”, Sigma-Aldrich, https://www.sigmaaldrich.com/Graphics/Supelco/objects/7800/7741.pdf (Accessed September, 2018).
- E.F. Barry and R.L. Grob, Columns for Gas Chromatography Performance and Selection (John Wiley and Sons, New York, USA, 2007), pp. 32–44.
- C. Yao and J.L. Anderson, J. Chromatogr. A1216, 1658–1712 (2009).
- “Introduction to Ionic Liquid Columns” https://www.sigmaaldrich.com/content/dam/sigma-aldrich/docs/Supelco/Posters/1/ionic_liquid_gc_columns.pdf (Accessed September, 2018).
- C. Ragonese, D. Sciarrone, P.Q. Tranchida, P. Dugo, G. Dugo, and L. Mondello, Anal. Chem.83, 7947–7954 (2011).
Nicholas H. Snow is Founding Endowed Professor in the Department of Chemistry and Biochemistry at Seton Hall University. He is also the university’s Director of Research and Adjunct Professor of Medical Science. During his 30 years as a chromatographer, he has published more than 60 refereed articles and book chapters and has given more than 200 presentations and short courses. He is interested in the fundamentals and applications of separation science, especially gas chromatography, sampling, and sample preparation for chemical analysis. His research group is very active, with ongoing projects using GC, GC–MS, two-dimensional GC, and extraction methods including headspace, liquid–liquid extraction, and solid-phase microextraction.
“GC Connections” editor John V. Hinshaw is a Senior Scientist at Serveron Corporation in Beaverton, Oregon, USA, and a member of LCGC Europe’s editorial advisory board. Direct correspondence about this column to the author via e-mail: LCGCedit@ubm.com

Removing Double-Stranded RNA Impurities Using Chromatography
April 8th 2025Researchers from Agency for Science, Technology and Research in Singapore recently published a review article exploring how chromatography can be used to remove double-stranded RNA impurities during mRNA therapeutics production.
The Effect of Time and Tide On PFAS Concentrations in Estuaries
April 8th 2025Oliver Jones and Navneet Singh from RMIT University, Melbourne, Australia discuss a recent study they conducted to investigate the relationship between tidal cycles and PFAS concentrations in estuarine systems, and offer practical advice on the sample preparation and LC–MS/MS techniques they used to achieve the best results.


