Measuring Gas Flow for Gas Chromatography
LCGC North America
Comparison of gas flow measurement methods for GC laboratories
A comparison of various gas flow measurement methods for gas chromatography (GC) users — bubble, mass flow, and volumetric flowmeters — as well as the built-in capillary column flow measurements found in GC systems
Obtaining and reproducing accurate, repeatable flow measurements is of great importance to chromatographers. The quantitative accuracy of their instruments depends on being able to accurately set and measure flow rates for columns, splitters, and detectors, while the robustness of gas chromatography (GC) methods relies on the repeatability and reproducibility of flow measurements over time and across diverse laboratories. Gas flow measurements present unique challenges because of gas compressibility and the different operating principles of the various flow measurement devices.
Gas flow measurements for GC can be divided into three regimes. First are high flows from about 30 cm3/min up to 400 cm3/min. Flows of this magnitude typically are found in detector fuel or makeup gases and in split–splitless inlets. These flows generally are easy to measure and usually are not subject to large errors. The second flow regime falls between 5 and 30 cm3/min. These are the carrier-gas flow rates of typical packed and larger-bore capillary columns. The lower end of this range can be difficult to measure with conventional flowmeters. The third flow regime lies at 5 cm3/min and lower. Open-tubular (capillary column) carrier-gas flows are in this range and can be difficult to measure with sufficient accuracy using external flow measuring devices. The average linear carrier-gas velocity is a superior metric for gauging column flow.
Instead of relying on external meters to set and measure flows, chromatographers with modern GC systems can use computer-controlled pneumatics to supply and control pressures and flows across the entire range from <1 to >400 cm3/min. These GC instruments use various types of flow control and measurement technologies, all of which should be validated and calibrated on a regular schedule, if possible.
Computer-controlled pneumatics require correct gas identity settings. For open-tubular column systems, additional values must be accurately stated for the column length, inner diameter, and, preferably, the stationary phase film thickness. Gross errors such as setting helium carrier when hydrogen is being used or setting 320 µm for a 250-Qm i.d. column will result in obvious deviations. A quick check of the average carrier-gas linear velocity will easily reveal such errors. The effects of slight errors in these column dimension settings were discussed in a recent "GC Connections" installment (1).
Validation and calibration of computer-controlled pneumatics is a topic for a future "GC Connections" installment. The various types of conventional external flowmeters also require careful attention to individual meter characteristics, and this month's installment addresses their care, use, and operation.
Volumetric or Mass Flow?
Chromatographers should account for gas compressibility to measure instrument flows with sufficient accuracy. Unlike liquid mobile phases, carrier gas expands as it flows along a chromatography column. A fixed mass of carrier gas that occupies 1 cm3 at the column inlet will occupy a larger volume at the column outlet. On the way out of the column and detector the gas volume decreases as its temperature decreases to room temperature. This variability of gas volumes at different temperatures and pressures makes flow measurements inconsistent without specifying the conditions at which a volume of gas flow per unit time is expressed.
All of the gas flows eventually end up at room temperature and pressure, so room conditions would seem like a good choice for flow measurement reporting. But room conditions vary over time, and even though these variations are not as large as those encountered along the column itself, they can have a significant effect on flow measurements.
To rectify these compressibility effects and allow for more accurate comparison of flows measured under different conditions, it is useful to express gas flow rates in terms of the number of moles of gas that flow per unit time, instead of as a purely volumetric rate. If we assume that GC gases obey universal gas laws then the moles of gas in any particular volume at a stipulated temperature and pressure will be constant. A 1-cm3 volume of an ideal gas at standard temperature and pressure (STP) conditions of 273.15 K (0 °C) and 101.325 kPa (14.696 psia or 1.0 atm) contains 4.46 × 10⁻⁵ mol.
The flow rate of a standardized cubic centimeter of gas is commonly, but incorrectly, referred to as mass flow. Each gas has a different density at standard conditions, so the mass contained in a standard volume is different for various gases. A 1-cm3 volume of helium at the above STP conditions contains a mass of 0.179 mg, while the same volume of nitrogen contains 1.25 mg, and the contained mass of hydrogen is 0.09 mg. Strictly speaking, then, the so-called mass flow of a gas should be multiplied by the gas density to obtain the true mass flow. Usually, in routine GC there is no need to know the actual mass that flows through a column or detector, so gas chromatographers comfortably refer to standardized volumetric flow rates as mass flow rates.
An ideal gas flow rate that was measured at some known temperature and pressure can be adjusted for compressibility to its flow at standard conditions with equation 1:

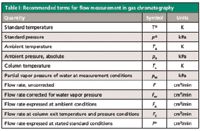
In equation 1, the superscript "o" designates standard or reference conditions, and the subscript "a" designates ambient conditions — the conditions at which a flowmeter reading was obtained. See Table I for a list of common terms for related pressures and flows.

Table I: Recommended terms for flow measurement in gas chromatography
For example, if the column flow rate, Fa, reads 3.4 cm3/min on an uncorrected flowmeter standing next to the GC system when the room temperature was 25 °C and the ambient pressure was 100.2 kPa, then the corrected flow, Fo , at STP conditions of 0 °C and 101.325 kPa would be

Don't forget to convert temperatures from Celsius degrees to kelvin degrees. Quantities in this article are expressed in SI units (International System of Units, or Système Internationale d'Unités) according to the guidance in IEEE/ASTM SI 10-2002 (2), along with some non-SI or equivalent units that are often used. Table II lists conversion factors between several commonly used pressure units.

Table II: Pressure conversion factors* (3)
Specifying standardized temperature and pressure conditions is a significant problem when making GC flow measurements. Expressions such as STP, normal temperature and pressure (NTP), or reference temperature and pressure (RTP) have no consistent default meaning. The use of standard conditions varies considerably around the world. Standard conditions can signify temperatures of 0, 20, or 25 °C, or occasionally some other temperature. The standard pressure is usually 101.325 kPa (1 atm), but the International Union for Pure and Applied Chemistry (IUPAC) defines standard gas reference conditions as 0 °C and 100 kPa (5) and notes that ". . . the former use of the pressure of 1 atm as standard pressure (equivalent to 1.01325 × 10⁵ Pa) should be discontinued." For consistency with legacy methods and practices, this recommendation has largely not been followed in GC. In any case, gas chromatographers should specify standard reference conditions clearly in their methods and measurements.
In the flow calculation example above, there is a difference of nearly 10% between the flowmeter reading and the flow at the specified STP conditions of 0 °C. However, most GC instruments as well as those electronic flowmeters that automatically provide corrected readings express flow rates at standard temperatures closer to the room temperatures normally encountered in laboratories: 20 or 25 °C. Thus, they avoid large differences between corrected and measured flows because of temperature effects.
How significant are flow corrections in a normal laboratory situation? Laboratory temperatures of 16–28 °C represent a range of ±2% about the average, as does a normal annual range of atmospheric pressures. Practically speaking, if requirements for flow accuracy lie outside of ±5% or so, then for flowmeters that do not already correct for temperature and pressure, adjusting to standard temperature and pressure on a routine basis may not be necessary. Exceptions would include applications in which large temperature fluctuations are the norm such as for field instruments or when methods and measurements are to be ported to other laboratories that might make different assumptions. Certainly, if a particular detector is intolerant of small changes in flow then the detector gas flow rates should be corrected to standard conditions.
With the concepts of mass flow and volumetric flow firmly in mind, now let's move on to the measurement of these quantities in the laboratory.
Side-by-Side Comparison
I recently obtained a new electronic volumetric flowmeter. Like most chromatographers, I have a collection of older flowmeters that still work well. One is a large old-school soap-bubble flowmeter that long ago snapped about halfway, but it still has a useful 60 cm3 of volume left. Another is a late 1990s era electronic mass-flow device, and the third is a mini bubble flowmeter with an electronic stopwatch that times the passage of bubbles. The new meter promised to be good enough that it could replace all of the others, but I was curious how the four of them would stack up in a side-by-side comparison. Table III lists the meters and their characteristics.

Table III: Flowmeters used in the comparison
The operating principles of the meters are diverse. Bubble flowmeters are the simplest: Gas flow pushes bubbles of soap solution upward past calibrated volume marks in a precision buret. The passage of the menisci is timed with a stopwatch; the raw flow rate is the volume spanned divided by the transit time. Using a bubble flowmeter requires a little technique, so that clearly defined bubbles are generated and the timing is consistent.
As the bubbles move upward, water from the soap solution evaporates into the bubble, expanding its volume slightly. The raw flow can be compensated for this expansion with equation 3, which assumes that the bubbles become water-saturated before they pass the first mark.

In equation 3, pw is the partial vapor pressure of water at the ambient temperature, as listed in Table IV. The water-vapor correction amounts for as much as several percent at warmer laboratory temperatures. The flow rate is then further adjusted to ambient conditions with equation 1. The electronic bubble flowmeter that I have does not include any of these adjustments, so they were applied to its raw flows as well as to the manual bubble flowmeter readings.

Table IV: Vapor pressure of water from 15 to 30 °C (4)
The electronic mass flowmeter works by applying a calibrated amount of energy in the form of heat to incoming gas; the resulting temperature differential between the incoming and heated gas depends directly on the mass flow rate, the specific heat, and the thermal conductivity of the gas, so the type of gas must be specified. The displayed flow is expressed at 25 °C, so it was adjusted to 20 °C to match the standard conditions that were applied to the other flowmeter readings.
The new electronic volumetric flowmeter uses an acoustic displacement method to determine the volume of gas per unit time without regard to the gas identity. Gas flow through the meter is momentarily restricted, which causes an accumulation of a small gas excess that displaces a precision diaphragm. The method is carried out in a manner that minimizes upstream pressure fluctuations so as not to interfere with GC detector signals. This flowmeter runs dry, so water vapor is not a concern. It reports a true volumetric flow that can be adjusted to standard conditions.
I tested the flowmeters by connecting each in turn to a mass-flow controlled source of helium carrier gas through a restrictor in the GC oven. Two ranges were tested on consecutive days: 1–10 and 10–100 cm3/min. Three consecutive readings on each flowmeter at each flow rate were averaged. I also observed that even though a short length of silicone tubing placed over the 1/16-in. exit tube from the restrictor was held firmly in place and apparently well sealed, in fact it leaked enough to cause erratic readings at low flows. Escaping helium was found easily with an electronic leak detector. I clamped the silicone tube in place and then could no longer observe any helium around the tube connection. The bubble flowmeters were cleaned and new soap solution was used. Care was taken to avoid a malformed meniscus, and when possible the second meniscus of two bubbles was timed in an attempt to suppress the diffusion of helium through the meniscus and resulting low flow rate readings. Below a certain level for each bubble flowmeter, however, this effect is clearly seen in the results.
All flow rates were then corrected to 20 °C and 101.352 kPa from ambient conditions, which varied on the two days the measurements were made. Ambient temperature was measured with a calibrated thermocouple. Ambient pressure was read from an absolute electronic pressure transducer calibrated by the manufacturer. The electronic mass flowmeter (EM in Table III) corrects to a standard temperature of 25 °C, so its readings were adjusted to their equivalents at 20 °C. Flows measured with the soap-bubble flowmeters (B1 and B2 in Table III) were first corrected for the effect of the water vapor pressure in the soap bubble solution with equation 3.
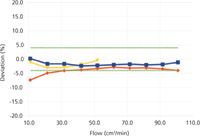
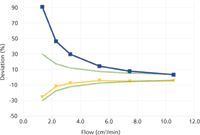
Figures 1 and 2 show the percent differences between the new volumetric flowmeter (EV) readings on the x-axis and the two bubble flowmeters B1 and B2, as well as the electronic mass-flowmeter (EM). Both figures also show an estimate of the sum of the manufacturers' specified accuracy for the combination of two flowmeters. In Figure 1, at flows from 10 to 100 cm3/min, this is a constant ±4%. In Figure 2, the estimated percent accuracy increases when the specified level of accuracy in cubic centimeters per minute exceeds the percent-level specification.
Figure 1 shows that both bubble flowmeters and the electronic flowmeter remained within the specified accuracy relative to the new volumetric meter, down to 10 cm3/min, with one exception. Below 20 cm3/min, the large bubble flowmeter began to fall off and report lower flows than the other meters. This is caused by the diffusion of helium through the large-diameter menisci of this meter and represents a practical lower limit for helium or hydrogen measurements with such a device. Nitrogen should do better, in theory, because it has a slower diffusion rate and there already is 79% nitrogen in the air above the bubbles. Nitrogen was not tested for this comparison. At 10 cm3/min, the bubble transit time for 20 cm3 in the large bubble flowmeter approached 120 s, too long for even a patient person.

Figure 1: Percent deviation from volumetric flowmeter EV, 10â100 cm3/min. Meter B1: red diamonds. Meter B2: yellow triangles. Meter EM: blue squares. The dotted green lines show estimated overall expected accuracy.
Figure 2 shows the comparative results for flows of 1–10 cm3/min. The large bubble flowmeter was not tested below 10 cm3/min. The small bubble flowmeter showed a drop-off below about 4 cm3/min, similar to the larger one's drop-off below 20 cm3/min, but the small flowmeter's readings remained within the accuracy specifications. The electronic mass flowmeter did not fare so well at flow rates under 10 cm3/min, with positive departures from the volumetric meter up to nearly two times greater at 1 cm3/min, which was a bit of a surprise considering the low-end specification of 0.1 cm3/min. In this case, air may have diffused into the meter against the very low helium flow and biased the readings in a positive direction. As a precaution, it might be advisable to attach a 20-cm tube to this flowmeter's outlet to present a back-diffusion barrier, although this was not tested in these experiments.

Figure 2: Percent deviation from volumetric flowmeter EV, 1â10 cm3/min. Meter B2: yellow triangles. Meter EM: blue squares. The dotted green lines show estimated overall expected accuracy.
Proper calibration and functional validation are important for flowmeters. The volumes of the bubble-meter burets did not change over time, so they were considered to be in calibration. The electronic mass-flow and volumetric meters are subject to drift over time because of their active electromechanical components. The new volumetric meter was less than three months old and still inside its initial calibration period of one year. According to an attached sticker, the thermal mass-flowmeter had been calibrated in 2009, so its calibration was suspect, and it is possible that recalibration would reduce its nonlinearity at low helium flows.
Conclusions
No issues with flow measurement were identified at 20–100 cm3/min. Flows above 100 cm3/min were not tested, but this range is considered unlikely to cause problems. These results do show that measurement of helium flow rates below 10 cm3/min should be performed with care, if at all. If possible, avoid bubble flowmeters at these low flows, and use a calibrated volumetric meter instead. Most flows at this level are carrier-gas flows, but it is difficult to make a leak-free connection inside a flame ionization detector chimney or electron-capture detector vent. It is possible, if impractical, to use an adapter for fused-silica columns as the flowmeter connection, which requires that the column be disconnected from the detector and somehow brought out of the GC oven. Thus, the best recommended course for open-tubular column flow determination is to time an unretained peak and calculate the corrected column flow rate with a GC calculator, or if using electronic pneumatic control then just read the flow directly from the instrument display.
References
(1) J.V. Hinshaw, LCGC North Am.30(3), 224–232 (2012).
(2) ASTM Committee E43 on SI Practice and IEEE Standards Coordinating Committee 14 (Quantities, Units, and Letter Symbols), "SI 10™ American National Standard for Use of the International System of Units (SI): The Modern Metric System" (IEEE, New York, New York and ASTM, West Conshohocken, Pennsylvania, 2002), ISBN 0-7381-3317-5 (print), ISBN 0-7381-3318-3 (pdf).
(3) L.S. Ettre and J.V. Hinshaw, Basic Relationships of Gas Chromatography (Advanstar Communications, Cleveland, Ohio, 1993), p. 39.
(4) O.C. Bridgeman and E.W. Aldrich, J. Heat Transfer86, 279–286 (1964).
John V. Hinshaw
"GC Connections" editor John V. Hinshaw is a Senior Scientist at BPL Global, Ltd., in Hillsboro, Oregon, and a member of LCGC's editorial advisory board. Direct correspondence about this column to the author via e-mail: lcgcedit@lcgcmag.com.

John V. Hinshaw

Detecting Hyper-Fast Chromatographic Peaks Using Ion Mobility Spectrometry
May 6th 2025Ion mobility spectrometers can detect trace compounds quickly, though they can face various issues with detecting certain peaks. University of Hannover scientists created a new system for resolving hyper-fast gas chromatography (GC) peaks.
Altering Capillary Gas Chromatography Systems Using Silicon Pneumatic Microvalves
May 5th 2025Many multi-column gas chromatography systems use two-position multi-port switching valves, which can suffer from delays in valve switching. Shimadzu researchers aimed to create a new sampling and switching module for these systems.
New Study Reviews Chromatography Methods for Flavonoid Analysis
April 21st 2025Flavonoids are widely used metabolites that carry out various functions in different industries, such as food and cosmetics. Detecting, separating, and quantifying them in fruit species can be a complicated process.

.png&w=3840&q=75)

.png&w=3840&q=75)


.png&w=3840&q=75)


.png&w=3840&q=75)


