Gradient Elution, Part I: Intuition
LCGC North America
A how-to on understanding gradient elution
In contrast to isocratic separations, gradient elution sometimes can seem to be counter-intuitive. Yet with the proper perspective, the things we intuitively understand about isocratic methods apply in a similar manner to gradients.
In many of the past installments of "LC Troubleshooting," we've looked at gradient elution liquid chromatography (LC) in different contexts. Most recently (1), we considered how a gradient scouting run could be used to speed up development work. In other cases, we've looked at specific problems with gradient methods, as well as other aspects of gradient elution. I make no effort to hide the fact that I have a bias toward using gradients — they have the potential to be faster, give better detection limits, and have more flexibility than their isocratic counterparts. However, there are many problems that can occur with gradients, as well. Some of these problems are inherent to the technique and can be avoided or accommodated with a little care. Other problems result from a poor understanding of gradient elution or sloppy laboratory technique. Because the breadth of topics makes it impossible to discuss these in detail in a single article, we will discuss several aspects of gradient elution in a multipart series. This month, we'll concentrate on how we can transfer our intuitive understanding of isocratic separations into a similar understanding of gradient elution. If you want more detail on this or any other gradient-related topics, reference 2 contains a discussion of gradient elution at many different levels of detail.
Isocratic — It's So Simple
I believe that one of the reasons that reversed-phase LC is such a popular technique is the intuitive nature of isocratic separations. The mobile phase usually comprises an aqueous and an organic component. The aqueous phase typically is a buffer or water, whereas the organic component most commonly is acetonitrile or methanol. The aqueous phase is the weak solvent, often called the A-solvent, and the organic is the strong solvent, or B-solvent. Isocratic conditions are those that do not change during a given run, so the ratio of A to B, or %B, is constant.
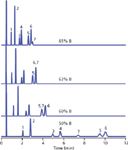
It takes very little experience to figure out how peaks behave when %B is changed. For example, consider the sample shown in Figure 1. Working from top to bottom, each chromatogram is the result of a decrease in %B, from 65% to 50%. As the %B is reduced (or %A is increased), four observations are common. First, peaks move to longer retention times. Second, the overall separation tends to improve. Third, the peaks become broader, and fourth, because the area is constant, the peaks become shorter. This general pattern of change occurs when solvent strength is changed in any reversed-phase separation of any sample and with any stationary phase and solvent system. And yes, for you purists, there are a few exceptions, but this is the most common behavior.

Figure 1: Isocratic separation of a nitroaromatic sample. Column: 100 mmà 4.6 mm, 5-µm particle C18; flow rate: 2 mL/min; temperature: 25 �C; A-solvent: water; B-solvent: methanol with %B shown on chromatograms. All chromatograms have the same x- and y-axis scaling. Simulated chromatograms based on the data of reference 3. Peaks: 1 = 2,6-dinitrotoluene, 2 = nitrobenzene, 3 = 2-nitrotoluene, 4 = 3-nitrotoluene, 5 = 2-nitro-1,3-xylene, 6 = 4-nitro-1,3-xylene, 7 = benzene.
As a result of knowledge gained from experiments such as those just mentioned, a common method development strategy is used widely. Start at a high percentage of the organic component, such as 90% B, and make stepwise changes in the solvent strength — 90%, 80%, 70%, and so forth — until the separation looks pretty good. Then fine-tune in smaller steps.
This relationship between retention and %B can be generalized with the Rule of 2.5, which states that, on the average, the retention factor, k, will change about 2.5 times for a 10% change in the B-solvent. We can see how this works by examining the simulated chromatograms of Figure 1, which are for a sample of nitroaromatic compounds based on data presented in reference 3. The retention factor is calculated as k = (tR – t0)/t0, where tR and t0 are the retention time and the column dead time, respectively. The column used for Figure 1 is a 100 mm × 4.6 mm column run at 2 mL/min, which results in t0 ≈ 0.5 min. This is confirmed by the sharp t0 peak at the beginning of each chromatogram at ~0.5 min. With knowledge of t0, we can calculate that the last peak in the 65%, 60%, and 50% runs have k values of ~4.5, 7, and 19, respectively. A change from 60% to 50% is 10%, so 2.5 × 7 = 17.5 ≈ 19 observed for 50%. Because the relationship between log k and %B is linear, a 5% change in %B should have about a 1.6-fold change in k. Again, this can be confirmed from Figure 1 by comparing the 65% run (k ≈ 4.5 for the last peak): 4.5 × 1.6 = 7.2 ≈ 7 for the 60% B run. (Because this behavior will vary a bit depending on the molecular weight of the compound, we often see the Rule of 2.5 expressed as the Rule of Three, which makes for easier mental calculations.)
Although the general observation of improving separation for lower %B values is true for isocratic separations, the behavior of specific peaks may vary from this generalization. For example, the separation, retention, and peak width for peaks 1–4 in Figure 1 all increase with lower values of %B. Note, however, the behavior of peaks 5–7. At 65%, the peaks are eluted in order and are easily distinguished but are not fully separated. At 63%, however, peaks 6 and 7 have merged, and peak 7 moves forward to merge with peak 5 at 60%. So, for this example, neither the 63% nor the 60% run is better than the shorter 65% run. By the time we get to the 50% run, peak 7 has moved from the latest-eluted to the earliest-eluted position of this triplet. Such behavior, where selectivity, or relative peak position, changes with %B changes is sufficiently common that fine-tuning %B can be a powerful tool to move peaks relative to each other in isocratic separations during LC method development.
Consider the influence of some other variables on the separation. A change in flow rate merely expands or compresses the chromatogram but has little, if any, affect on the separation. The pressure also goes up or down in proportion to the flow-rate change. An increase in the column temperature will shorten the retention time and generate narrower peaks, much like the way an increase in %B does, but not so dramatically. The rule of thumb for temperature states that a 1 °C change in temperature will change retention by approximately 2%. Although often overlooked, a change in temperature also may change selectivity in isocratic separations. An increase in column length will increase the pressure and make the run longer, but will not change the relative peak positions. Similarly, a reduction in packing particle size will increase the pressure and give narrower peaks, but will not change the retention times of the peaks.
These various patterns of change form the basis of my "nothing's magic" rule of chromatography. This rule says that changes in a chromatogram due to changes in some variable usually happen in a continuous fashion. For example, if you change from 70% B to 60% B, you will notice that the retention increases, so you expect similar retention increases when you change from 60% B to 50% B. Sometimes the relationships are logarithmic instead of linear, but the general patterns apply. And this intuitive quality of isocratic separation is one reason why reversed-phase isocratic separations are so widely used and so successful — you don't have to understand chromatographic theory to get reasonable results. As you gain experience, your gut-level instincts usually will give you the appropriate guidance.
What About Gradients?
The intuitive nature of isocratic separations is very attractive, and is one reason why many chromatographers prefer isocratic methods. Gradients, where %B is changed during the run, can seem much more daunting. However, if the appropriate comparisons are made, many of the same intuitive results can be obtained from gradients. The key here is that the comparisons have to be appropriate. For the current example of nitroaromatics (3), I've carefully chosen gradient conditions for Figure 2 that correspond closely to their isocratic counterparts of Figure 1. (As a side comment, let me state the obvious: Gradient time and gradient steepness are just two different ways to describe the same separation conditions. For example, the runs of Figure 2 are 0–100% B in various times. The 5-min gradient could also be expressed as 100%/5 min = 20%/min. I will use the gradient time in the present discussion.)

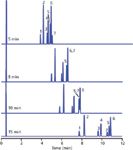
Figure 2: Same sample as Figure 1. Simulated 0â100% B gradients with gradient times shown on chromatograms. Same scaling as Figure 1.
Our overall conclusions after examining the separations of Figure 2 are similar to those from Figure 1: Longer gradient times increase retention, improve the separation, and result in broader, and thus shorter, peaks. Notice that the peaks occur in the same order in both sets of runs. In the 5-min and 65% B runs, the peaks are eluted in numeric order. In the 8-min and 63% B runs, peaks 6 and 7 are merged, whereas peaks 5 and 7 are merged in the 10-min and 60% B chromatograms. In the 15-min and 50% B runs, all peaks are resolved, with the sequence of 7-5-6 for the last three peaks. We can see from these examples that fine-tuning the gradient time can be used to move peaks relative to each other, just as changing %B in isocratic separations can.
The similarity of the separations in Figures 1 and 2 show that, with proper care, you can get approximately the same results from gradient and isocratic separations, implying that the separation mechanisms must be quite similar. In fact, separation behavior of gradient and isocratic chromatography is unified with the "linear solvent-strength theory," which is the subtitle of reference 2. One way of thinking about this is that gradient and isocratic chromatography are the same process viewed from different perspectives. Thus, if we change the gradient time or gradient steepness, we will get similar changes as changing the isocratic %B. Longer or less-steep gradients increase run time, improve resolution, and result in broader, shorter peaks, just like a decrease in isocratic %B. This allows us to transfer some of our intuitive understanding of isocratic separations to gradients.
What about the other variables we briefly examined for isocratic separation: flow rate, temperature, column length, and packing particle size? An increase in column temperature in gradient elution also will reduce retention (although not as dramatically as the 2%/°C for isocratic), lower pressure, sharpen peaks, and may change selectivity, just as in isocratic runs. Similarly, a reduction in particle size will increase pressure and yield narrower peaks without changing retention. In contrast to isocratic separations, where a change in flow rate or column length had logical and expected results, the results with gradients can be surprising — especially if relative peak positions change when one or both of these variables are changed. Such surprises often are responsible for conclusions that gradients are not as logical as isocratic separations. We'll examine these, and other, differences in gradient versus isocratic behavior in future "LC Troubleshooting" installments.
The Rule of 2.5 (or Rule of Three, if you prefer) for isocratic separation gave a simple way to anticipate the change in retention when %B is changed. Retention in gradient elution isn't so neatly described. However, one general observation is that as the gradient time is increased, the retention relative to the gradient time drops. In the 5-min gradient, the last peak is eluted at 4.7 min, or 93% of the way through the gradient. The retention of the last peak drops to 83%, 79%, and 72% as the gradient time is increased from 8 to 10 to 15 min.
Another contrast between gradient and isocratic separations is related to peak width. In the isocratic separations of Figure 1, it can be seen that the peak width depends on its retention time not the mobile-phase composition. Peaks early in the chromatogram are narrow, and as retention increases, so does peak width. For example, peak 5 at 65% B, peak 4 at 60%, and peak 2 at 50% all have approximately the same retention time and peak width, whereas in each chromatogram, the later-eluted peaks are broader than the first ones. With gradient separations, however, all the peaks in a given run are approximately the same width, and peak width increases with gradient time. So all the peaks in the 15-min run are broader than those in the 8-min run, yet all the peaks in the 15-min run are approximately the same width. This behavior can be an advantage for gradient runs, because narrow peaks mean taller peaks and, thus, lower detection limits. For example, peak 6, which was eluted at ~11 min in the 15-min gradient of Figure 2, is much taller than its counterpart eluted at ~10 min with 50% B in Figure 1 (all chromatograms in Figures 1 and 2 are on the same scale). Thus, gradients often are favored for the detection of small peaks that are strongly retained.
Isocratic or Gradient
At the beginning of this column installment, I mentioned my bias toward gradients, but it is obvious from comparing the 50% B isocratic run in Figure 1 to the 15-min gradient in Figure 2, that the isocratic separation wins in terms of getting a better separation in the same run time. We could have anticipated this if we had applied the 25/40% rule explained in an earlier "LC Troubleshooting" discussion (1). The peaks of the 15-min gradient of Figure 2 occupy (10.9 – 8.3 min)/15 min = 26% of the run, which is very close to the <25% cutoff where isocratic runs are very likely to be preferred. So it is not surprising that for this sample, isocratic separation is a better choice than gradient elution. As the retention range between the first and last peaks increases, gradients are favored.
Conclusions
Isocratic LC separations often are the method of choice because they are so intuitive to develop. We have seen, however, that if gradient run time or gradient steepness is considered in the same context as isocratic %B, gradient and isocratic separations behave in a very similar manner. Longer, shallower gradients give the same results as reducing the %B in an isocratic mobile phase: longer retention times, generally better separation, and broader, shorter peaks. Fine-tuning the gradient time, just like fine-tuning the isocratic %B can be used to make subtle changes in the separation. In future "LC Troubleshooting" discussions, we'll consider how to further unravel some of the mysteries of gradient elution, as well as some of the problems that can be encountered.
References
(1) J.W. Dolan, LCGC North Am. 31(1), 30–35 (2013).
(2) L.R. Snyder and J.W. Dolan, High-Performance Gradient Elution, (Wiley, Hoboken, New Jersey, 2007).
(3) M.A. Quarry, R.L. Grob, L.R. Snyder, J.W. Dolan, and M.P. Rigney, J. Chromatogr.384, 163–180 (1987).
John W. Dolan
"LC Troubleshooting" Editor John Dolan has been writing "LC Troubleshooting" for LCGC for more than 25 years. One of the industry's most respected professionals, John is currently the Vice President of and a principal instructor for LC Resources, Walnut Creek, California. He is also a member of LCGC's editorial advisory board. Direct correspondence about this column via e-mail to John.Dolan@LCResources.com

John W. Dolan

University of Rouen-Normandy Scientists Explore Eco-Friendly Sampling Approach for GC-HRMS
April 17th 2025Root exudates—substances secreted by living plant roots—are challenging to sample, as they are typically extracted using artificial devices and can vary widely in both quantity and composition across plant species.
Thermodynamic Insights into Organic Solvent Extraction for Chemical Analysis of Medical Devices
April 16th 2025A new study, published by a researcher from Chemical Characterization Solutions in Minnesota, explored a new approach for sample preparation for the chemical characterization of medical devices.


