Simple and Fast Quantification of Capsaicinoids in Hot Sauces Using Monolithic Silica Capillaries and LC–MS
LCGC North America
Fast, easy, and resproducible determination of capsaicinoid content
This work describes the simple and fast quantification of capsaicinoids extracted from diverse hot sauces used to spice up sausages. The various capsaicinoids were separated on a robust reversed-phase monolithic silica capillary column and then directly transferred to a mass spectrometry system. The main analytes obtained via this method and contributing 90% of chili heat were capsaicin and dihydrocapsaicin. Both were analyzed quantitatively in a set of 10 different sauces. The combined results are displayed in Scoville heat units (SHU) and compared to manufacturer's data.
Peppers such as chili or jalapeño are long-known and widely used spices with an agricultural history reaching back about 6300 years (1). Originally cultivated in Ecuador, these peppers eventually made their way into kitchens worldwide. Today a wide range of hot peppers is available, with the commercially available pepper Bhut Jolokia holding the world record for plant heat (2).
The heat of food — for example, hot sauces — is defined by its content of several different capsaicinoids, 90% of these being either capsaicin or dihydrocapsaicin. In the very beginning of heat measurement, a slow and inaccurate sensory method introduced by W.L. Scoville was used to define the heat of hot food (3). This method worked with testers tasting a stepwise-diluted sample solution and resulted in a dilution factor today known as Scoville heat units (SHU, see Table I). An SHU value of 5000 for example means that one needs 5000 drops of water to dilute one drop of hot sauce below the human threshold level for heat. For comparison, the SHU of pure capsaicin accounts to 16,000,000.
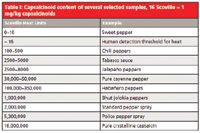
Table I: Capsaicinoid content of several selected samples, 16 Scoville = 1 mg/kg capsaicinoids
Nowadays the quantification of capsaicinoids is performed via fast and accurate high performance liquid chromatography (HPLC) techniques coupled to mass spectrometry (MS) (4,5). The capsaicinoid content is given in parts per million (ppm) and can then be converted to the SHU system for ease of use.
For some years now, the trend of extremely spicy food has been observed. This phenomenon caused the arrival of a growing variety of hot sauces on the shelves of supermarkets and in internet shops. Many of these products do not only contain chili peppers but — to perform well and as expected in tastings — also consist of relevant amounts of chili pepper extracts (oleoresins). Doing so allows for the production of sauces with SHU values up to several million — reminding one more of biological warfare rather than of a candlelight dinner.
In our work, we describe the quantitative capsaicinoid analysis of 10 of these sauces with SHU values ranging from 20,000 to 2,700,000 using an easy sample preparation method. To minimize sample preparation and a subsequent clogging of the column, a robust monolithic silica capillary column was used in this work. This setup also enables fast separations at low back pressure on conventional HPLC systems. A main focus of the work was to optimize the LC–MS method in a way that allows for a quick and simple separation of analytes and a subsequently easy quantification. These results were compared against the manufacturer's information where it was available.
Experimental
Materials and Methods
The HPLC system used was a Dionex Ultimate 3000 nano (Thermo Scientific Dionex Corporation) including Chromolith CapRod 300-0.1 mm RP-18e and Chromolith CapRod 150-0.1 mm RP-18e analytical monolithic silica capillary columns (Merck KGaA). A UV detector was operated at 254 nm and the data acquisition was performed with Chromeleon software (Thermo Scientific). All analyses were performed utilizing "full loop" injection to avoid any deviations in injection volume.
A Bruker Esquire 3000plus mass spectrometer with an ion trap and a nano-electrospray ionization (nano-ESI) source operated in positive mode was utilized with an m/z range scan from 300 to 310.
Capsaicin and dihydrocapsaicin standards were prepared from substances purchased from Sigma Aldrich. HPLC-grade methanol and acetonitrile were purchased from Merck KGaA. All water used was double deionized using a MilliQ station (Merck Millipore).
Standard Preparation
Stock solutions were obtained by dissolving approximately 40 mg of capsaicin and dihydrocapsaicin standards in 50 mL of ethanol. Subsequently, the purity of these solutions was determined via LC–MS (capsaicin: 97.5%, dihydrocapsaicin: 92.7%). For the calibration curves these solutions were diluted to 1:100–1:10,000 by using 50:50 (v/v) water–acetonitrile. All analyses were performed in the linear range of these curves. Conversion of analyte concentration to SHUs was subsequently done by multiplying concentration (in parts per million) by a factor of 15 (4).
Sample Preparation
The preparation of the hot sauces was performed by Soxhlet extraction of 10–20 g of sauce for three days using ethanol or for 6 h using methanol (with comparable results). Because all samples were based on oleoresins (chili pepper extracts) and therefore free of any tomato or chili pepper chunks, no homogenization step was necessary. After extraction the supernatant solution was filtered through a 0.45-µm syringe microfilter (Merck Millipore), made up to 100 mL with ethanol or methanol and diluted to 1:100–1:10,000 using 50:50 (v/v) water–acetonitrile. Because the analytes display high stability under the extraction conditions and assuming that extraction was quantitative (no matrix effect because of excellent comparability of different extraction method results and very good accordance of recovery rate with manufacturers data), we refrained from using an internal standard.
Results and Discussion
We selected a set of 10 different hot sauces with various capsaicinoid content. For half of these samples, heat was only described qualitatively using expressions such as "extremely hot," and the other half had SHU values ranging from 111,111 to 2,700,000. Therefore, sauces were subdivided into two groups:
- no SHU data available (sauces A–F) and
- manufacturer's SHU data available (sauces G–J).
Among the five main capsaicinoids (nordihydrocapsaicin, capsaicin, dihydrocapsaicin, homocapsaicin, and homodihydrocapsaicin) present in chili peppers capsaicin and dihydrocapsaicin (see Figure 1) cause the strongest heat impression (6). In addition, they attribute to ~90% of capsaicinoid content of chili peppers (7,8).

Figure 1: Structural formulas of (a) capsaicin and (b) dihydrocapsaicin. Together both molecules attribute to approximately 90% of the heat of chili peppers. Adapted from references 1 and 2.
To support these findings, the hot sauce compositions were evaluated by performing gradient runs analyzing different samples (for example, see Figure 2 displaying the separation of five different capsaicinoids in sauce A).
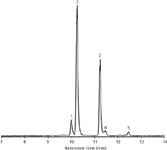
Figure 2: LCâMS base peak chromatogram of an extract of hot sauce A (diluted 1:100) displaying the separation of five capsaicinoids. Column: Chromolith CapRod 300â0.1 mm RP-18e; mobile-phase A: water with 0.1% formic acid, mobile-phase B: acetonitrile with 0.1% formic acid; gradient: 35â90% B in 15 min. Peaks: 1 = nordihydrocapsaicin, 2 = capsaicin, 3 = dihydrocapsaicin, 4 = homocapsaicin, 5 = homodihydrocapsaicin.
For ease of use, the analysis of sauce heat could then be restricted to both capsaicin and dihydrocapsaicin and a fast and simple isocratic HPLC method was developed. A typical LC–MS chromatogram using this protocol is displayed in Figure 3. Additional multiple runs using different hot sauces showed that the method allows for a reproducible and easy quantification of the two main analytes.
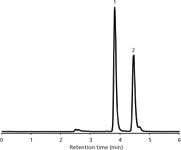
Figure 3: Typical LCâMS base peak chromatogram of an extract of hot sauce B (diluted 1:1000) used for the quantification of capsaicin and dihydrocapsaicin. Analytes were separated on a Chromolith CapRod 150â0.1 mm RP-18e monolithic silica column in isocratic mode (acetonitrile + 0.1% formic acid-water + 0.1% formic acid 50:50 v/v).
A comparison of analysis and manufacturer's data reveals a very good correlation of SHU values. Because samples were produced by different sources, deviations between the two sets of figures can be explained by methodic differences in transferring the chromatographically determined capsaicinoid content (in micrograms per milliliter) into SHU (in milligrams per kilogram) as well as in target analyte selection. Figure 4 combines the quantitative results for the determination of both capsaicin and dihydrocapsaicin in hot sauces F–J as well as manufacturer's data; in addition exact values can be found in Table II.
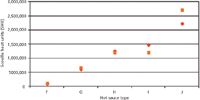
Figure 4: Comparison of experimentally determined capsaicinoid content (capsaicin and dihydrocapsaicin) of hot sauces FâJ (red diamonds) with manufacturer’s data (orange squares). For comparison, pure capsaicin corresponds to 16 million SHU.
In Figure 5, the results for hot sauces A–F are combined. SHU values range from 17,000 to 86,000, with an approximate mass ratio of capsaicin:dihydrocapsaicin of 1.2:1–2.4:1. This finding can be explained by the different types of chili peppers the manufacturer used for the preparation of the hot sauces.
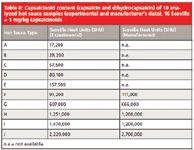
Table II: Capsaicinoid content (capsaicin and dihydrocapsaicin) of 10 analyzed hot sauce samples (experimental and manufacturer’s data), 16 Scoville = 1 mg/kg capsaicinoids
Conclusion
The developed method combines sample preparation with LC–MS separation and detection for a fast, easy, and reproducible determination of capsaicinoid content in various hot sauces and on conventional HPLC systems. The results revealed that the method can be applied to samples independent of capsaicinoid content with very good accuracy.
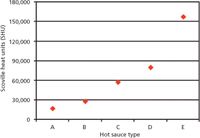
Figure 5: Comparison of experimentally determined capsaicinoid content (capsaicin and dihydrocapsaicin) of hot sauces AâE. For comparison, pure capsaicin corresponds to 16 million SHU.
References
(1) S. Robinson, Time, June 25–July 2, 83–86 (2007).
(2) P.W. Bosland and J.B. Baral, HortScience 42, 222–224 (2007).
(3) W.L. Scoville, J. Am. Pharm. Assoc. 1, 453–454 (1912).
(4) M.D. Collins, L. Mayer Wasmund, and P.W. Bosland, HortScience 30, 137–139 (1995).
(5) G.F. Barbero, A. Liazid, M. Palma, and C.G. Barroso, Food Chemistry 107, 1276–1282 (2008).
(6) P.H. Todd, M.G. Bensinger, and T.J. Biftu, Food Sci. 42, 660 (1977).
(7) B.V. Thomas, A.A. Schreiber, and C.P. Weisskopf, J. Agric. Food Chem. 46, 2655–2663 (1998).
(8) G. Reineccius, in Source Book of Flavors, Second Edition (Chapman and Hall, New York, 1994) pp. 267–273.
Simon Forster and Dr. Stephan Altmaier are with Merck KGaA in Darmstadt, Germany. Direct correspondence to: stephan.altmaier@merckgroup.com
New Method Explored for the Detection of CECs in Crops Irrigated with Contaminated Water
April 30th 2025This new study presents a validated QuEChERS–LC-MS/MS method for detecting eight persistent, mobile, and toxic substances in escarole, tomatoes, and tomato leaves irrigated with contaminated water.

.png&w=3840&q=75)

.png&w=3840&q=75)


.png&w=3840&q=75)


.png&w=3840&q=75)


