Leveraging Mass Defect Plots for Compound Identification in Complex Matrices by GC-HRT
Gas chromatography coupled to high resolution time-of-flight mass spectrometry (GC–HRT) was used to identify halogenated organic compounds based on their mass defects in fish tissue extracts.
Gas chromatography coupled to high resolution time-of-flight mass spectrometry (GC–HRT) was used to identify halogenated organic compounds based on their mass defects in fish tissue extracts.
The expression "a needle in a haystack" applies fittingly to modern mass spectrometry users when attempting to identify unknown compounds in complex matrices. Mass defect plots may be thought of as a magnet used for extracting needles from the haystack. Mass defect is defined as the difference between a compound's nominal mass and its exact mass. Every compound characterized by its chemical formula has a unique mass defect resulting from the combination of its elements. This characteristic can be used to simplify the search for unique and novel compounds. Until recently, FT-ICR-MS was the only technique that properly leveraged mass defect. With modern advances in TOF technology, it is now possible to comprehensively achieve sufficient resolution on LECO's Pegasus GC-HRT platform to perform precise mass defect measurements.

Figure 1: Total ion chromatogram of a fish extract. Chromatof-HRT software identified >2000 unique peaks.
Experimental
The IUPAC convention for calculating exact mass stipulates that C = 12.0000. However, the scale can be redefined according to the following equations:
Scaled Mass Defect (X)= Accurate Mass (IUPAC)*Mass Scale (X)
Mass Scale (X) = Nominal Mass (X)/Exact Mass (X)
where X is the reference formula, that is, C = IUPAC, CH2 = Kendrick. The advantage of plotting scaled mass defect versus nominal (or accurate) mass is the horizontal alignment of compounds related to the reference formula (such as homologs). A whole fish homogenate was analyzed using the Pegasus GC-HRT in EI mode to identify halogenated persistent organic pollutants by their hydrogen substituted for chlorine (Cl-H) scaled mass defect. The scaling factor was 34/33.96102, for the ratio between the nominal and exact mass of Cl-H.

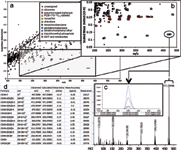
Figure 2: (a) Scaled mass defect plot (Cl-H) highlighting several masses corresponding to halogenated compounds; (b) XICs of the isotope cluster; (c) calculated chemical formula for the selected m/z values.
Results and Discussion
Fish extracts are very complex matrices containing many natural and anthropogenic compounds as demonstrated by the chromatogram in Figure 1. The Cl-H scaled mass defect plot (Figure 2a), generated by summing the mass spectra over the entire chromatographic run, showed a region dominated by halogenated compounds that were not apparent in the total ion chromatogram (Figure 2b). From the mass defect plot, accurate masses (+/- 0.5 mDa) were selected for display as extracted ion chromatograms (XIC) (Figure 2c). Data processing the sample using peak find in Chromatof-HRT software, enabled identification of the chromatographic peaks in the XIC by library database searching. Alternatively, if no library hits were found, the accurate mass data were utilized further to calculate chemical formulae, which were then searched against online chemical databases. The mass spectrum in Figure 2c was not found in the NIST library; however, the composite accurate mass data (Figure 2d) enabled it to be identified as pentabromobenzene. This workflow is demonstrated schematically in Figure 3.

Figure 3: Compound identification workflow that utilizes mass defect as a form of data sorting.

LECO Corporation
3000 Lakeview Avenue, St. Joseph, MI 49085
tel. (269) 985-5496, fax (269) 982-8977
Website: www.leco.com

Separation of Ultra-Short and Long Chain PFAS Compounds Using a Positive Charge Surface Column
December 11th 2024A separation of ultra-short and long chain PFAS (C1-C18) is performed on a HALO®PCS Phenyl-Hexyl column along with a HALO®PFAS Delay column which demonstrates excellent retention for both hydrophilic and hydrophobic analytes.


