Analysis of Coffee and Coffee Products by HPLC for the Determination of Natural Components and Harmful Contamination
The Application Notebook
In this application we demonstrate the analysis of coffee and coffee products according to DIN methods. The performance of the analysis is shown for linearity, limit of detection (LOD), limit of quantification (LOQ), retention time, and area precision.
In this application we demonstrate the analysis of coffee and coffee products according to DIN methods. The performance of the analysis is shown for linearity, limit of detection (LOD), limit of quantification (LOQ), retention time, and area precision. The performance is also shown for solvent-saver columns with 2.7 µm superficially porous particles.
The measurement of some compounds inherent in coffee products by means of HPLC with UV absorbance or fluorescence detection is standardized in the DIN ISO methods:
- The determination of caffeine with approximately 80–120 mg per cup is described in DIN 20481. According to the European Commission decaffeinated coffee must contain less than 0.1% caffeine (1).
- The determination of chlorogenic acid, naturally occurring in green coffee beans with about 3.5 g per 100 g is described in DIN 10767. It is the ingredient considered to cause problems for coffee drinkers with a sensitive stomach. To adjust the content of chlorogenic acid in coffee, different roasting procedures are applied (2).
- The determination of methyl cafestol, a diterpene, naturally occurring in green coffee beans up to 0.06% is described in DIN 10779. Biologically, cafestol has an increasing effect on the serum cholesterol level. On the other hand, there are studies showing for example anti-carcinogenic effects (3).
- Ochratoxin A, is a mycotoxin produced by Apergillus species and one of the major mycotoxins occurring in coffee. According to European regulations it must not exceed 3.5 µg/kg. Ochratoxin A can cause acute toxicity in kidneys and cancer. It is determined as described in the DIN EN 14132 by HPLC/fluorescence detection after enrichment on an immunoaffinity column (4).
Experimental
1) Agilent ZORBAX Eclipse Plus C18, 4.6 × 150 mm, 5 µm. Flow rate 1.0 mL/min.
2) Agilent Poroshell 120 EC-C18, 3.0 × 150 mm, 2.7 µm. Flow rate 0.43 mL/min.
3) Agilent Poroshell 120 EC-C18, 3.0 × 50 mm, 2.7 µm. Flow rate 0.43 mL/min.
Results and Discussion
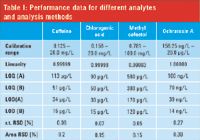
For all compounds calibration curves were created by means of a UV absorbance detection with the exception of ochratoxin, where a fluorescence detection (FLD) was used. The calibration levels were measured under standard HPLC conditions (column 1) as described in the DIN literature. The dilution series was conducted until the limit of quantification (LOQ) was reached at a signal-to-noise (S/N) ratio of 10 and the limit of detection was calculated for a S/N ratio of 3 (Table I). Typically, the LOQs are in the lower µg/L range, for ochratoxin in the lower ng/L range. From multiple injections, the relative standard deviation (RSD) values of the retention time, below 0.07%, and the area RSD, below 0.2%, were calculated.

Table I: Performance data for different analytes and analysis methods
As an example, the separation of isomeric chlorogenic acids from a roasted coffee sample under standard HPLC conditions is shown in Figure 1a. The isomers are separated over a run time of 30 min. The experiment was reaped after transferring the method to column 2 with a flow rate of 0.43 mL/min. For the calibration, similar linearity was found but the LOQ and LOD were lower on the 2.7 µm column. This was due to the better separation performance, showing narrower and sharper peaks with improved S/N ratio enabled by the 2.7 µm superficially porous particles (Table I, row B; Figure 1b). In addition, this column saves 57% of solvent. To improve the efficiency, column 3 was used. This decreases the total run time by a factor of three and allows increasing sample throughput by a factor of three (Figure 1c).

Figure 1: Analysis of isomeric chlorogenic acids on different column dimensions.
Conclusion
The possible improvement of standard DIN methods for the analysis of coffee and coffee products is shown. The throughput could be increased by a factor of three while saving 57% of solvent.
References
(1) E. Naegele, "Determination of Caffeine in Coffee Products According to DIN 20481," Agilent Technologies Application Note, publication number 5991-2851EN (2013).
(2) E. Naegele, "Determination of Chlorogenic Acid in Coffee Products According to DIN 10767," Agilent Technologies Application Note, publication number 5991-2852EN (2013).
(3) E. Naegele, "Determination of Methylcafestol in Roasted Coffee Products According to DIN 10779," Agilent Technologies Application Note, publication number 5991-2853EN (2013).
(4) E. Naegele, "Determination of Ochratoxin A in Roasted Coffee According to DIN EN 14132," Agilent Technologies Application Note, publication number 5991-2854EN (2014).

Agilent Technologies
5301 Stevens Creek Blvd., Santa Clara, CA 95051
Website: www.agilent.com


