Application of Paper Strip Extraction in Combination with LC–MS-MS in Pharmacokinetics
Recent advances in sampling techniques in the pharmaceutical industry sparked significant interest in applying improvements to extraction methods for greater analyte detection and quantitation.
Recent advances in sampling techniques in the pharmaceutical industry sparked significant interest in applying improvements to extraction methods for greater analyte detection and quantitation. In particular, the dried blood spot (DBS) sampling technique has numerous advantages compared to traditional methods such as liquid–liquid extraction, including the use of small sample volumes, less sample processing, and less exposure to toxic solvents (ether, methyl tert-butyl ether [MTBE], and dichloromethane). In this article, we discuss the adaptation of DBS technology to develop and validate a novel paper strip extraction method for the analysis of natural product metabolites in biological samples obtained from a human pharmacokinetic study of xanthohumol, a hop prenylflavonoid.
Globally, chronic diseases serve as the leading cause of death (1,2) and are projected to be responsible for 64 million deaths annually by 2015 (1). The economic and social impact of chronic diseases necessitated continuous advances in analytical techniques for the development and discovery of therapeutic agents. Improvements in mass spectrometry (MS) technology have allowed for the creation of high-throughput methods, which are used in quantitative analysis of drugs and metabolites in biological samples. The complexity of biological samples (that is, plasma, urine, feces, and so on) influences the sensitivity and selectivity of MS methods and emphasizes the importance of sample preparation. Proteins, salts, and organic compounds present in biological samples may interfere with the detection of the analytes of interest, particularly if they are present in trace amounts, thus requiring protocols for extraction, isolation, or concentration of analytes from samples, which may affect accuracy and reproducibility of analyte measurements (3–9).
Common sample preparation methods include liquid–liquid extraction (LLE) and solid-phase extraction (SPE). Traditionally, LLE has been the prominent extraction method for the analysis of natural products (10) and one of its main strengths is providing aqueous and organic fractions during analysis. However, two major limitations of LLE (sample preparation time and toxic solvent use) (10) have led to the emergence of SPE as a preferred extraction method. SPE lowers analysis costs, organic solvent use, and time compared to LLE (10). SPE involves the adsorption of analytes on solid material before elution with the solvent and has been used in clinical toxicological analysis of drugs (11). Disadvantages of SPE methodology include sample volume and the potential need for optimization of SPE methods including adsorptive material and elution solvent for analytes. Challenges with SPE methods prompted a search for alternative sample preparation methods, specifically dried blood spot (DBS) sampling. Interest in DBS sampling has grown significantly, particularly within the pharmaceutical industry because of the lower costs associated with the technique. The DBS technique consists of collecting and drying a biological sample on a small filter paper disk and processing for subsequent liquid chromatography–tandem mass spectrometry (LC–MS-MS) analysis. With the use of filter paper, DBS uses the adsorptive properties of cellulose for analyte extraction, which may lead to lower costs compared to the adsorptive material of SPE (for example, C18). The cellulose fibers in the filter paper aid in the removal of matrix components that interfere with analyte detection (that is, protein precipitation from plasma samples). Thomas and colleagues (12) illustrated the use of DBS in the detection of various drugs and their phase I and II metabolites. DBS has numerous advantages including minimization of analyte loss, the use of small sample volumes, fewer sample processing steps, low matrix effects, and less exposure to toxic organic solvents compared to traditional methods such as LLE (13).
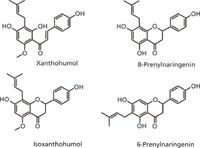
All of the current sample extraction methods (DBS, SPE, and LLE) have advantages and limitations. The aim of this study is to combine aspects of DBS, SPE, and LLE methods to develop and validate a novel paper strip extraction (PSE) method that maximizes the strength of each while eliminating the weaknesses. The PSE method uses an LC–MS-MS compatible elution solvent for analyte extraction. PSE also incorporates filter paper as its adsorption material, similar to DBS, but enlarges size and alters shape to account for larger sample size and eliminates one of the drawbacks of DBS — the need for high analyte concentration because of small samples, which dictates a small concentration range for analyte detection. We evaluated the PSE method in the analysis of natural product metabolites (Figure 1) in biological samples obtained from a human pharmacokinetic study of xanthohumol, a hop prenylflavonoid.

Figure 1: Structures of analytes of interest: natural product metabolites of xanthohumol, a hop prenylflavonoid with antiobesity activity.
Experimental
Sample Preparation
A pharmacokinetic (PK) study of a natural product, xanthohumol (XN), a hop prenylflavonoid with antiobesity activity (14), provided all human plasma and urine samples utilized in the PSE method development. Details of the PK study are fully described elsewhere (15). Before extraction, samples underwent enzymatic hydrolysis for conversion of glucuronide conjugates to their corresponding aglycones. Incubation mixtures consisted of 100 μL of biological sample; 380 μL of 0.1 M sodium acetate buffer (pH 4.7); 10 μL of an internal standard, 4,2'-dihydroxychalcone; and 100 μL of Helix pomatia sulfatase–glucuronidase for a total volume of 600 μL. We incubated samples for 2 h at 37 °C in 2-mL screw-cap tubes before proceeding with either LLE or PSE.
Liquid–Liquid Extraction
After incubation, we extracted samples with diethyl ether (3 × 1 mL) before drying under nitrogen gas and reconstitution in methanol.
Paper Strip Extraction
After incubation, we vortexed (10 s) and centrifuged (2 min, 13,000 rpm) the samples. We placed pointed paper strips (Whatman #1 filter paper, 8 × 45 mm) in the sample tubes with the tip immersed in the sample solution. Samples were dried overnight onto paper strips in a vacuum dessicator over Drierite (W.A. Hammond Drierite Co.). Dry paper strips were extracted with acidified methanol (0.1% formic acid, 0.5 mL). After the addition of the extraction solvent, samples were vortexed (30 s) and were shaken (30 min) before removal of paper strips. After centrifugation (2 min, 13,000 rpm), we conducted LC–MS-MS analysis for XN and its metabolites (isoxanthohumol [IX], 8-prenylnaringenin, [8PN], and 6-prenylnaringenin [6PN]).
MS Conditions
We described LC–MS-MS conditions for identification and quantitation of XN and its metabolites in earlier work (16).
Comparison of Extraction Methods
We compared LLE and PSE for accuracy, precision, and recovery of XN and its metabolites (IX, 8PN, 6PN).
Calibration Curves
We prepared primary standard stock solutions of XN as well as a metabolite mix (IX, 8PN, 6PN) in methanol. From stock solutions, we aliquoted seven concentrations of XN as well as its metabolites and used the solutions to construct matrix-based standard curves to analyze human plasma and urine samples.
Accuracy
We spiked blank human plasma samples with three different concentrations (n = 6 per concentration level) of XN, IX, 8PN, and 6PN to evaluate the accuracy associated with PSE.
Precision
We analyzed samples from three subjects in the XN PK study in replicates of six to determine precision of PSE. Subjects 1001, 1003, and 1005 received 20, 60, and 180 mg XN, respectively.
Recovery
We performed recovery experiments in replicates of five by comparing analytical results (peak area ratios of analyte to internal standard) for extracted samples (that is, extracts of blank plasma samples spiked with known amounts of analytes) at three concentrations with unextracted samples that represent 100% recovery.
Results and Discussion
General Observations
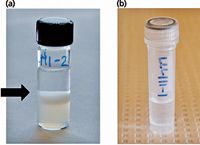
Based on previous work with LLE in XN analysis (16,17) and current PSE experimental findings, we noted similar accuracy and precision for both PSE and LLE, but better analyte recovery with PSE compared to LLE from urine samples. We also observed that there is less chance of sample contamination and analyte losses with PSE versus LLE because of the complex interface that occurs in LLE, which makes phase extraction intricate and time-consuming (Figure 2). We processed samples manually at a rate of 4 min/sample with LLE compared to 1 min/sample with PSE. PSE also requires less organic solvent; previous works by us (16) as well as others (18) demonstrate that traditional LLE methods for XN analysis use 3–4 mL of solvent compared to 0.5 mL solvent for PSE.

Figure 2: Representative images of human plasma samples following (a) liquidâliquid and (b) paper strip extraction before sample removal for LCâMS-MS analysis. The black arrow in (a) denotes the emulsion interface between the aqueous and organic phases.
Calibration Curves
Calibration curves included seven different analyte concentrations (10, 20, 40, 100, 200, 400, and 800 nM), with the lower limit of quantitation (LLOQ) and upper limits of quantitation (ULOQ) defined as the lowest and highest standard of the calibration curve, respectively. We evaluated matrix-based calibration standards and validation quality control (QC) samples using the following acceptance criteria: LLOQ is within 80–120% accuracy compared to nominal concentration; standards other than LLOQ are within 85–115% accuracy compared to nominal concentration; and at least five out of seven nonzero standards meet the above criteria, including the LLOQ and ULOQ. Human plasma and urine matrix-based calibration curves for XN, IX, 8PN, and 6PN met all of the criteria. We found that a linear-based regression model described the relationship between analyte concentration and response best (Figure 3).

Figure 3: (a) Human plasma and (b) urine matrix-based calibration curves produced using paper strip extraction before LCâMS-MS analysis of xanthohumol (XN) and its metabolites (isoxanthohumol [IX], 8-prenylnaringenin [8PN], and 6-prenylnaringenin [6PN]). Each concentration level was analyzed in triplicate.
Accuracy
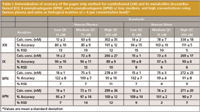
We assessed accuracy of the PSE method by replicate analysis (n = 6) of plasma and urine samples containing known amounts of the analyte at three concentration levels: a low QC, 15 nM; a mid-range QC, 75 nM; and a high QC, 300 nM. The deviation of the mean from the true value served as the measure of accuracy. PSE met the Food and Drug Administration (FDA) method validation requirements (19) for accuracy (85–115%, except at concentrations at or near the LLOQ, which were still within 80–120%) at all three concentration levels for both plasma and urine (Table I). Accuracy data for PSE corresponds to findings from LLE (18).

Table I: Determination of accuracy of the paper strip method for xanthohumol (XN) and its metabolites (isoxanthohumol [IX]; 8-prenylnaringenin [8PN]; and 6-prenylnaringenin [6PN]) at low, medium, and high concentrations using human plasma and urine as biological matrices (n = 6 per concentration level)*
Precision
Precision experiments used plasma and urine samples from XN PK study participants who received three different doses of XN (20, 60, or 180 mg XN). PSE met FDA method validation requirements (19) for precision (RSD ≤15% except at concentrations at or near the LLOQ, where RSD was ≤20%) for both plasma and urine (Table II) for XN and IX. The metabolites 8PN and 6PN were not detected in the human plasma or urine samples of dosed subjects.

Table II: Determination of precision of the paper strip method for xanthohumol (XN) and its metabolites (isoxanthohumol [IX]; 8-prenylnaringenin [8PN]; and 6-prenylnaringenin [6PN]) at low, medium, and high concentrations using plasma and urine samples from subjects receiving various doses of XN in a pharmacokinetic study (n = 6 per concentration level). Subjects 1000, 1003, and 1005 received a single oral dose of 20, 60, or 180 mg xanthohumol, respectively.*
Recovery
We executed recovery experiments by comparing the analytical results for extracted samples (that is, extracts of blank plasma and urine samples spiked with known amounts of analytes) at three concentrations (low, medium, and high) with unextracted standards that represent 100% recovery in replicates of five. The recovery of IX, 8PN, 6PN, and XN ranged from 65–117% at various plasma and urine concentration levels (Table III). All concentration levels had an RSD ≤15%, which met the FDA method validation requirements (19). We also observed better recovery of XN from urine samples with PSE (65–101%) compared to LLE (60–80%).

Table III: Determination of analyte recovery of xanthohumol (XN) and its metabolites (isoxanthohumol [IX]; 8-prenylnaringenin [8PN]; and 6-prenylnaringenin [6PN]) at low, medium, and high concentrations using paper strip extraction with human plasma and urine as biological matrices (n = 5 per concentration level)*
Conclusion
Rising incidences of chronic diseases worldwide have spurred great interest in advancing analytical techniques for effective analysis of therapeutic drugs. Advances in analytical MS instrumentation have allowed for high throughput methods that are also very sensitive and specific; however MS analysis may be significantly influenced by sample preparation methods. In creating a novel PSE method, we combined the individual strengths of common methods including DBS, SPE, and LLE while removing the drawbacks. The PSE method was evaluated using plasma and urine samples from a human XN PK study and resulted in 80–122% accuracy over a large range of concentrations, ≤15% RSD for precision, and losses of ≤35% for XN and its metabolites. In terms of accuracy, precision, and recovery, PSE performs similarly to or better than LLE while offering several benefits including less solvent use, reduced exposure to toxic solvents, higher sample throughput, and lower labor costs.
LeeCole L. Legette, Ralph L. Reed, and Jan F. Stevens are with the Linus Pauling Institute and the College of Pharmacy at Oregon State University in Corvallis, Oregon. Lia Murty is with the College of Pharmacy at Oregon State University. Claudia S. Maier is with the Department of Chemistry at Oregon State University. Direct correspondence to: fred.stevens@oregonstate.edu
References
(1) K. Strong, C. Mathers, J. Epping-Jordan, and R. Beaglehole, Int. J. Epidemiol. 35(2), 492–494 (2006).
(2) D. Yach, C. Hawkes, C.L. Gould, and K.J. Hofman, JAMA 291(21), 2616–2622 (2004).
(3) H. Gika and G. Theodoridis, Bioanalysis 3(14), 1647–1661 (2011).
(4) T. Hyotylainen, Anal. Bioanal. Chem. 394(3), 743–758 (2009).
(5) H. Kataoka, Anal. Sci. 27(9), 893–905 (2011).
(6) W.M. Mullett, J. Biochem. Biophys. Methods 70(2), 263–273 (2007).
(7) C. Nerin, J. Salafranca, M. Aznar, and R. Batlle, Anal. Bioanal. Chem. 393(3), 809–833 (2009).
(8) L. Novakova and H. Vlckova, Anal. Chim Acta 656(1–2), 8–35 (2009).
(9) Y. Saito, M. Kawazoe, M. Imaizumi, Y. Morishima, Y. Nakao, K. Hatano, M. Hayashida, and K. Jinno, Anal. Sci. 18(1), 7–17 (2002).
(10) C. Mahugo Santana, Z. Sosa Ferrera, M. Esther Torres Padron, and J. Juan Santana Rodriguez, Molecules 14(1), 298–320 (2009).
(11) F. Degel, Clin. Biochem. 29(6), 529–540 (1996).
(12) A. Thomas, J. Deglon, T. Steimer, P. Mangin, Y. Daali, and C. Staub, J. Sep. Sci. 33(6–7), 873–879 (2010).
(13) J. Deglon, A. Thomas, P. Mangin, and C. Staub, Anal. Bioanal. Chem. 402(8), 2485–2498 (2012).
(14) J.S. Kirkwood, L.L. Legette, C.L. Miranda, Y. Jiang, and J.F. Stevens, J. Biol. Chem. 288(26), 19000–19013 (2013).
(15) L. Legette, C. Karnpracha, R.L. Reed, J. Choi, G. Bobe, J.M. Christensen, R. Rodriguez-Proteau, J.Q. Purnell, and J.F. Stevens, Mol. Nutr. Food Res. in press, http://www.ncbi.nlm.nih.gov/pubmed/24038952 (2013).
(16) L. Legette, L. Ma, R.L. Reed, C.L. Miranda, J.M. Christensen, R. Rodriguez-Proteau, and J.F. Stevens, Mol. Nutr. Food Res. 56(3), 466–474 (2012).
(17) L.L. Legette, A.Y. Luna, R.L. Reed, C.L. Miranda, G. Bobe, R.R. Proteau, and J.F. Stevens, Phytochemistry 91, 236–241 (2013).
(18) Y. Yuan, X. Qiu, D. Nikolic, J.H. Dahl, and R.B. van Breemen, J. AOAC Int. 95(6), 1744–1749 (2012).
(19) US Food and Drug Administration, Guidance for Industry: Bioanalytical Method Validation, (FDA, Rockville, Maryland, 2001).

Polysorbate Quantification and Degradation Analysis via LC and Charged Aerosol Detection
April 9th 2025Scientists from ThermoFisher Scientific published a review article in the Journal of Chromatography A that provided an overview of HPLC analysis using charged aerosol detection can help with polysorbate quantification.
Analyzing Vitamin K1 Levels in Vegetables Eaten by Warfarin Patients Using HPLC UV–vis
April 9th 2025Research conducted by the Universitas Padjadjaran (Sumedang, Indonesia) focused on the measurement of vitamin K1 in various vegetables (specifically lettuce, cabbage, napa cabbage, and spinach) that were ingested by patients using warfarin. High performance liquid chromatography (HPLC) equipped with an ultraviolet detector set at 245 nm was used as the analytical technique.
Removing Double-Stranded RNA Impurities Using Chromatography
April 8th 2025Researchers from Agency for Science, Technology and Research in Singapore recently published a review article exploring how chromatography can be used to remove double-stranded RNA impurities during mRNA therapeutics production.


