An LC–IR Hyphenated Approach to Characterize Polymeric Excipients in Pharmaceutical Formulations
Special Issues
William W. Carson, Ming Zhou, and Tom Kearney
Liquid chromatography (LC)–IR is a powerful new tool for copolymer and especially pharmaceutical excipient analysis. In this paper, an automated, self-regulating solvent-removal interface is described. The hyphenated interface is compatible with all common chromatography solvents, from 100% water through low- and high-boiling-point organic and halogenated solvents, including acetonitrile, methanol, tetrahydrofuran, dimethyl sulfoxide, hexafluoroisopropanol, and trichlorobenzene. Like LC–mass spectrometry (MS), LC–IR is limited to the use of volatile buffers. Unlike MS, which looks at molecular fragments, IR looks at the vibrational resonances of molecular bonds. For large molecules, such as copolymers, IR's ensemble-averaging of like bonds simplifies interpretation. This makes LC–IR the analytical method of choice to determine copolymer compositions across any chromatographic separation, including molecular weight distributions. Functionally-critical copolymer excipients are being incorporated increasingly in pharmaceutical formulations to provide controlled release and increased bioavailability of the active pharmaceutical ingredient. Copovidone, HPMCAS, and Eudragit examples are presented showing LC–IR analysis of copolymer excipients to measure supplier-to-supplier and lot-to-lot variations, and identify and characterize melt processing degradation and compositional stability. These measurements are important in developing quality-by-design formulations for poorly water-soluble drugs. In addition to being responsive to the primary bond, the IR vibrational spectra are influenced by the local chemical environment, allowing discrimination and identification of many isomers. Chromatography, hyphenated conveniently and automatically to solvent-free solid-phase Fourier-transform (FT)-IR, is an important new analytical tool.
Why are hyphenated systems important, and how are they achieved?
Hyphenated systems refer to the on-line real-time coupling of a powerful, typically physical separation technique with a superficially incompatible, powerful, high-information-content, typically spectroscopic analytical technique. The "hyphen" refers to the process and hardware used to make these techniques compatible, and turns the entire hyphenated system into a single instrument. A single analysis by a hyphenated instrument produces more information of better quality in minutes or hours than days to months of tedious fraction collection, processing, and off-line analysis. Often, sample degradation, handling losses, and contamination preclude the possibility of manually producing this data. By first separating either the discrete chemical compounds or creating a continuous copolymeric distribution, the spectroscopic instrument can provide more specific information with greater precision, especially about minor components. The sensitivity, selectivity, and specificity are increased greatly by hyphenation. Increasing the resolution of any single analytical technique produces a less than linear (typically square root) increase in the information capacity. The information capacity of a hyphenated system is the product of the resolving power of the hyphenated techniques.
Chromatography is the most powerful widely practiced separation technique. Gas chromatography–mass spectrometry (GC–MS) was the first widely used hyphenated technique, because it was the first to be hyphenated effectively. Capillary GC typically uses 1 sccm of He carrier gas. The MS system requires a sufficiently high vacuum to allow ionized analyte to move essentially collision-free through the analysis process, which requires a carrier gas density reduction of more than a millionfold. The GC–MS hyphen often incorporates a molecular momentum separator that allows analytes to be transferred but greatly reduces the GC carrier gas, thereby facilitating the radically different carrier gas densities both techniques require. GC–MS is the dominant analytical technique for volatile compounds that are thermally stable. Unfortunately, most large molecules and aqueous solution–ionizable small molecules, including most active pharmaceutical ingredients (APIs), are not volatile.
Liquid chromatography (LC) can separate a much larger range of compounds; essentially, anything that can be dissolved. The hyphen between LC and MS is much more difficult, since 1 mL/min of liquid contains about 1000 times the number of carrier molecules of GC, and these solvent molecules are much heavier than He. LC–MS hyphens remove the solvent and provide discrete ionized or ionizable analyte molecule to the MS. Numerous LC–MS hyphens have been developed, but atmospheric pressure ionization based on various forms of electrospray dominates. None of these interfaces can bring more than a very minor fraction of the analyte molecules eluting from conventional scale (~1 mL/min) LC separations into the MS system. A major challenge is desolvation. Sufficient heat to vaporize the solvent cannot be stored in the liquid without causing thermal decomposition of most samples. Electrostatics provide or assist in the nebulization, and excess heated gas provides the heat of vaporization to evaporate the solvent. The vaporized solvent is separated from the analyte by successive vacuum stages with electrostatic focusing to reduce loss of the analyte. Fortunately, the exquisite sensitivity of MS makes even low efficiency hyphenation of LC to MS very useful. Significant mass-sensitivity advances in LC–MS are being accomplished by reducing the LC scale. The very low electrospray-based hyphenation capacity is demonstrated vividly by the observed essentially constant, LC electrospray-based hyphen MS concentration sensitivity from 1 mL/min to 1 µL/min. This demonstrates that less than 0.1% of conventional-scale LC analyte is ionized and transferred through the hyphen!
Why Is LC–IR Needed?
Although LC can separate virtually anything that can be dissolved, MS has some severe limitations, including ionization and ion suppression issues and the nature and ability to interpret the data. MS fragments molecules and can determine the mass of ionized fragments. Only by inference and major effort can MS get information about the "glue" or "nodes" that connect these fragments. IR directly measures the "glue," or the vibrational resonances of the molecular bonds, holding molecules together. Subtle changes in the IR resonant frequencies also give lots of "fingerprint" information about the broader environment of these chemical bonds. This gives IR the ability to differentiate secondary structure, including discrimination of many isomers. The IR spectrum is especially strong in differentiating isomers of diverse functional groups, being the spectroscopy of choice for instant classification of molecules. By way of illustration, the four compounds whose structure and spectra shown in Figure 1 are all isomers with molecular formula C8H14O2. They all have two degrees of unsaturation (rings plus double bonds), plus a variety of functionalities that the oxygen atoms may take. Mid-infrared spectral features immediately point out which groups are in each, to the eye of a spectroscopist or to a library searching program. De novo structure is determined most readily when information is available about both the fragments and the bonds. IR and MS data are highly complementary. MS, without heroic efforts, effectively is limited to the analysis of relatively small molecules. If there are lots of fragment permutations, interpretation becomes very difficult. This occurs with even relatively small polymers. Because IR looks at the ensemble average of each kind of molecular bond (resonant vibrational frequency), it gives a very good and quantitative characterization of a polymer's chemical composition. While nuclear magnetic resonance (NMR) spectroscopy can obtain this information for bulk samples, LC–IR allows the composition to be determined conveniently across any distribution, which can be obtained from the many modes of LC separation. The "hyphen FT-IR" also can be used as the detector for other liquid separation processes, such as temperature rising elution fractionation (TREF, which is crystallinity based) and many of the large-capacity field-flow fractionation (FFF) processes.
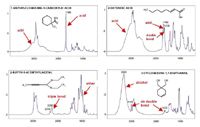
Figure 1: FT-IR spectra of four isomers with the formula C8H14O2.
What Are the Challenges of Hyphenating LC with FTIR?
Interference: Analytical LC eluent has a very low average concentration of analyte. A typical analytical injection volume of 1/1000 of the elution volume (a 20-µL injection for 20 mL total elution volume) with a typical concentration of 1 mg/mL gives an averaged eluent concentration of 1 ppm for the entire sample. Minor components are much lower in concentration. High performance liquid chromatography (HPLC)-grade solvents are not pure. Because they are purified by distillation, they typically have very low amounts of nonvolatile impurities but many parts per million of volatile impurities. "HPLC grade" solvents are qualified by the vendor's anticipated detector-interfering impurities. Typically, HPLC grade means low UV absorbance. Virtually every molecule except a few simple inorganic salts has a mid-IR spectrum. This makes mid-infrared FT-IR a nearly universal detector. This is both an asset and a liability. Because the HPLC solvent is present at a million times the average total analyte concentration, even the IR solvent "windows" have very significant "trace levels" of either intrinsic absorbance or absorbance from volatile impurities. Therefore, achieving reasonable IR sensitivity requires removal of the solvent, especially for the non-major constituent analytes.
Sensitivity: FT-IR is an absorption process. The detection limit is determined by the minimum observable attenuation of light transmission within the available time period, which is the elution duration of a chromatographic resolution element. Mid-IR detectors, such as the cryogenic mercury-camium-telluride (MCT) detector used in the DiscovIR-LC system (Spectra Analysis, Marlborough, Massachusetts), have a maximum illumination limit. The intrinsic noise level of these detectors is related inversely to the detector size. A smaller detector with lower noise results in a better signal-to-noise ratio. Despite mid-IR's many advantages, it is intrinsically much less sensitive than MS. (MS can approach single-molecule detection).
Desolvation: As with MS, providing the heat of vaporization without thermally damaging the analyte molecules is a major challenge. The latent heat of vaporization cannot be stored as sensible heat in the liquid stream without thermally degrading the analyte. Most nebulization processes result in a wide range of droplet sizes, so the amount of heat required to complete the evaporation is highly variable. Providing sufficient heat to evaporate the average size droplet would thermally degrade the analyte in the smaller droplets, and leave a large amount of liquid solvent in the larger droplets. Using large amounts of gas to transfer the heat of vaporization at an acceptable temperature would overpower the vacuum pumps used in the aerosol focusing and deposition system. Transferring only a small fraction of the analyte, like electrospray MS interfaces do, would not provide sufficient sensitivity for IR.
Analyte deposit geometry: Because FT-IR is an absorbance process, the geometry of the sample during the measurement process matters. For a fixed mass or volume of analyte, reducing the diameter by a factor of two creates a deposit with four times the thickness and four times the optical density. Because the IR detector is total light limited, this deposit diameter reduction of two improves the signal-to-noise ratio by four times.
Therefore, to achieve a useful instrument that produces full mid-infrared spectra, the LC–IR hyphenation process must:
- Remove the solvent without thermally damaging the analytes or overloading the vacuum system with diluent gas.
- Have efficient transmission of analytes to the spectrometer.
- Present analytes to the FT-IR in a thick deposit.
- Preserve the chromatographic resolution.
LC–IR description and operation
Figure 2 shows a block diagram of a modern solvent-removing LC–IR system. Figure 3 shows the system's Hyphen solvent-removal interface in detail. This novel, small-scale, spray drier preserves temporal resolution while desolvating the LC eluent. The resulting aerosol stream of dried solute is deposited onto a slowly rotating disk for continuous transmission infrared spectrographic analysis. Figure 4 shows a partially ejected ZnSe disk with the white spiral deposits from multiple size-exclusion chromatograms of HPC, HPMC, and povidone excipients and a drug formulation. The solvent removal, deposition, and FT-IR instrument described in this paper and used for the application examples consist of the components listed below, described in the order of the chromatographic effluent flow path:
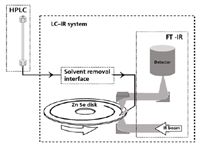
Figure 2: Block diagram of an LCâIR system.
Automated nebulizer: The LC eluent is pumped through a heated nebulizer to create a high-speed jet of micrometer-sized liquid droplets that contain all the solute. The jet is propelled by rapidly expanding solvent vapor. The thin-wall metal capillary tube nebulizer is regulated to evaporate approximately half the solvent. The nebulizer is electrically heated by passing a current from end to end. Solvent expansion upon conversion to vapor increases the nebulizer back pressure, which increases the solvent boiling point and the nebulizer operating temperature. The nebulizer wall temperature is monitored by changes in the tube's electrical resistance. Nebulizer power is adjusted continuously using the capillary electrical resistance for feedback control. Fully automatic de novo gradient control is achieved for solvent compositions varying between 100% organic and 100% water with flow variations between 0.5 and 2 mL/min.
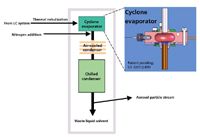
Figure 3: Detailed schematic of the self regulating solvent-removal interface.
Self-regulating solvent evaporation from the droplets without analyte thermal damage or evaporative loss: The high-speed jet of droplets is directed circumferentially inside a hot cylindrical cavity called a cyclone. Centrifugal force causes the liquid droplets to travel along the diameter of the cavity. The cavity surface is heated to cause the droplets to film boil. Film boiling causes a layer of solvent vapor to form between the droplets and the cyclone wall, which prevents droplet contact with the cavity surface. This lack of wall contact retains the solute in the droplets. (Film boiling can be observed by splashing a few drops of water onto a very hot fry pan. Rather than sticking to the pan and forming steam bubbles [nucleate boiling], in film boiling the evaporating water vapor levitates the droplets and they "dance" around above the surface of the pan. If hard water is used, or salt is added, a small white particle will remain when the evaporation is complete.) Evaporative cooling protects the solute by limiting the maximum temperature to the solvent boiling point. The solvent boiling point is reduced by reducing the pressure into which the solvent evaporates from the droplets. Within milliseconds, the droplets evaporate most of their solvent, dramatically reducing their mass and the centrifugal force, which retains them in the cavity. The droplets become sufficiently low in mass that viscous drag from the levitating solvent vapor overcomes the centrifugal force and "jet propels" the droplets out through the axis of the cylindrical cavity. The droplet trajectory controlling transition from centrifugal force to viscous drag causes the evaporation process to be intrinsically self regulating: Regardless of starting diameter, all droplets are ejected at a uniform size after receiving just the right amount of heat. As the droplets travel from the cyclone wall to the condenser, these uniform sized droplets receive the same amount of additional heat transfer from their superheated solvent vapor environment. This further dries the droplets into particles.
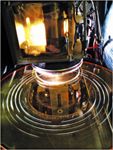
Figure 4: Photograph inside the LCâIR vacuum chamber showing the golden orange colored ZnSe IR-transparent deposition disk. The disk is ejected partially to show spiral white deposited aqueous size-exclusion chromatograms containing the excipients HPC, HPMC, and povidone, and a formulation of these with an API.
Solvent removal: Solvent vapor condenses onto the cooled condenser walls, and drains into the waste bottle by gravity. Viscous Stokes drag from an added noncondensable carrier gas maintains the dried particles in suspension.
Focused deposition: After the majority of the solvent vapor has been removed by the condenser, the sample aerosol is drawn to the LC–IR system. Vacuum sucks the aerosol through a nozzle that focuses and impacts the particles onto the surface of a CD-sized IR-transparent ZnSe disk. During operation, the disk surface is temperature-controlled to trap the sample particles. For some samples, the aerosol particles can bounce when impacting the disk. For these samples the condenser and disk temperatures are controlled to maintain a small patch of liquid solvent on the surface of the disk. This liquid absorbs the particle impact energy and prevents bouncing.
Near-real-time FT-IR detection: The disk slowly rotates and very slowly translates to deposit the chromatogram in a shallow spiral similar to a phonograph record groove. In addition to drawing the aerosol through the focusing nozzle, the vacuum provides thermal insulation to the disk and facilitates rapid removal of any residual solvent captured on the disk. The disk rotates at a user-specified speed chosen to preserve the chromatographic resolution and maximize the deposit thickness. This is typically a few millimeters per minute. Disk rotation continuously carries the deposit through the focal point of the internal IR microscope. A liquid nitrogen-cooled MCT detector measures a 100-µm length of the deposited chromatogram. The deposit is illuminated by a 650–4000 cm-1 modulated FT-IR beam. A full spectrum is collected every 0.4 s. The spectra and updated chromatogram are displayed as they are collected, less than a minute after elution from the chromatograph. The deposited chromatograms are available for rescanning, where signal averaging can reduce the detection noise. The disk holds more than 8 h of chromatography. The reusable disk is cleaned by wiping with solvent. Disk ejection and loading is push-button controlled, similar to a DVD player.
Data collection, processing, and system control: The system is controlled by a PC operating an augmented version of Galactic GRAMS software (Thermo Fisher Scientific, Waltham, Massachusetts). Inject and not-ready contact closure–TTL signals coordinate data collection with the chromatography system's auto injector. The PC can control the chromatographic system optionally. Custom workbooks are used for interactive combined spectral and chromatographic data analysis, data reduction, library searching, and creation, as well as report generation.
Polymer Applications of GPC–IR
A polymer is a mixture of many large molecules composed of repeating structural units with different polymer chain lengths or molecular weights. Polymers that contain only a single type of repeat unit (A) are known as homopolymers PolyA, while polymers containing a mixture of repeat units (A, B, C . . .), such as Poly(A-B), are known as copolymers. Polymer properties are strongly dependent on types of the repeat units, their arrangement along the polymer chains, their interactions between the polymer chains, and the chain length or molecular weight distributions. The polymer chain length or size strongly affects the polymer physical properties, such as melting point, melt viscosity, glass transition temperature, strength, and impact resistance. For copolymers, how the repeat units (A, B, C . . .) are arranged along the polymer chain (for example, randomly, through blocks, or via grafting) will greatly affect polymer properties, giving polymer scientists and engineers great freedom to design unique copolymer architecture to tailor polymer properties for various applications. To understand the correlation between the copolymer structure at the polymer chain level and the polymer material properties for the field applications, there is a strong need to characterize the copolymer structural compositions at different polymer chain lengths. The gel permeation chromatography (GPC)–IR hyphenated technique combines physical separation of molecule hydrodynamic sizes by GPC or size-exclusion chromatography (SEC) with chemical composition fingerprinting by FT-IR. The LC–IR system takes snapshot IR spectra of copolymers or polymer mixtures for chemical compositions at each molecule weight slice to map out polymer compositional variations across the whole molecular weight distribution (MWD), which can be visualized in a 3D plot as shown in Figure 5.
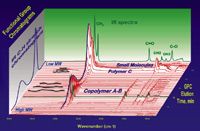
Figure 5: A 3D data view of GPCâIR characterization of a polymer mixture sample consisted of copolymer A-B, polymer C, and some small molecular additives. The resultant data matrix is a time-ordered sequence of IR spectra versus molecular size.
Figure 6 illustrates how GPC–IR characterizes the compositional variations of a copolymer poly(A-B) across the MWD and its comparison with other analytical techniques. GPC separates the poly(A-B) molecules on the basis of their molecular sizes and FT-IR continuously fingerprints the chemical composition after eluant desolvation at each molar mass slice (correlated to GPC elution time). The characteristic IR peaks contributed from comonomers A and B can be calculated easily for A/B ratios across MWD to map out the compositional variations, as shown in the violet curve. When the same sample is analyzed by regular bench-top FT-IR or NMR spectroscopy, only bulk average 50% A will be obtained, whereas MS is limited to evaluate the low molecular weight portion of the polymer sample.
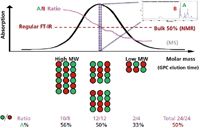
Figure 6: GPCâIR to characterize compositional variations (violet curve A/B ratios) of copolymer poly(A-B) across MW distributions while regular bench-top FT-IR or NMR analysis only gives bulk average (50% A).
The major application of GPC–IR is to characterize compositional variations of copolymers and polymer mixtures across MWD in pharmaceutical, polymer, materials, and chemical industries.
1. Characterize copolymer compositional/structural variations across MWD: compositional A–B ratio changes of poly(A-B) copolymer with different chain sizes.
a. Lot-to-lot, supplier-to-supplier variations, branching analysis
b. Poly(A-B-C): map out A–B–C ratios across MWD
2. Characterize any changes of copolymers and polymer mixtures.
a. Copolymer modification from poly(A-B) to poly(A-B')
b. Copolymer degradation from poly(A-B) to poly(A-C) and degradant D (small molecule): mechanism, API–degradant interactions, shelf life, ageing test
c. Polymer failure analysis: poly(A-B) backbone break down to poly(a-b) with lower MWD
d. Trouble shooting: which polymer got degraded or cross-linked in the polymer mixtures poly(A-B) + polyC, contamination issues, impurity problems, and so forth
3. Deformulate polymer mixtures of homopolymers and copolymers: for example, poly(A-B) + polyC, find polymer blend ratio AB/C across MWD. For example, some generic drug companies want to know what grade of a particular excipient was used in a brand-named medicine involved with multiple excipients (for example, copovidone, HPC, and HPMC) and their ratios.
Polymeric excipients play an important role in pharmaceutical industry for the controlled release of APIs and new drug delivery technology. The following are a few case studies of GPC–IR applications in excipient characterization and formulation development.
Application Case I: Copovidone Supplier-to-Supplier Variations in Drug-Controlled Release
Copovidone is a popular excipient used in controlled release. It is a random copolymer (Figure 7) of vinyl pyrrolidone (VP) and vinyl acetate (VAc) at 60:40 bulk average ratio, as specified by suppliers and approved by FDA. Drug release properties are modulated by the presence of the less hydrophilic vinyl acetate comonomer. The comonomer content influences polymer binding capacity for an API, hydrophobicity, solubility upon ingestion, and release kinetics.
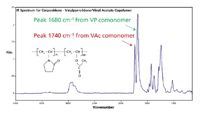
Figure 7: A snapshot IR spectrum taken from the LCâIR system run on a copovidone sample examined. The two comonomers each present strong, well-separated carbonyl IR bands, which were used to track the relative concentrations of the comonomers (VP and VAc).
Three copovidone samples were obtained from different suppliers (A, B, C) and made from different production processes, although they all meet the same requirements on the certificates of analysis. Each sample was analyzed by GPC–IR and a set of time-ordered IR spectra (one shown in Figure 7) were obtained at each elution time slice (MW slice). Using the data processing software of the instrument, chromatograms of the maximum intensity IR bands were extracted, including characteristic functional group absorbances centered at 1740 cm-1 (VAc) and 1680 cm-1 (VP). The peak height ratios of carbonyl absorptions of acetate and pyrrolidone functional groups on IR spectra at each polymer MW slice represent the comonomer ratios of VA and VP. The hydrophobic VA–hydrophilic VP ratios (%VAc solid curves in Figure 8) of Copovidone varied significantly from high to low MW (dotted curves), and from supplier A to supplier C, which may affect phase separation and excipient dissolution behavior in a drug formulation (1,2). There was a particular API formulation case where copovidone A gave clear tablets while copovidone C led to cloudy ones.
A ratio chromatogram was generated from chromatograms of the infrared bands A1740 and A1680. Such a ratio chromatogram effectively cancels the varying mass of polymer along the deposit track, and reflects solely the changing concentration of the two comonomers. Algebraic transforms were applied to convert the chromatogram vertical axis to the vinyl acetate comonomer concentration. The horizontal (elution time) axis was expressed as log MW, using the column calibration curve.
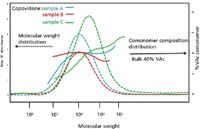
Figure 8: Copovidone compositional variations across the MWD from different manufacturing processes (A, B, C). Dotted curves are MW distributions and solid curves are %VAc comonomer for samples A, B, and C.
The samples A and C demonstrated a significant composition drift (change of comonomer VAc percent) with varying profiles across the elution profile (MWD). There was a consistent trend among these samples for the pyrrolidone content to be greatest in the high molecular weight eluent and to decrease with later eluting (lower MW) fractions. These variations pose an implication for the performance of this class of polymers and similar polymers being used as excipients that affect the kinetics of drug release. The comonomer ratio also may affect the solubility and biorelease characteristics of the resultant drug formulation. All three of the samples were reported as synthesized to a standard 60% PVP–40% PVAc bulk composition. The manufacturers' stated "bulk composition" only addresses overall content of comonomers, and does not address the heterogeneity that exists within the population of polymer molecules. It also suggests that users of a copovidone copolymer must be cognizant of compositional heterogeneity, supplier-to-supplier variation, and possible lot-to-lot variation. It may be inadequate to just use the bulk content specification of vinyl acetyl content to define the binding and release characteristics of the polymer and the compositional drift may be a desired specification of acceptance criteria.
Product consistency is a paramount requirement in the manufacture of controlled release pharmaceutical products. If polymers possess batch-to-batch or supplier-to-supplier variability, this may be reflected in drug performance. More thorough characterization of these critical polymeric excipients may be required for consistent and optimal performance of a finished therapeutic product. The GPC–IR technology provides insight to the excipient properties not readily apparent in traditional bulk assays.
Application Case II: Excipient Degradation from Thermal Processing
Polymeric excipients are used increasingly to enhance and control the delivery of APIs. They play an especially crucial role in delivery of poorly soluble drugs. HPMCAS and Eudragit L100-55 (Evonik Industries, Darmstadt, Germany) excipients are used commonly in hot melt extrusion process to make solid dispersions for low solubility drugs to improve their bioavailability. However, under high processing temperatures and high shear mixing, they could degrade to form a new chemical functionality or to generate a degradant that might not interact with API as designed. GPC–IR can be used to monitor the thermal processing and to define safe processing window as a quality-by-design (QbD) tool.
HPMCAS and Eudragit L100-55 excipients were hot melt extruded under different temperatures, screw speeds, and throughputs. An FT-IR detector was hyphenated to the GPC separation of the processed excipient samples and was used to detect degradant formation and analyze polymer compositional/structural changes. Three grades of HPMCAS were analyzed by GPC–IR, which identified five different IR peaks for the five functional groups and mapped out grade-to-grade and lot-to-lot variations across the MWD. However at high process temperature over 200 °C in hot melt extrusion process, GPC–IR also detected succinic acid/ester generation as a degradant and more hydroxyl formation (Figure 9) along the polymer chains, which are important evidence to understand the degradation mechanism: succinate side group break down to generate succinic acid and leave OH along polymer chains.
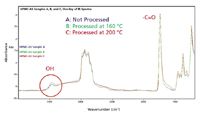
Figure 9: HPMCAS excipient led to more OH formation at high processing temperature 220 °C (red IR spectrum).
Eudragit L100-55 excipient is a copolymer of methacrylic acid and ethyl acrylate. Both functional groups can be identified easily on FT-IR spectra (Figure 10) at 1705 cm-1 for COOH and 1735 cm-1 for COOEt. When Eudragit L100-55 excipient was hot melt extruded at 130 °C, 160 °C, and 190 °C at 250 rpm screw speed, GPC–IR detected carboxylic anhydride degradant identified as a new functionality at 1805 cm-1 (Figure 10) from Eudragit L100-55 samples processed at 160 °C and 190 °C. Higher process temperatures led to more carboxylic anhydride formation and also showed more polymer degradation, as indicated by COOH peak reduction at 1705 cm-1 and 3400–3000 cm-1 from GPC–IR spectra and by acid:ester ratio decreases with further chemometrics data analysis. These data clearly indicated that the main functional group COOH designed to interact with poorly soluble API to form solid dispersion was cross-linked to carboxylic anhydride CO-O-CO, which is a new chemical functionality not included in the original FDA-approved excipient package. With a systematic design of experiments (DOE) involved with the major variables, GPC–IR can help formulation scientists and engineers define a safe processing window (Table I) or process design space in hot melt extrusion process as a QbD tool. This QbD tool becomes even more useful when sophisticated formulations combine multiple excipients (fingerprinted by IR spectra) with low molecular weight plasticizers and additives that will be eluted after the polymer peaks in GPC separations.
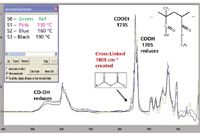
Figure 10: Eudragit L100-55 excipient cross-linked from COOH groups to carboxylic anhydride as indicated at 1805 cm-1 peak at 160 °C and 190 °C processing temperatures.
The same IR analyzer was also hyphenated to HPLC and detected aldehyde and carboxylate intermediates from a degradated PEG sample for shelf-life stability study (3).

Table I: GPCâIR results with a DOE matrix to define safe processing window (orange) and degradation problem (red zone) in hot melt extrusion process as a quality by design (QbD) tool.
Conclusion
The LC–IR solvent-removal solid-phase-deposition hyphenation technique combines any chromatographic separation (isocratic or gradient, size, normal or reverse phase, chiral, chemical affinity, and so forth) with the power of full mid-infrared vibrational spectral chemical bond determination and compositional fingerprinting to track variations across the separation. This information is highly synergistic with MS for chemical structural determination. The LC–IR system is particularly useful for copolymer characterization across chromatographically resolved molecular weight and chemical compositional distributions. LC–IR is a powerful tool to analyze compositional variations of polymeric pharmaceutical excipients, their mixtures, and their changes resulting from thermal processing. Copovidone showed significant variations in compositional drift across the molecular weight distribution with different variation patterns from different manufacturers. This is expected to influence the controlled release and bioavailability of poorly water-soluble APIs formulated with these excipients, and will likely impact supplier interchangeability. At high process temperatures and high shear mixing during hot melt extrusion, HPMCAS and Eudragit L100-55 can degrade to cause polymer compositional/structural changes and were shown to generate degradants such as succinic acid ester and anhydride functionality, which could affect excipient–API interactions in a drug formulation. LC–IR has been used to track excipient degradation or stability and to help define the safe processing window in the hot melt extrusion excipient API blending process. This information can contribute to the QbD formulation development.
William W. Carson is Senior Vice President and developer of the solvent removal interface (CarsonW@Spectra-Analysis.com) , Ming Zhou is Director of Application Engineering (ZhouM@Spectra-Analysis.com) , and Tom Kearney is Vice President Sales (KearneyT@Spectra-Analysis.com) , all with Spectra Analysis Instruments, Inc., Marlborough, Massachusetts.
References
(1) A. Viridén, B. Wittgren, T. Andersson, and A. Larsson, European J. of Pharma Sci. 36 (4–5), 392–400 (2009).
(2) K. Manokruang and E. Manias, Materials Letters 63 (13–14), 1144–1147 (2009).
(3) Application Note 016: Oxidative Degradation of Polyethyleneglycol (PEG) Studied by LC–IR , March 2008, Spectra Analysis, Inc.
Distinguishing Alcohol- from Non-Alcohol-Associated Liver Cirrhosis with LC-MS
May 7th 2025A pilot study investigating whether nicotinamide adenine dinucleotide kinase (NADK) expression is selectively diminished in alcohol-associated liver cirrhosis (AC), as well as evaluating its potential as a biomarker for this condition, measured AC and non-AC (NAC). Nicotinamide adenine dinucleotide (NAD+) and nicotinamide adenine dinucleotide phosphate (NADP+) levels in human liver samples were measured using liquid chromatography-mass spectrometry (LC-MS).

.png&w=3840&q=75)

.png&w=3840&q=75)


.png&w=3840&q=75)


.png&w=3840&q=75)


