Improving the Universal Response of Nebulization-Based UHPLC Detection
Special Issues
High performance liquid chromatography (HPLC) with light absorbance detection (UV) is limited by the dependence of detector response on the structure of the analyte. Some detection techniques based on nebulization of the mobile phase and formation of Aerosol particles demonstrate an analyte independent response that approaches "universal."
High performance liquid chromatography (HPLC) with light absorbance detection (UV) is limited by the dependence of detector response on the structure of the analyte. Some detection techniques based on nebulization of the mobile phase and formation of aerosol particles demonstrate an analyte independent response that approaches "universal." These detectors, however, show a dependence of the response on the mobile phase composition, which changes when operating in gradient mode. It has been demonstrated previously that an inverse makeup gradient can minimize this effect (1). The challenge is to simplify the process into a single chromatographic system and software platform that enables the practical implementation into everyday laboratory and regulatory settings. The synchronization of the two combined eluent streams at the mixing point, independent of the time delay effect of the column and system, can be accomplished with either controlled delay volumes or the inclusion of a second identical column. With an advanced column switching scheme, it is even possible to use both columns for analysis, increasing chromatographic throughput by alternately decoupling the re-equilibration phase to an off-line step in parallel to the next analysis, which uses the previously equilibrated column. In this article, we describe this approach along with four practical examples demonstrating the effectiveness of the inverse gradient technique.
Separation scientists are challenged continuously to measure a wider range of compounds at low levels with fast turnaround. This requirement has driven high performance liquid chromatography (HPLC) manufacturers to develop new column packing technology, along with higher pressure threshold systems and unique detection techniques, whose performance go beyond those of UV absorbance, refractive index, fluorescence, and electrical conductivity detection. The past 10 years have seen the rise in popularity of a number of innovative nonselective detection techniques that attempt to produce universal response to all analytes.
A common characteristic of these detectors is that they use nebulization to produce droplets as the mobile phase leaves the column. These are converted to analyte particles when the mobile phase is removed by evaporation. Particles can then be detected by a number of techniques, including evaporative light scattering detection (ELSD), condensed nucleation light scattering detection (CNLSD), and charged aerosol detection (CAD).
Under isocratic conditions, CAD has been shown to give near-uniform response for nonvolatile analytes, independent of their chemical characteristics. Furthermore, an analyte does not need to possess a chromophore (unlike UV absorbance) or to ionize (unlike MS) to be detected (2). However, all nebulizer-based detectors exhibit sensitivity to changes in mobile phase composition. It is an inherent physical characteristic that the nebulization process becomes more efficient as the organic content of the mobile phase increases. A change in nebulization efficiency directly translates into a change in detector response for a given analyte. Fortunately, this can be overcome by the postcolumn, predetector addition of an inverse of the mobile phase gradient used for separating analytes in the sample (1,3,4). The result is a near-constant mobile phase composition being nebulized throughout the gradient and the simple removal of nebulization efficiency changes during the analysis. For CAD, this means a near-uniform response for nonvolatile analytes under gradient conditions.
Inverse Gradient Formation
A technique was developed recently that uses a dual-gradient, high-pressure HPLC system to introduce a second solvent stream before the CAD system to maintain a constant solvent composition at the nebulizer. As described above, this minimizes the change in analyte response resulting from the change in organic content of the mobile phase. Importantly, as the detector is mass-sensitive, the dilution resulting from the additional mobile phase does not diminish the analyte's signal. Consequently, response of nonvolatile analytes is independent of its chemical structure and gradient condition.
The inverse gradient can be achieved by different approaches:
- In the first configuration, a gradient pump supplies the mobile phase that is used to separate the sample on an analytical column while a second gradient pump delivers an inverse of the first gradient. The gradient delay times of both the analytical gradient channel and the inverse gradient channel are observed or calculated, and a delay introduced, to ensure that the two gradients are synchronized at the point where they are combined (Figure 1a).
- In the second configuration, two similar columns with similar tubing lengths are installed in the system. This arrangement removes the need to calculate delay volumes (Figure 1b).
- A more advanced variation on System B (Figure 1) uses column switching and both analytical columns in tandem. This approach is discussed in more detail in the Results section.

Figure 1: Dual gradient tandem UHPLC system configured for inverse gradient with diode array and charged aerosol detectors in series.
All three techniques were found to produce similar results with regards to overcoming nebulization issues.
Experimental
This inverse gradient approach used an UltiMate 3000 RSLC system with the following system components: a model DGP-3600RS dual-gradient pump, a model WPS-3000TRS autosampler, a model TCC-3000RS temperature control module, a model DAD-3000RS diode array, an ESA Corona ultra CAD system, and Viper high pressure fittings (Dionex, Sunnyvale, California). Standards were purchased through Sigma-Aldrich (St. Louis, Missouri) as >98% purity. All solvents were HPLC grade or higher. In situations where a second column was not used for the inverse gradient solvent stream, a precolumn filter was used to create back pressure.
Results
Gradient Compensation: Gradient compensation was evaluated using an approximately equal mass of three active pharmaceutical ingredients (APIs) differing in their hydrophobicity. This hydrophilic-to-partially hydrophobic mix of compounds was eluted first from a standard C18 column using gradient elution from low to high organic composition (Figure 2a). A four-point response curve (from ~250 to 2000 ng on-column) for each compound was constructed (Figure 2b). The effects of mobile phase composition on analyte response can be observed clearly.
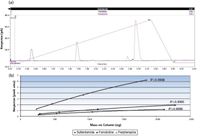
Figure 2: (a) Analysis of three pharmaceutical compounds by CAD. (b) Response curves for each compound from ~250 to 2000 ng on column fit with second-order polynomial.
This same group of samples then was analyzed as before, but this time the inverse solvent stream was applied after the analytical column. As shown in Figures 3a and 3b, the response for each analyte is equivalent with similar slopes and intercepts. The uniformity of response is of benefit to several areas of the pharmaceutical industry, including mass balance and drug stability testing, compound library maintenance, and cleaning validation studies.
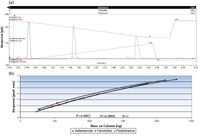
Figure 3: (a) Analysis of three pharmaceutical compounds by CAD with inverse gradient compensation. (b) Response curves for each compound from ~250 to 2000 ng on-column fit with second-order polynomial.
Mass Balance and Drug Stability Testing
Regulatory standards specify the use of mass balance calculations to assess the appropriateness of analytical methods as stability-indicating techniques to determine whether all degradants have been accounted for (5–8). Discrepancies in mass balance studies can result when HPLC–UV is used, as different analytes can have drastically different extinction coefficients. In some cases, an impurity may have no absorbance, and this mass would be missed entirely. Detectors that provide a nearly uniform response are extremely valuable (9). Consistent analyte response is critical for making compositional estimates on samples that contain unknown analytes.
In drug metabolite testing, these mass balance calculations can be crucial in determining if all major metabolites have been accounted for. The quantitation of analytes with CAD can be an important orthogonal technique to LC–MS in early stage drug development procedures that typically use human liver microsome (HLM) as an in-vivo model to mimic the drugs degradation in the body. As an example, results from the analysis of 100 µM erythromycin, a compound that lacks a chromophore, with the inverse gradient CAD system before and after incubation with the HLM is shown (Figure 4). The post- and pre-incubation results were compared to the matrix blank to determine the observed degradation products. The total peak area of all the degradation peaks and the parent in the post-incubation sample was divided by the peak area for parent pre-incubation. The resulting estimated mass balance was 96.6% recovery.
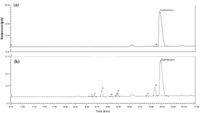
Figure 4: CAD analysis with inverse gradient compensation of (a) erythromycin with HLM treatment quenched at T = 0. (b) Erythromycin with HLM treatment quenched at T = 120 min.
Compound Library Maintenance
High-throughput screening of large compound libraries has been used by pharmaceutical companies for more than 20 years. Maintenance of these libraries (which may contain tens to hundreds of thousands of drug candidates) to ensure that identity and purity have not been compromised is time-consuming but necessary for the accuracy of screens. This process often uses advanced systems that combine multiple detection techniques on an ultrahigh-pressure liquid chromatography (UHPLC) platform to obtain as much information as possible from a single analysis. The area of relative quantification, however, is often tricky because of the diversity of the libraries and the inability to quickly make standards for each compound. Analysts are often left to rely on raw peak area from nonuniversal detection methods to estimate purity.
An analytical system was developed for high throughput with semiquantitation ability. One advantage of the dual-column system is increased throughput, as the two identical separation columns can be switched between two flow paths — an analysis flow path and a regeneration–gradient compensation flow path (10). While the sample is separated on one column, the other column is washed and equilibrated with the inverse gradient. A simple two-position, six-port switching valve is used to alternate the columns. A study using five test compounds evaluated the gradient effects on detector response with and without using an inverse gradient, as well as the reproducibility of results between the two analytical columns in this tandem method (Figure 5).
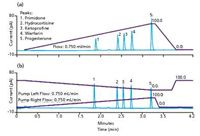
Figure 5: Analysis of five common pharmaceutical compounds by CAD (a) without and (b) with the inverse gradient.
The response for early eluted compounds (primidone, hydrocortisone, and ketoprofen) was enhanced because of increased nebulization efficiency resulting from the addition of organic solvent from the inverse gradient. The reproducibility of both retention and peak area was tested using eight repetitive injections on the two analytical columns (four injections on each). The RSDs for retention time ranged from 0.03 to 0.08%. For peak area, they ranged from 1.10 to 2.50%.
To further test this approach for use in compound library maintenance, a mixture of 44 APIs was analyzed using the inverse gradient approach with both UV and CAD. A four-level dilution series was prepared for one of the compounds, famotidine, covering the potential mass range for all analytes. A response curve for famotidine was constructed from the analyses and then used to back-calculate the recovery of all other compounds.
The recovery results for the 44 compounds (Figure 6a) showed a mean of 105%, with an RSD of 18%, for CAD. The high recovery was 155% and low recovery was 73%. The same experiment using UV detection at 254 nm (Figure 6b) was found to yield a mean of 112%, with an RSD of 119%. The high recovery was 461%. One compound was not detected. These semiquantitative results could be used easily to study drug stability or other trace impurities before moving into further testing.

Figure 6: Calculated recovery for 44 API samples using a single calibrant and (a)charged aerosol detection and (b) UV at 254 nm.
Cleaning Validation
The FDA guidance on cleaning validation indicates that operators must control the cleaning processes to determine the absence of previous product residues and any potential reaction byproducts and degradants of the initial process (11). The pharmaceutical industry typically uses an array of cleaning products (surfactants and other cleaning agents) to remove all contaminants from the equipment. Various test methods capable of measuring trace levels of residual components then are used to show suitability of the cleaning and testing processes. Testing often uses a total organic carbon (TOC) analyzer, and elevated TOC samples are evaluated using HPLC with low-wavelength UV detection. Unfortunately, these techniques suffer because of a lack of specificity (TOC) and sensitivity (HPLC–UV). Novel column technologies, combined with CAD, now enable the rapid and sensitive analysis of residual cleaning products, as well as actives.
Cleaning agents often contain an array of ionic and nonionic surfactants as well as acids, such as citric acid and inorganic ions. The HPLC–CAD analysis of a solution at 0.01% of the recommended concentration of Liqui-Nox cleaning solution resulted in 26 identifiable peaks; citric acid and ionic material were unretained and were eluted in the void volume (peak 1, Figure 7). By comparison, the UV at 210 nm (data not shown) had far fewer identifiable peaks (12).
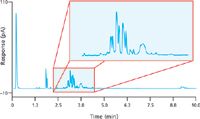
Figure 7: Separation of 0.01% Liqui-Nox cleaning solution showing resolution of at least 26 analytes.
The use of CAD–(U)HPLC with inverse gradient for cleaning validation provides semiquantification of nonvolatile components at trace levels without requiring compound specific standards. This presents the opportunity for manufacturers to implement significant cost savings over their current methods. The estimation of unknown compounds by using response curves obtained from known compounds illustrates the power of this technique. By using one generic response curve of a nonvolatile compound at known concentration, the relative concentration of the other material can be calculated.
Conclusions
Pharmaceutical scientists are faced with a number of challenges in areas such as mass balance studies, compound library maintenance, drug stability testing, and cleaning validation. This is especially difficult in areas where standards are not available. Some of these problems stem from the variation in response with common HPLC detectors such as UV. Universal type detectors with inverse gradient compensation can overcome this limitation.
By utilizing a dual-pump HPLC–UHPLC system to combine an inverse gradient with the gradient used for the separation, detector response variation can be minimized resulting in a system that can provide relative concentration even without standards.
Phillip DeLand is Pharmaceutical Market Development Manager with Dionex Corporation, Sunnyvale, California. John Waraska is Strategic Business Development Manager, Christopher Crafts is Product & Applications Support, and Ian Acworth is Director, Customer & Applications Support with ESA/Dionex, Chelmsford, Massachusetts. Frank Steiner is Small Molecule Solutions Manager and Tobias Fehrenbach is LC Liquid Handling Product Manager with Dionex Softron, Germering, Germany.
References
(1) T. Górecki, F. Lynen, R. Scucs, and P. Sandra, Anal. Chem. 78, 3186–3192 (2006).
(2) P.H. Gamache, R.S. McCarthy, S.M. Freeto, D.J. Asa, M.J. Woodcock, K. Laws, and R.O. Cole, LCGC North America 23(2) 151–161 (2005).
(3) B.T. Matthews et al., Chromatographia 60, 625–633 (2004).
(4) S. Lane et al., Anal. Chem. 77, 4354–4365 (2005).
(5) International Conference on Harmonization (ICH) and US Food and Drug Administration, Q1B: Photostability Testing of New Drug Substances and Products (Geneva, Switzerland, and Rockville, Maryland, Nov. 1996).
(6) ICH and FDA, Q1A(R2): Stability Testing of New Drug Substances and Products (Geneva, Switzerland, and Rockville, Maryland, Feb. 2003).
(7) ICH and FDA, Q2A: Validation of Analytical Procedures, Text for Validation of Analytical Procedure (Geneva, Switzerland, and Rockville, Maryland, Oct. 1994).
(8) ICH and FDA, Q2B: Validation of Analytical Procedures, Methodology (Geneva, Switzerland, and Rockville, Maryland, Nov. 1996).
(9) "Improving the Quantitation of Unknown Trace Impurity Analysis of Active Pharmaceutical Ingredients Using HPLC with Charged Aerosol Detection," K. Srinivasan, M. Plante, C. Crafts, I. Acworth, P. Gamache, and J. Waraska, October 2010, ESA – A Dionex Company Application Note, LPN 2604-01.
(10) "Novel Approaches to Compound Management," C. Crafts, B. Bailey, M. Plante, J. Waraska, and I. Acworth, November 2010, ESA – A Dionex Company Application Note, LPN 2674-01.
(11) FDA Guide to Inspections Validation of Cleaning Processes, Validation of Cleaning Processes, (7/93), http://www.fda.gov/ICECI/Inspections/InspectionGuides/ucm074922.html.
(12) "Single Calibrant Approach to Cleaning Validation Using a Dual Gradient Pump and Charged Aerosol Detection," C. Crafts, B. Bailey, M. Plante, I. Acworth, and C. Ontiveros, November 2010, ESA – A Dionex Company Application Note, LPN 2670-01.
Accelerating Monoclonal Antibody Quality Control: The Role of LC–MS in Upstream Bioprocessing
This study highlights the promising potential of LC–MS as a powerful tool for mAb quality control within the context of upstream processing.
Using GC-MS to Measure Improvement Efforts to TNT-Contaminated Soil
April 29th 2025Researchers developing a plant microbial consortium that can repair in-situ high concentration TNT (1434 mg/kg) contaminated soil, as well as overcome the limitations of previous studies that only focused on simulated pollution, used untargeted metabolone gas chromatography-mass spectrometry (GC-MS) to measure their success.
Prioritizing Non-Target Screening in LC–HRMS Environmental Sample Analysis
April 28th 2025When analyzing samples using liquid chromatography–high-resolution mass spectrometry, there are various ways the processes can be improved. Researchers created new methods for prioritizing these strategies.
Potential Obstacles in Chromatographic Analyses Distinguishing Marijuana from Hemp
April 28th 2025LCGC International's April series for National Cannabis Awareness Month concludes with a discussion with Walter B. Wilson from the National Institute of Standard and Technology’s (NIST’s) Chemical Sciences Division regarding recent research his team conducted investigating chromatographic interferences that can potentially inflate the levels of Δ9-THC in Cannabis sativa plant samples, and possible solutions to avoid this problem.

.png&w=3840&q=75)

.png&w=3840&q=75)


.png&w=3840&q=75)


.png&w=3840&q=75)


