Fast Analysis of Third-Generation Cephalosporins in Human Plasma by SPE and HPLC Methods
Special Issues
A fast, selective, and reproducible high performance liquid chromatography (HPLC) method was developed and validated for the analyses of third-generation cephalosporin antibiotics, namely, ceftriaxone, cefixime, and cefdinir in human plasma. The analysis was carried out on a 150 mm Ã- 4.6 mm, 5.0-µm C18 column. The mobile phase used was 80:20 (v/v) 50 mmM phosphate buffer (pH 5.0)–methanol at a flow rate of 1.0 mL/min with 230-nm UV detection.
A fast, selective, and reproducible high performance liquid chromatography (HPLC) method was developed and validated for the analyses of third-generation cephalosporin antibiotics, namely, ceftriaxone, cefixime, and cefdinir in human plasma. The analysis was carried out on a 150 mm × 4.6 mm, 5.0-µm C18 column. The mobile phase used was 80:20 (v/v) 50 mmM phosphate buffer (pH 5.0)–methanol at a flow rate of 1.0 mL/min with 230-nm UV detection. The separation factors of all studied compounds were in the range of 1.50–10.05 and the resolution factors ranged from 1.15 to 9.47. The percentage recoveries of these antibiotics in human plasma were 20.92, 25.84, and 37.88% for ceftriaxone, cefixime, and cefdinir, respectively. The three antibiotics were separated within 7.0 min. The reported method was also found to be efficient, effective, and inexpensive.
Third-generation cephalosporins are the antibiotics having a β-lactam ring, which inhibit the synthesis of peptidoglycan of bacteria by preferentially binding to the bacterial penicillin binding protein (1,2). Cephalosporin antibiotics are used for the treatment of various infections caused by both Gram-positive and -negative bacteria (3–6). The most commonly used third generation cephalosporins are ceftriaxone, cefixime, and cefdinir antibiotics (Figure 1) because of their broad ranges of applications (7–9). Moreover, these antibiotics are capable of penetrating into the cerebrospinal fluid (CSF) and are considered to be appropriate agents for the treatment of meningitis (10). Therefore, the analyses of these drugs in human plasma are of the utmost importance. Sample preparation is an integral part of any biological analysis before high performance liquid chromatography (HPLC). About 90% of chromatographers are using solid-phase extraction (SPE) as the versatile method for sample preparation in human plasma (11,12). Drug testing is an important aspect in pharmaceutical analysis and routine quality control monitoring of drug release characteristics. Therefore, pharmacokinetics and pharmacodynamics studies of these antibiotics are required. Some SPE–HPLC methods are available for the analysis of third-generation cephalosporins in human plasma (12–19). A few workers also have analyzed ceftriaxone and cefixime in human plasma by SPE–HPLC methods (12,13). These reported methods are not cost effective because of the use of costly mobile phases. Furthermore, the retention times of these antibiotics are moderate and have poor detection limits (12,13). On the contrary, there is no report available for the analysis of cefdinir in human plasma by SPE–HPLC. In view of these facts, attempts have been made to develop fast, effective, reproducible, and inexpensive SPE–HPLC methods that can be combination methods accepted widely for the analyses of ceftriaxone, cefixime, and cefdinir antibiotics. The results of these findings are given herein.

Figure 1: Chemical structure of ceftriaxone, cefixime, and cefdinir cephalosporins (R = H).
Experimental
Chemicals, Reagents, and Instruments: Fresh frozen human plasma was obtained from the Rotary Blood Bank (New Delhi, India). Methanol (HPLC grade), disodium hydrogen phosphate, and o-phosphoric acids were purchased from Merck (Gurgaon, India). Standard solutions (0.10–1.0 mg/mL) of the drugs were prepared in methanol. An HPLC system (Ecom, Plzeň, Czech Republic) consisting of a solvent delivery pump (model Alpha 10), a manual injector, an absorbance detector (Sapphire 600 UV–vis), a chromatography I/F module data integrator (Indtech Instruments, Mumbai, India), and Winchrome software was used with a 150 mm × 4.6 mm, 5.0-µm C18 IC column (Arctic Biotech, India), an SPE unit (Varian, Inc., Santa Clara, California), C18 cartridges (Waters, Milford, Massachusetts), a membrane filter (Millipore, Carrigtwohill, Ireland), a pH meter (model APX 175 E/C, Control Dynamics, Midlothian, Virginia), and a centrifuge (model C854/49/06, Remi, Mumbai, India). Purified water was prepared using a Millipore Milli-Q (Bedford, Massachusetts) water purification system.
Extraction of Drugs from Dosage Formulations: Ceftriaxone was extracted from commercially available injectable vial Monocef of Aristo Laboratories Ltd. (Daman, India). Cefixime was extracted from commercially available tablets Cefy-0-200 DT of Morpen Laboratories Ltd. (New Delhi, India). Cefdinir was extracted from commercially available capsules Kefdure of Admac Formulations (Barotiwala, India). Ceftriaxone in powder form of injection vial was used as such for the extraction of pure salt. The powder of ceftriaxone was extracted with methanol (100.0 mL) with heating at 50 °C. The supernatant was separated from the residue by filtering through a 0.22-µm membrane filter. The residue was extracted two more times with the same amount of methanol. The combined methanol extracts (300.0 mL) were evaporated under vacuum on a water bath to 15.0 mL and was allowed to crystallize at 10 °C. The mother liquor was decanted and the crystals were dried and washed with a small amount of ethyl ether. The extraction of the two drugs also was carried out in the same way. The purities of drugs were ascertained by recording their melting points, UV, and IR spectra.
HPLC Analyses: All HPLC experiments were carried out on the HPLC system described above for the qualitative and quantitative analysis of ceftriaxone, cefixime, and cefdinir antibiotics in human plasma. An aliquot of 5.0 µL containing all three antibiotics was injected into the HPLC instrument. The mobile phase used was 80:20 (v/v) 50.0 mM phosphate buffer (pH 5.0)–methanol with a flow rate of 1.0 mL/min. The mobile phases were prepared, filtered, and degassed daily before use. Detection was achieved at 230 nm. All the experiments were carried out five times at 27 ± 1 °C. The separated antibiotics were identified by running their individual standards under identical HPLC conditions and comparing their retention times. The chromatographic parameters, such as capacity (k), separation (α), and resolution (Rs) factors, were calculated by using standard chromatographic equations.
Sample Preparation by SPE: First, to exploit the experimental errors, blank experiments were carried out as per the standard method (20,21). For sample preparation, 1.0 mL (0.50 mg/mL) of ceftriaxone was mixed in 5.0 mL human plasma. The spiked sample was vortexed for 2.0 min, let stand for 30.0 min followed by the addition of 15.0 mL acetone. The precipitated proteins were separated by centrifugation at 3000 rpm for 10.0 min. The supernatant was evaporated to dryness and the residue was redissolved in 10.0 mL of 50 mM phosphate buffer (pH 1.50). A Sep-Pak Vac C18 cartridge (1.0 mL, Waters) was preconditioned with 2.0 mL methanol followed by 5.0 mL purified water. The phosphate buffer containing ceftriaxone was passed through the cartridge with 0.1 mL/min flow rate, followed by cartridge washing with 2.0 mL purified water at same flow rate. The cartridge was dried by hot air and the drug was eluted by 10.0 mL methanol at a 0.10 mL/min flow rate. The eluted methanol was concentrated under vacuum to a 0.10-mL volume. The extraction of cefixime and cefdinir was carried out in the same way. The final resulting solutions (0.10 mL of each antibiotic) of all the three antibiotics were used for HPLC studies.

Table I: Capacity (k), separation (α), and resolution (Rs) factors of ceftriaxone, cefixime, and cefdinir third-generation antibiotics
Result and Discussion
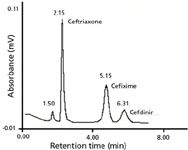
HPLC: The chromatographic parameters k, α, and Rs for the resolved third-generation cephalosporin used in this study are given in Table I. The values of α for ceftriaxone–cefixime, cefixime–cefdinir, and ceftriaxone–cefdinir combinations are 5.72, 1.34, and 7.65, while the values of Rs are 4.45, 1.34, and 5.77, respectively. The values of µ and Rs for all of the analytes are greater than one, which indicate the base line separation, as shown in Figure 2. The chromatograms of the individual third-generation cephalosporins also were recorded under identical chromatographic conditions and used for qualitative and quantitative analyses. The order of the elution of cephalosporins was found to be ceftriaxone, cefixime, cefdinir. This order of elution can be explained on a supramolecular level by considering the structures of the reported antibiotics. It is clear from Figure 1 that the main groups in these cephalosporins are carboxylic, hydroxyl, amine, and amide carbonyl along with a sulfur atom. Ceftriaxone is retained less than the other two antibiotics because of strong hydrophobic interactions. Besides, several electronegative atoms (oxygen, nitrogen, and sulphur) are in this molecule that forms hydrogen bonds with the mobile phase, leading to poor retention. Similarly, cefixime is retained less than cefdinir due to stronger hydrophobic interactions than ceftriaxone. Additionally, hydrogen bonding also plays a crucial role in separation in the case of ceftriaxone. Other forces, such as dipole-induced interactions and van der Waal forces, also contribute toward their separation.

Figure 2: Chromatogram of the standard solutions of all three cephalosporins. Experimental conditions are given in text.
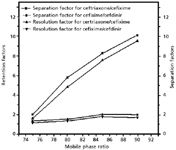
To optimize the chromatographic conditions, various combinations of phosphate buffer, methanol, water, acetonitrile, and ethanol were tested. Other buffers, such as acetate, ammonia, and Tris, also were tried to achieve the best separation. As a result of extensive experimentation, the optimized HPLC conditions were developed and reported herein. The effect of pH of mobile phase was studied in the range of 2.0–8.0, and the best results were achieved at pH 5.0. The variation of methanol in mobile phase was very interesting, and its effect on separation and resolution factors is shown in Figure 3. A careful perusal of this Figure indicates that the values of separation factor range from 1.00 to 10.05, whereas resolution factors varied from 1.15 to 9.47. The best mobile phase selected was 80:20 (v/v) 50.0 mM phosphate buffer (pH 5.0)–methanol as all the peaks were sharp, while peaks were broad in other combinations. Moreover, the detection limits were low at the reported mobile phase in comparison to other combinations. The detection limits for ceftriaxone, cefixime, and cefdinir are 0.1, 0.6, and 0.8 µg/mL, respectively.

Figure 3: Effect of methanol percentages on the separation and resolution factors of cephalosporins. Other experimental conditions are given in text.
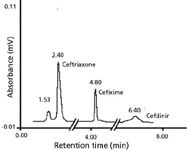
Analysis of Cephalosporins in Human Plasma: The analyses of third-generation cephalosporins were carried out by the optimized and reported HPLC method. All three cephalosporins (ceftriaxone, cefixime, and cefdinir) extracted from human plasma were identified by comparing their retention times with the standards, as shown in Figure 4. It is clear from Figure 4 that there is no extra peak indicating that the reported method is selective. The quantitative estimation of these antibiotics was carried out by comparing their peak areas with those of standards. The recovered concentrations of ceftriaxone, cefixime, and cefdinir from human plasma were 20.92, 25.84, and 37.88%, respectively. These concentrations were calculated by applying the correction factors because of the blank experiments. The SPE method was optimized by adjusting the pH and concentration of phosphate buffer, the flow rate of plasma sample and eluting solvents, and the types of eluting solvents. SPE experiments were carried out using a pH range of 1.0–4.0, and the maximum recoveries of these drugs were obtained at pH 1.5. Various flow rates (0.10–0.50 mL/min) of plasma samples were examined to optimize the SPE conditions; poor recoveries were obtained at high flow rates while recoveries were maximum at a low flow rate. Similarly, the flow rates of eluting solvents were varied from 0.10 to 0.50 mL/min and maximum percentage recoveries were obtained at 0.10 mL/min. The SPE methodology was optimized by using different solvents such as methanol, ethanol, ethyl acetate, and dichloromethane. In addition to the solvent optimization, efforts also were made to increase the recovery of antibiotics from the C18 cartridge by adding some amounts of acids to the above solvents. The acids used were trifluoroacetic acid and acetic acid at 0.1–1.0%. As a result of extensive experimentation, the best eluting solvent was found to be pure methanol for these drugs because the polarity of methanol is enough to elute these drugs from C18 cartridges under the reported SPE conditions.

Figure 4: Chromatograms of three cephalosporins in human plasma. Experimental conditions are given in text.
Validation of the Methods: The developed chromatographic and SPE methods were validated by carrying out five sets (n = 5) of chromatographic and SPE procedures under the identical experimental conditions. The regression analysis was carried out using Microsoft Excel software. The standard deviation (SD), correlation coefficients (R), and confidence limit (CL) for HPLC were in the range of ±0.040–0.041, 0.9997–0.9996, and 99.5–99.8, respectively, and the confidence levels varied from 99.4 to 99.5 for all three third-generation cephalosporins (antibiotics). Similarly, the values of standard deviation and correlation coefficients for SPE were ±0.070–0.071 and 0.9998–0.9996, respectively, for all three drugs. The values of confidence levels ranged from 99.4 to 99.9 for ceftriaxone, cefixime, and cefdinir, respectively. The correlation coefficients for calibration curves were higher than 0.997 as determined by least square analysis.
Conclusions
From the results presented herein, it may be concluded that the reported SPE–HPLC method is fast, selective, and efficient for the separation, identification, and quantitative analysis of cephalosporins in human plasma. The peaks are sharp with good separation and resolution factors. The separation of these antibiotics is controlled by hydrogen bondings.
Acknowledgment
The authors are grateful to University Grant Commission (UGC, New Delhi, India) for providing research fellowship to Iqbal Hussain.
Imran Ali, Kishwar Saleem, and Iqbal Hussain are with Jamia Millia Islamia (Central University), New Delhi, India, Zeid A. AL-Othman is with King Saud University, Riyadh, Kingdom of Saudi Arabia, and Hassan Y. Aboul-Enein is with the National Research Center, Cairo, Egypt. The author can be contacted via e-mail at drimran_ali@yahoo.com.
References
(1) J.T. Park and J.L. Strominger, Sci. 125, 99–101 (1957).
(2) J. Lederberg, Proc. Natl. Acad. Sci. USA 42, 5574–5577 (1956).
(3) P.M. Shah, Int. J. Antimicrob. Agents 19, 163–164 (2002).
(4) J.D. Williams, K.G. Naber, A. Bryskier, N. Hoiby, I.M. Gould, P. Periti, H. Giamarellou, and B. Rouveix, Agents 17, 443–450 (2001).
(5) P. Angehrn, P.J. Probst, R. Reiner, and R.L. Then, Agents and Chemo. 18, 913–921 (1980).
(6) T.R. Beam Jr., Pharmacotherapy 5, 237–253 (1985).
(7) J.H. Yuk and C.H. Nightingale, Clinical Pharmacokinetics 17, 223–235 (1989).
(8) http://www.greatvistachemicals.com/pharmaceuticals-bulkdrugs/cefixime.html.
(9) R.P. David, Clinical Therapeutics 24, 473–489 (2002).
(10) L. Balant, P. Dayer, and R. Auckenthaler, Clin. Pharmacokinet. 10, 101–143 (1985).
(11) I. Ali, V.K. Gupta, H.Y. Aboul-Enein, and A. Hussain, J. Sep. Sci. 31, 2040–2053 (2008).
(10) L. Balant, P. Dayer, and R. Auckenthaler, Clin. Pharmacokinet. 10, 101–143 (1985).
(11) I. Ali, V.K. Gupta, H.Y. Aboul-Enein, and A. Hussain, J. Sep. Sci. 31, 2040–2053 (2008).
(12) S. Bompadre, L. Ferrante, and L. Leone, J. Chromatogr. A 812, 191–196 (1998).
(13) E. Nemutlu, S. Kir, D. Katlan, and M. Sinan Beksac, Talanta 80, 117–126 (2009).
(14) R. Denooz and C. Charlier, J. Chromatogr. B Analyt. Technol. Biomed. Life Sci. 864, 161–167 (2008).
(15) R.V. Nirogi, V.N. Kandikere, W. Shrivastava, and K. Mudigonda, Arzneimittelforschung 56, 309–313 (2006).
(16) S.D. Hanes, V.L. Herring, and G.C. Wood, J. Chromatogr. B Biomed. Sci. Appl. 719, 245–250 (1998).
(17) H.J. Kraemer, R. Gehrke, A. Breithaupt, and H. Breithaupt, J. Chromatogr. B Biomed. Sci. Appl. 700, 147–153 (1997).
(18) F. Camus, A. Deslandes, L. Harcouet, and R. Farinotti, J. Chromatogr. B Biomed. Appl. 656, 383–388 (1994).
(19) R.C. Steenwyk, J.E. Brewer, M.E. Royer, and K.S. Cathcart, J. Liq. Chromatogr. 14, 3641–3656 (1991).
(20) G.D. Christain, Analytical Chemistry, 6th Ed. (John Wiley & Sons Inc., New York, 2003).
(21) H.Y. Aboul-Enein, I. Ali, and H. Hoenen, Biomed. Chromatogr. 20, 760–764 (2006).

Altering Capillary Gas Chromatography Systems Using Silicon Pneumatic Microvalves
May 5th 2025Many multi-column gas chromatography systems use two-position multi-port switching valves, which can suffer from delays in valve switching. Shimadzu researchers aimed to create a new sampling and switching module for these systems.
Studying Cyclodextrins with UHPLC-MS/MS
May 5th 2025Saba Aslani from the University of Texas at Arlington spoke to LCGC International about a collaborative project with Northwestern University, the University of Hong Kong, and BioTools, Inc., investigating mirror-image cyclodextrins using ultra-high performance liquid chromatography–tandem mass spectrometry (UHPLC–MS/MS) and vibrational circular dichroism (VCD).

.png&w=3840&q=75)

.png&w=3840&q=75)


.png&w=3840&q=75)


.png&w=3840&q=75)


