Lab-on-a-Chip GC for Environmental Research
LCGC Europe
The development of a microfabricated comprehensive GC that can be used as a portable measurement device.
Jaydene Halliday, 1 Alastair C. Lewis,2 Jacqueline F. Hamilton,1 Christopher Rhodes,1 Keith D. Bartle,3 Philip Homewood,4 Robin J.P. Grenfell,5 Brian Goody,5 Alice Harling,5 Paul Brewer,5 Gergely Vargha5 and Martin J.T. Milton,5
1 Department of Chemistry, University of York, York, UK,
2 National Centre for Atmospheric Science, University of York, UK,
3 Energy and Resources Research Institute, University of Leeds, Leeds, UK,
4 The Dolomite Centre, Unit 1, Anglian Business Park, Hertfordshire, UK,
5 National Physical Laboratory, Middlesex, UK.
Capillary gas chromatography is a powerful and versatile technique that has revolutionized organic chemical separations and analyses, and is now one of the most widely used methods in analytical chemistry. It is reasonably fast, reproducible and has a broad scope of application. In combination with a flame ionization detector (FID) or a mass spectrometer (MS), it forms one of the most powerful tools for environmental analysis and has been used in many studies to measure volatile organic compounds (VOCs).1–4
KEY POINTS
While modern GC systems are highly sophisticated analytical tools, they remain relatively bulky and power intensive and are generally not field portable. The heating of capillary GC columns has evolved little over the past few decades and is primarily based on the turbulent fan oven, which remains an excellent means to achieve even heating of the column. The nature of GC and the size of such ovens make it a difficult technique to use in remote or off-grid locations for environmental research. Therefore, there is great potential in this area for microfabricated GC systems that are compact, robust and with low-power demands. Devices where all subcomponents of the GC system (injector, column, detector) are formed in a single planar fabrication have particular attraction, including potentially improved robustness, lack of interconnections and a structural geometry that is much easier to heat using planar devices.

Figure 1: (a) The most simple Chip 1 comprising 7.5 m and 1.4 m columns with 320 µm internal diameters. (b) The improved Chip 2 comprising connected 7.5 m and 1.4 m columns with 250 µm internal diameters, as well as having an edge connector and etched preconcentrator and modulator channels.
The first miniaturized GC, created by Terry et al. at Stanford University in 1975, was fabricated on a silicon wafer using photolithography and chemical-etching techniques.5 The microGC included an injection valve and used an internally mounted thermal conductivity detector. The 1.5 m long, 40 µm deep, 200 µm wide column had a rectangular cross-section. Difficulty in evenly coating rectangular channels and in miniaturizing the other GC components meant that the resolving power of the column was poor compared with standard columns of the day.

Figure 2: (a) Shows a cross-section of the glass device taken using an Alicona G4 Infinite Focus microscope, (b) the same glass section using a Wild Heerbrugg M400 microscope. Measurements of three bores give internal column diameters of 242 µm, 250 µm and 248 µm with a manufacture target of 250 µm. (b) Shows how the use of an asymmetric pair of glass thicknesses places the GC channels within a few hundred microns of one surface of the device for direct heating.26
Since then, chip-based gas chromatography has received relatively limited attention compared with silicon-fabricated on-chip electrophoresis and liquid chromatography systems. However, various versions of miniaturized and microfabricated GCs have been reported. While many of these devices encompass all instrument components on a smaller scale, a number merely combine conventional drawn capillary narrow bore columns with miniaturized detection and data handling technologies.6,7 The µChemLab developed by Sandia National Laboratories is, however, an example of a hand-held miniaturized GC instrument for VOC measurement that incorporates a microfabricated etched column.8,9 It comprised a preconcentrator consisting of a thin silicon nitride membrane supporting a patterned metal film-heating element, a 1 m long 100 × 400 µm high-aspect ratio GC column on a silicon wafer and an array of surface acoustic wave sensors.
While silicon has been the favoured substrate to date for microfabricated GC columns,10–17 other materials have been used in their construction, including porous silicon,18 carbon nanotubes,19 parylene,20 metal21,23 and ceramic.22 In addition, a variety of fabrication techniques have been used including DRIE, DRIE polymer vapour deposition, stereolithography, silicon bulk micromachining and Lithographie, Galvanoformung, Abformung (LiGA).

Figure 3(a): Separation using the 7.5 m long, 320 µm internal diameter planar glass column with 2 µm OV-101 stationary phase, placed in a GC fan oven and with a FID detector. Blue trace is an injection of the BTEX standard mixture and red trace is a mixture of 2 ppm nonane, alpha-pinene and 3-carene with a 500 µL s ample loop.26
Of the miniaturized devices previously reported, a common feature has been square or rectangular-sided channels to form the columns. These designs often result in a "pooling" of stationary phase at the column corners and can produce an uneven coating of stationary phase film. As analytes spend a longer time in these areas of thicker coating, peak broadening and general degradation of the separation performance may result.24 A limited number of circular channelled microfabricated devices have been reported, notably by Potkay et al. who reported columns of 1 m length and 90 µm diameter with a semi-circular cross-section10 and Pai et al. reporting the use of circular cross-sectional silicon serpentine columns with a 250 µm internal diameter.25 Circular cross-sectional channels are able to perform better over a larger range of flow than other reported column shapes, resulting in increased system design flexibility.

Figure 3(b): Separation of gasoline vapour using 7.5 m GC column programmed from 3 to 100 °C at 10 °C/min heated using Peltier and resistive elements. Detection is by low-power photoionization detector.
The planar microfabricated GC system reported here uses acid-etched borosilicate glass as the working substrate. The use of larger glass wafer areas, which may be micromanufactured at reasonable costs when compared with silicon, results in capillary channels that are circular in cross-section with column dimensions analogous to those used in laboratory GCs.
Experimental
Glass fabrication: The glass devices reported here were fabricated by the Dolomite Centre, UK, a specialized manufacturer of micro-scaled glass components. The design used two glass (Schott B270, Mainz, Germany) wafers (0.5 mm and 2.5 mm thick) with etched channels bonded together to form a single "chip". The chemical etching involved the surface of each half of the glass chip being covered with a chrome and then a photoresist layer. The photoresist layer is exposed to UV light through a mask outlining the channels. This causes it to become soluble to the photoresist developer compared with the unexposed photoresist which remains insoluble. On removal of the exposed photoresist an engraved pattern of the channels remains which is then used to etch the chrome layer. Finally, the glass is wet-etched with hydrofluoric acid solution along these preformed channels. The HF etching process is controlled to ensure symmetrical, hemi-spherical channels. After the photoresist and chrome layers are fully removed the two halves are brought into contact with the channels aligned. The flatness of the glass surfaces results in strong bonding through van der Waals forces. No heating is required and chips fabricated using this process can withstand pressures up to 50 bar.
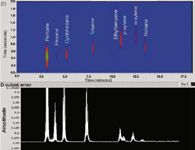
Figure 3(c): 2D separation using the 7.5 m and 1.4 m long, 250 µm internal diameter columns coated with OV-101 and OV-17 respectively. Individual peaks have been rescaled to give common peak maxima intensity.
Two different chip designs have been used in this work. Figure 1(a) shows Chip 1, while Figure 1(b) shows Chip 2 — an improved version of the first. Improvements seen on Chip 2 include the presence of an edge connector which provides an easy means of sample introduction and gas pressure modulation in a single connector unit, and connection of the channels between the primary and secondary columns, modulator and detector which allows comprehensive GC separation. Figures 2(a) and (b) show a cross-section of a portion of Chip 2. Both figures clearly show the uniformity of the column dimension, the accurate alignment of the two halves of glass and that the profile is very close to circular. Measurements of three bores at the chip edge gave internal column diameters of 242 µm, 250 µm and 248 µm, with the target internal diameter being 250 µm. Figure 2(b) shows how the use of an asymmetric pair of glass thicknesses places the GC channels within a few hundred microns of one surface of the device for direct heating.
Column Coating: There are two main methods of capillary GC column coating — static and dynamic. Static coating is widely used to deposit a highly uniform film of stationary phase onto column walls. This can be difficult to produce by the dynamic method which is based on pumping solution through the column. We used a static procedure here to deposit a film of non-polar DPMS stationary phase (OV–101, Restek, Bellefonte, Pennsylvania, USA) on the inside of the Chip 1 primary column. The column was filled with a solution containing the stationary phase prior to controlled evaporation of the solvent. A final weighing confirmed the mass of stationary phase deposited and calculation showed that the mass of 11 mg was equivalent to a uniform layer 2 µm thick.
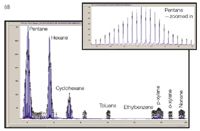
Figure 3(d): 2D separation using the chip heated by planar manifold with commercial Agilent FID. Only the raw detector signal is shown to illustrate the peak widths achievable using the on-chip modulator when an optimized commercial FID is used rather than the low-cost PID.
One-Dimensional Separation Performance in a Laboratory GC with FID: The coated chip was initially tested using the fan oven, temperature control, injection and flow control systems of a laboratory GC (Varian 3800, Santa Clara, USA) This enabled the separation capabilities of the coated glass column to be characterized with an established FID. Using high-purity helium (BIP Air Products, Allentown, Pennsylvania, USA) as carrier gas, a standard BTEX mixture containing 10 µmol/mol (molar ppm) of benzene, toluene, ethylbenzene, m-xylene, p-xylene and o-xylene was injected via a 500 µL gas sample loop. A second ppm gas mixture of nonane, α-pinene and 3-carene was injected separately. Automated valve changes, as part of the Varian 3800 GC system, were used. The oven was programmed to run at 30 °C for 0.2 min, then ramp at 20 °C/min to 100 °C. The switching valve was heated to 170 °C. The results are shown in Figure 3(a), which shows good separation between all of the injected components with symmetrical peak shape and elution in 4 minutes. Peak skew is less than 1.8 for all peaks (the majority less than 1.3). An isothermal chromatogram indicated around 2000 theoretical plates as measured for toluene.

Figure 4: (a) Profile view showing the layout of components in the temperature-controlled stack used for heating and cooling the glass GC. (b) Plan view layout of the temperature-controlled stacks. Stack 1 is under the primary 7.5 m long column. Stacks 2 and 3 are positioned under the secondary 1.4 m column and the injection region, respectively.26
Thermal Control in Constructed GC Manifold: Uniform heating of a GC column is central to its performance, requiring accurate and reproducible column temperatures and with minimal spatial temperature gradients. For the device reported here, combinations of direct heating approaches were investigated. These included the direct heating of the glass wafer with metal heating elements placed above and below the device and a more complex arrangement involving a stack of thin film-resistive elements and Peltier devices shown in Figure 4(a) in profile view.
Since glass is a relatively poor heat conductor, the separation of the zones of the device allows the differential heating of the injector from the columns and other regions. This was tested using three different control thermal stacks and temperature zones shown in Figure 4(b). The heater consisted of a polyimide-encapsulated heater and Peltier devices bonded directly to a finned aluminium heatsink using thermally conductive epoxy adhesive. The heatsink was equipped with a centrifugal blower for rapid cooling of the metal fins. Temperature monitoring of the stack was achieved using a PT100 polyimide-encapsulated sensor (Jumo GmbH, Fulda, Germany) placed between the heater and the glass chip. A configurable CompactRIO module supplied by National Instruments (Austin, Texas, USA) running Labview Realtime operating system was used to control the temperature of the stack. The temperature profile across the chip was determined using a matrix of 16 thick film platinum resistance temperature sensors (Labfacility DM503, Bognor Regis, UK), which were attached across the chip surface in an X pattern using thermally conductive epoxy adhesive. The temperature data collected was displayed in the form of a colour map overlaid on a two dimensional image of the glass chip using Labview software from National Instruments. Figure 5(a) shows the temperature profile across the surface of the chip when stack 1 (7.5 m column) is heated to 100 °C and all other stacks are left at ambient, while Figure 5(b) shows the measured temperature profile when stack 1 is cooled to 10 °C, with stack 2 (1.4 m column) held at 100 °C and unheated stack 3 (preconcentrator) remaining at ambient temperature. The 2D images reveal that the divided thermal stack arrangement is capable of independently controlling the temperature of at least three discrete regions of the glass GC device. The column temperature range is between 0–200 °C, with linear ramp rates of between 5 and 20 °C/min. Typical power consumption was 25 W mean or 30 kJ per analysis, two orders of magnitude less than conventional turbulent fan ovens.
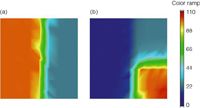
Figure 5: (a) Measured temperature profile with stack 1 heated to 100 °C, all other stacks left at ambient. (b) Measured temperature profile when stack 1 was cooled to 10 °C whilst holding the temperature of stack 2 at 100 °C. The temperature remained uniform (±2 °C) over stack 1 and the unheated stack 3 remained at ambient temperature.26
One-Dimensional Separation Performance with Direct Resistive Heating and PID: Following characterization of performance in the standard lab GC, the glass column was tested with direct heating using manual loop injections. A low-cost and low-power miniaturized photoionization detector (PID) (Alphasense, Great Notley, UK) operating with a lamp having an ionization potential of 10.6 eV was attached to the column outlet. The PID has a linear dynamic range of 5 ppb to 50 ppm (isobutylene). A two-stage regulator was used to provide a constant head pressure of helium carrier and was connected to a 6-port valve (VICI, Houston, Texas, USA) and operated manually. A 250 µL sample loop made from treated stainless steel was fitted to the valve in a configuration to allow sample filling in one position and sample injection in the other. The 6-port valve was connected to the inlet of the chip by a 10 cm long 1/16" Silcosteel tube and a 20 cm long 0.32 mm inner diameter fused-silica capillary connected by a reducing union (Thames Restek, Saunderton, UK). The effluent from the 7.5 m long column was connected to the PID by 0.32 mm inner diameter uncoated fused-silica capillary. The detector was integrated into the unit and to a data acquisition system. The carrier gas head pressure was set to 12 psi. Gasoline vapour was injected onto the column at a starting temperature of 3 °C. A temperature ramp of 10 °C/min up to 100 °C was applied. As seen in Figure 3(b), reasonable chromatographic separation of the highly volatile C5 – C8 fraction of the complex hydrocarbon sample was achieved in less than 3 mins.
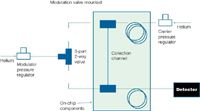
Figure 6: Schematic of the in-line fluidic differential flow modulator.
Two-Dimensional Separation Performance in GC Manifold with PID: Chip 2 was used to investigate comprehensive separations, with the primary column coupled to the secondary column via an on-chip fluidic differential flow modulator. The modulation setup can be seen in Figure 6. Primary column coating was conducted as previously described. The modulation valve was tested with gas phase samples and narrow peaks were obtained by fine tuning the carrier and modulator gas pressures. The secondary 1.4 m column was coated with a film of 50%-phenylmethylpolysiloxane stationary phase (OV17, Sigma Aldrich, St Louis, Missouri, USA). A dynamic technique was used for these preliminary results for ease and speed of coating. The coated chip was then tested using the PID and chip heating manifold. The overall system has a total peak power consumption of ~80 W (mean ~30 W) and is approximately briefcase sized with the outer frame dimensions being 33 cm (w) × 41 cm (l) × 14 cm (h).
A 6-port automatic injection valve was used fitted with a 250 µL sample loop made from treated stainless steel. The valve was connected to the chip's edge connector by a short length of peek tubing. The effluent emerging from the 1.4 m secondary column was connected to the PID by a 0.25 mm inner diameter uncoated fused-silica capillary. The carrier and modulator gas pressures were set to 15 psi and 14.5 psi respectively. The modulation period was set to 2 s, with filling set to 1.5 and flushing set to 0.5 s. A gas mixture comprising pentane, hexane, cyclohexane, toluene, ethylbenzene, p-xylene, o-xylene and nonane was injected onto the column at a starting temperature of 30 °C. A temperature ramp of 20 °C/min up to 100 °C was applied. Figure 3(c) shows an early experiment using 2D separation on the glass chip. While first dimension separation is successful, second dimension separation is not ideal. The response of the low cost PID was not sufficiently fast to allow modulated peaks to fully return to baseline. We tested the true separation performance of the device by replacing the PID with a fast commercial FID from an Agilent GC system (Agilent 7890A, Santa Clara, California, USA) by means of a ~50 cm long transfer line. The resulting raw FID data, shown in Figure 3(d), shows much improved comprehensive GC peak shape and that the chip-based columns and modulator are roughly equivalent in performance to other systems reported in the literature. A key element of our future research is therefore to connect a compact, low power, but fast-responding PID to our chip-based GC system. Development in fabrication capabilities now allows for channels of differing widths to be etched on the same glass wafer. We are currently working on redesign of the column geometries to allow for a longer second column than used here in combination with a narrower bore primary column.
Conclusions
A planar 2-dimensional GC chip with fully circular channel profiles has been microfabricated from glass using acidetching techniques. Relatively long column lengths and standard internal diameters have been achieved. Lowpower direct resistive heating and cooling of the glass chip produced a uniform heating profile across the columns when held both above and below ambient temperatures and multiple temperature zones have been achieved within the same chip. The one-dimensional performance of the device was proven using a standard GC oven for injection, heating and FID detection. Coupling of the directly heated column to a low cost, low-power PID showed reasonable separation of gasoline vapour. Comprehensive separation has shown some promising preliminary results from the separation of ppm gas mixtures of a set of VOCs when coupled with commercial GC detectors.
The approach described here offers substantial potential as the basis for a field-portable GC and is a useful alternative to typically square-channelled silicon devices of restricted physical size and higher material cost. The ability to directly cool this device using the Peltier effect may offer substantial advantages for the analysis of very volatile species over typical cryogenic cooling of drawn capillaries in standard GC ovens.
Jaydene Halliday graduated from Limerick Institute of Technology with a degree in Pharmaceutical and Forensic Analysis and is currently a PhD student in the Department of Chemistry at the University of York.
Alastair Lewis is professor of atmospheric science at the University of York, a research director of the National Centre for Atmospheric Science and technology advisor to the Natural Environment Research Council. He completed his BSc and PhD at the University of Leeds and was a lecturer there between 1999 and 2003.
Jacqui Hamilton has a BSc from the University of Strathclyde, and a PhD in chemistry from University of Leeds. She received the Desty Memorial Prize for separation science in 2009 and is currently a lecturer in chemistry at the University of York.
Chris Rhodes obtained a BSc and PhD from University of York. He has worked as an mass spectrometry instrumentation specialist at the Central Science Laboratory and also for manufacturers VG and Thermo, before returning as a research fellow at the University of York in 2008.
Keith Bartle has been a researcher of chromatographic techniques for more than 40 years and has published in excess of 400 articles on these and related topics. He is currently an Emeritus professor at the University of Leeds.
Philip Homewood is the head of engineering at The Dolomite Centre, a specialist manufacturer of microfluidic devices.
Robin Grenfell obtained a combined degree in physics and chemistry at the University of Edinburgh. He worked in the Gas Metrology group at NPL for 4 years, and has recently completed a Masters in Science Policy at the University of Edinburgh.
Brian Goody obtained a BSc at Regent Street Polytechnic in 1967. He designed control and protection instrumentation for submarine nuclear reactors for over 25 years before joining NPL where he creates specialized laboratory facilities, including patented gas dilutors.
Alice Harling obtained a MChem and PhD from the University of Manchester. After working as a postdoctorate fellow there for 2 years she moved to NPL in 2008, where she has been leading their work on VOCs in the Gas Metrology group.
Paul Brewer has a MChem from the University of Southampton and a PhD in chemistry from Imperial College London. He is currently a Senior Research Scientist in the Analytical Science Division at the National Physical Laboratory.
Gergely Vargha has more than 30 years experience in gas chromatography and gas analysis. He has worked at NPL for 8 years, prior to that he worked at the National Office of Measures in Hungary.
Martin Milton is a Fellow of the National Physical Laboratory. He has a degree in physics from Oxford University and a PhD in laser physics from Southampton University. His research concerns the development of accurate standards and measurement methods for gases and their standardization internationally.
References
1. D. Helmig et al., J. Geophys. Res.: Atmos., 101(D9), 14697–14710 (1996).
2. B. Rappengluck and P. Fabian, Environ. Sci. Pollut. Res., 5(2), 65–70 (1998).
3. A.C. Lewis et al., Nature, 405(6788), 778–781 (2000).
4. M. Ulman et al., Chem. Anal., 52(3), 435–451 (2007).
5. S.C. Terry, J.H. Jerman and J.B. Angell, IEEE Trans. Electron Devices, 26(12), 1880–1886 (1979).
6. Inficon, 3000 Micro GC Gas Analyser, 2010. Available: http://www.inficonpetrochemical.com/en/3000microgcgasanalyzer/index.html, last accessed 20 May 2010.
7. C2V, C2V-200 micro GC, 2009. Available: www.c2v.nl/products/ instrumentation/C2V_200_micro_gc.shtml, last accessed 20 May 2010.
8. MicroChemLab, 2009. Available: http://www.sandia.gov/mstc/MsensorSensorMsystems/MicroChemLab.html, last accessed 20 May 2010.
9. D. Lindner, Lab Chip, 1(1), 15N–19N (2001).
10. J.A. Potkay et al., J. Microelectromech. Syst., 16(5), 1071–1079 (2007).
11. S. Reidy et al., Anal. Chem., 79(7), 2911–2917 (2007).
12. R.R. Reston and E.S. Kolesar, J. Microelectromech. Syst., 3(4), 134–146 (1994).
13. G.R. Lambertus et al., Anal. Chem., 77(23), 7563–7571 (2005).
14. J.B. Sanchez et al., Sens. Actuator B: Chem., 119(1), 227–233 (2006).
15. L. Lorenzelli et al., 8th World Congress on Biosensors, Elsevier Advanced Technology, Granada, Spain, 2004, p.1968.
16. M. Nishino et al., IEEJ Trans. Electr. Electron. Eng., 4(3), 358–364 (2009).
17. A.D. Radadia et al., Anal. Chem., 81(9), 3471–3477 (2009).
18. S.E. Lewis et al., Sens. Actuator B: Chem., 110(1), 54–65 (2005).
19. M. Stadermann et al., Anal. Chem., 78(16), 5639–5644 (2006).
20. H.S. Noh, P.J. Hesketh and G.C. Frye-Mason, J. Microelectromech. Syst., 11(6), 718–725 (2002).
21. A. Bhushan et al., J. Microelectromech. Syst., 16(2), 383–393 (2007).
22. B. Dziurdzia, Z. Magonski and S. Nowak, Meas. Sci. Technol., 19(5), 6 (2008).
23. A. Bhushan, D. Yemane, D. Trudell, E.B. Overton, J. Goettert, 6th Biennial International Workshop on High Aspect Ratio Micro Structure Technology, Springer, Gyenogju, South Korea, 2005, p.361.
24. S.R. Sumpter and M.L. Lee, J. Microcolumn Sep., 3(2), 91–113 (1991).
25. R.S. Pai et al., IEEE Conference on Technologies for Homeland Security, IEEE, Waltham, MA, 2008, p.150.
26. Reprinted from Journal of Chromatography A, Volume 1217, Issue 5, A.C. Lewis, J.F. Hamilton, C.N. Rhodes, J. Halliday, K.D. Bartle, P. Homewood, R.J.P. Grenfell, B. Goody, A.M. Harling, P. Brewer, G. Vargha, M.J.T. Milton, Microfabricated planar glass gas chromatography with photoionization detection, Pages 768-774 (2010), with permission from Elsevier.
New Study Reviews Chromatography Methods for Flavonoid Analysis
April 21st 2025Flavonoids are widely used metabolites that carry out various functions in different industries, such as food and cosmetics. Detecting, separating, and quantifying them in fruit species can be a complicated process.
University of Rouen-Normandy Scientists Explore Eco-Friendly Sampling Approach for GC-HRMS
April 17th 2025Root exudates—substances secreted by living plant roots—are challenging to sample, as they are typically extracted using artificial devices and can vary widely in both quantity and composition across plant species.

.png&w=3840&q=75)

.png&w=3840&q=75)


.png&w=3840&q=75)


.png&w=3840&q=75)


