Analysing Metal Ions by CE
LCGC Europe
The benefits of using capillary electrophoresis to detect metal ions.
Capillary Electrophoresis (CE) has been widely applied to the determination of metal ions for a range of applications. Metal ions are charged polar species so are ideal candidates for analysis by CE. This article will explain how separation and detection is achieved and will describe several illustrative examples.
How are the metal ions detected?
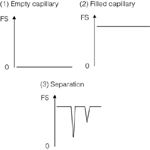
Metal ions such as Na+ and K+ have no chromophores, so cannot be detected using UV detection. Detection of non-chromophoric metal ions (and those with limited chromophores) is therefore achieved by indirect UV detection. In this process a UV-absorbing species is added to the electrolyte which gives a high background signal to almost full-scale (FS) deflection. When the peak moves along the capillary it displaces the UV-absorbing species which leads to a decreased concentration and a dip in UV signal (Figure 1).

Figure 1: Principles of indirect UV detection.
Optimization of the electrolyte is very important when using indirect detection. It is important to approximately match the mobility of the UV-absorbing species to that of the analyte(s). If the absorbing ion moves much faster or slower than the metal ions then the metal ion peaks become very broad due to a process called "electro-dispersion". This broadening results in loss of resolution and sensitivity. Imidazole is a typical UV-absorbing species used in analysis of metal ions.1 Imidazole has a good UV response at 214 nm and moves at a similar speed along the capillary to metal ions such as Na+,K+, Ca2+, Mg2+ and Li+. 4-amino pyridine is also widely used. Typically the absorbing ion is added at relatively low concentrations such as 5 mM to obtain maximum sensitivity. If the concentration is too high then the response to the presence of metal ions will be low, resulting in poor sensitivity. If the concentration is too low then a noisy baseline will occur.
This is a linear response to signal decrease and analyte concentration, so quantification is possible. Usually the peaks are inverted so that they appear positive as integration of negative peaks is often difficult on data acquisition software. This inversion can usually be selected in the CE system software. If this is not possible then the reference wavelength is set, for example at 214 nm (the UV absorbance maxima for imidazole), and the detection wavelength is set at a higher wavelength, such as 480 nm — the decrease in the reference signal therefore generates a positive peak.
Direct UV detection of some metal ions is possible — especially transition metal ions. For example, 14 metals ions were detected using a low UV wavelength.2
What are the separation mechanisms used?
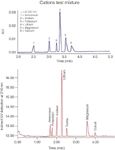
Separation of metal ions (Figure 2) is achieved based on their electrophoretic mobilities, such as their molecular weights and number of positive charges. However, there may be co-migration, for example, NH4+ and K+ have identical mobilities and cannot be resolved. Therefore complexing agents are often added into the buffer to alter selectivity. Typically low concentrations (5–10 mM) of small organic acids such as α-hydroxy-isobutric acid (HIBA) are added3 which selectively complex with the metal ions. The complexation can be affected by pH as this controls the charge on the acid — therefore pH can also be used to manipulate selectivity. The specific resolution issue of NH4+ from K+ is resolved by the addition of a crown ether, for example, 18-crown-16 crown ether,4 into the electrolyte. The crown ether has a cavity which chelates specifically with the NH4+ allowing resolution from K+ ions.

Figure 2: Separation of a range of metal ions by CE.
The methods are optimized to ensure that the operating currents are typically in the order of 5–20 μA. Higher currents lead to increased temperatures inside the capillary, resulting in noisy baselines and poor sensitivity. The noise is due to temperature related refractive index changes which are magnified using indirect UV detection.
Chemistry solutions, such as dynamic coating of the capillaries with a surfactant double layer,4 have been used to improve the long-term and short-term performance of methods. The coating stabilizes the electroendosmotic flow in the capillary providing improved migration time precision.
Chemistry kits are available from a number of vendors which are optimized for the analysis of metal ions by CE. The reagents supplied include capillary rinsing solutions and an optimized electrolyte solution. Operating conditions are recommended for parameters such as temperature, detection wavelengths and applied voltage. The kits also contain the capillary that has a length and diameter that gives optimized performance using the recommended operating parameters. The kits may also contain test mixes of standard metal ions or even the reagents required to achieve the double layer coatings.
It is possible to determine metal ions under non-aqueous CE conditions. Under these conditions5 the solvation effects are different compared with aqueous systems. Therefore the electrophoretic mobilities of the metal ions is different and NH4+ from K+ are resolved without the addition of crown ether. The electrolyte used was 5 mM imidazole dissolved in 99% MeOH with 1% glacial acetic acid. This generates a low current and allowed good sensitivity using indirect detection at 214 nm.
Is it possible to determine metal ions by direct UV through complexation?
Polycarboxylic acids such as EDTA can be included in the electroyte to form metal complexes in the capillary that then migrate and have sufficient conjugation to allow detection. Polycarboxylic acids themselves can be determined through complexation with copper ions which are added to the sample solutions. Levels of these complexation agents were determined with good accuracy and precision in dishwashing solutions and water samples.6
Why use CE for metal ion analysis?
Ion exchange chromatography (IEC) is widely used to determine metal ions. IEC columns are expensive and may have a short column life. IEC eluent purchase and disposal costs can be high. Specific IEC equipment is also required. In comparison, CE uses inexpensive fused silica capillaries and low volumes of reagents. Metal ion analysis is conducted on standard CE equipment, so no additional expense or training is required if the CE kit is already available. The set-up time for CE analysis is also very rapid — especially if kits are used — because there is no need to prepare any reagents. Compared with techniques such as gravimetric analysis and titration, CE offers advantages of improved selectivity and a highly automated system that allows unattended operation and automated results calculations. CE is also able to tolerate injection of quite complex samples as the capillary can be aggressively cleaned between injections.
What applications are there for CE analysis of metal ions?
CE has been used for a number of applications covering several industries and acceptable method validation has been reported with methods being routinely used.
Pharmaceutical analysis: CE has been widely used in the pharmaceutical analysis for metal ion determinations and the applications described would be appropriate in other industries such as agrochemical. Acidic drugs are often prepared as metal ions to alter their physiochemical properties such as solubility. The metal counter-ion may typically constitute 5–30% of the weight of the output drug substance batch. Therefore it is essential that accurate and precise analytical methods are used to quantify metal ion content.
Table 1 shows the data obtained by CE for the analysis of the calcium counter-ion content of the an acidic drug.7 The CE data agrees with the expected theoretical content and the values obtained by a manual titration method.

Table 1: Comparison of CE and titration results for the calcium content in calcium acamprosate drug substance.
Methods have been validated and are in routine analysis in QA laboratories.8 Table 2 shows the precision data obtained for ten replicate samples of a single batch of drug substance used in the method transfer exercise from R&D to the factory site.

Table 2: Precision data for the determination of the potassium content level in an acidic drug salt.
Metal ions may be also be present as an impurity in a drug substance arising from the use of sodium salt reagents during synthesis. Workers from Lilly validated and applied a CE method to determine residual metal ions in a drug substance and obtained good agreement with an IEC method.4 Ammonium was used as an internal standard with 4-amino pyridine as the visualizing agent and 18-crown ether included to separate sodium and ammonium ions.
Raw materials testing: Input raw materials require both assay and identity confirmation methods to confirm that they are the right materials before use in a number of industries including pharmaceuticals and agrochemicals. CE is able to provide this in a single method. Table 3 shows the CE results obtained following analysis of a range of raw materials.9 The results clearly shows that CE is able to confirm, for example, which is the mono- or di-sodium phosphate salt — and that is the sodium salt not potassium (K).

Table 3: Quantitative analysis results from testing of raw materials.
Food analysis: CE has been applied to analysing metal ions in a range of food products including mineral water, wine and yoghurt. CE has been used to profile the metal ion content of honey samples.10 Samples were simply diluted and injected. The metal ion profile was successfully used to confirm origin and authenticity of the honey. K, Ba, Ca, Na, Mg, Mn and Li were determined in a 4 min run time.
A CE method was optimized for the analysis of cations in beverages including orange juice and tea extracts.11 Fourteen metal ions were separated in 5 min with direct UV detection at 214 nm. Results obtained by the CE method correlated very well with the ICP–AES method.
Forensic analysis: CE has been used in forensic studies.12 Metal ions have been determined in a range of materials including water, sweat and saliva. Profiles of metal ion and small cations in bomb residues can provide valuable information concerning the explosives used and CE has found use in this arena, including use in a hand-held portable testing device.
Gunshot residues contain a large number of metal ions and small cations. These residues can be determined on hands after firing a gun. A CE method, using direct UV detection at 214 nm was shown to be capable of separating 20 analytes of interest including a range of transition metals (including Al, Ni, Zn and Pb).13 The method was able to quantify and profile residues on hands after firing guns and offered a simpler and more selective method than other approaches.
Hirowaka et al. applied CE to the profiling of metal ions, some simple amines (e.g., diethanolamine) and four amino acids in sweat samples.14 An optimized method allowed repeatable separations to be obtained, with good selectivity and analysis times of 10 mins. Sweat samples could be directly injected and results obtained correlated well with other testing methods. The limits of detection fitted well to clinical concentrations.
Conclusions
The simple and robust nature of the methods used for metal ion determination by CE has ensured that this has become a popular application. Standard separation conditions have been developed that give optimized performance. These standard conditions have allowed kits to be developed which greatly simplifies routine operation. Methods have been routinely used in a number of application areas including pharmaceutical and food analysis and forensic determinations.
Kevin Altria is an associate director in the pharmaceutical department at GlaxoSmithKilne. He is editor of CE Currents in LCGC Europe. Send direct correspondence about this column to LCGC Europe editor, Alasdair Matheson at amatheson@advanstar.com
References
1. R. Sekar and S. Azhaguvel, Chromatographia, 67, 157–161 (2008).
2. Y.S. Fung and K.M. Lau, J. Chromatogr. A, 1118, 144–150, (2006).
3. C. Quang and M.G. Khaledi, J. Chromatogr. A, 659, 459-466 (1994).
4. W. Brione et al., J. Pharm Biomed. Analysis, 44, 615–622 (2007).
5. K.D. Altria, M. Wallberg and D. Westerlund, J. Chromatogr. B, 714, 99–104 (1998)
6. P.L Laamanen, A. Mali and R. Matilainen, Anal. Bioanal. Chem., 381, 264–1271 (2005).
7. H. Fabre et al., J. Chromatogr. A, 772, 265–269 (1997)
8. K.D. Altria, D.M. Goodall and M.M. Rogan, Chromatographia, 38, 637–642 (1994).
9. K.D. Altria et al., Chromatographia, 42, 332–342 (1996).
10. S. Suarez-Luque et al., J. Chromatogr. A, 1083, 193–198 (2005).
11. Y.S. Fung and K.M. Lau, J. Chromatogr. A, 1118, 144–150 (2006).
12. F. Tagliaro et al., Electrophoresis, 31, 1–9, (2010).
13. E.B. Morales and A. Vazquez, J. Chromatogr. A, 1061, 225–233 (2004).
14. T. Hirokawa et al., Analytica Chimica Acta, 581, 83–88 (2007).
New TRC Facility Accelerates Innovation and Delivery
April 25th 2025We’ve expanded our capabilities with a state-of-the-art, 200,000 sq ft TRC facility in Toronto, completed in 2024 and staffed by over 100 PhD- and MSc-level scientists. This investment enables the development of more innovative compounds, a broader catalogue and custom offering, and streamlined operations for faster delivery. • Our extensive range of over 100,000 high-quality research chemicals—including APIs, metabolites, and impurities in both native and stable isotope-labelled forms—provides essential tools for uncovering molecular disease mechanisms and exploring new opportunities for therapeutic intervention.
New Guide: Characterising Impurity Standards – What Defines “Good Enough?”
April 25th 2025Impurity reference standards (IRSs) are essential for accurately identifying and quantifying impurities in pharmaceutical development and manufacturing. Yet, with limited regulatory guidance on how much characterisation is truly required for different applications, selecting the right standard can be challenging. To help, LGC has developed a new interactive multimedia guide, packed with expert insights to support your decision-making and give you greater confidence when choosing the right IRS for your specific needs.

.png&w=3840&q=75)

.png&w=3840&q=75)


.png&w=3840&q=75)


.png&w=3840&q=75)


