Isolation and Purification of Ranitidine using XSelect Columns and Focused Gradients
LCGC Asia Pacific
Waters Application Note
Introduction
Isolation and purification of compounds and their impurities/degradants is an important part of the drug discovery and development process. It is critical that a sufficient mass of each compound be isolated and purified for subsequent analysis and testing in the least amount of time to ensure timely identification and characterization. However, developing a chromatographic separation at the preparative scale can be time-consuming and costly due to solvent use and disposal, run time and potential loss of crude material during the gradient optimization process. As an alternative, analytical columns (4.6 mm inner diameter) can be used to quickly develop analytical separations using mobile phases that are compatible with preparative chromatography. A focused gradient developed at the analytical scale can be easily transferred to the preparative scale using the same stationary phase chemistry. Focused gradients improve the resolution between closely eluting peaks without increasing the run time, leading to higher purity and increased yield of the target product. In this application, ranitidine, the active ingredient in Zantac, is isolated and purified at the preparative scale based on the analytical separation results. The collected fractions are then analysed with the focused gradient method to rapidly confirm purity. Selectivity of the separation at both the analytical and preparative scales is maintained by using the same chemistry packed into two different column dimensions. The XSelect columns used in this application are stable at both high and low pH, which allows them to be used with a wide range of separation conditions and mobile phases compatible with preparative chromatography.
Experimental
System: AutoPurification system with 2996 PDA and AutoPurification flow cell
Analytical column: XSelect CSH C18, 5 μm, 4.6 × 100 mm
Prep column: XSelect CSH Prep C18 OBD, 5 μm, 19 × 100 mm
Mobile phase A: 0.1% NH4OH in H2O
Mobile phase B: 0.1% NH4OH in CH3OH
Temperature: 30 °C
Detection: UV 240 nm
Sample concentration: 72.7 mg/mL
Sample diluent: DMSO
Injection volume: 1 μL for crude and 20 μL for purified fractions (analytical); 119 μL (prep)
Results and Discussion
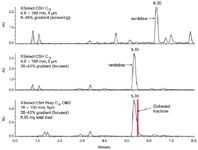
A generic screening gradient was used to analyse ranitidine, the active ingredient in Zantac, which reduces the acid levels in the stomach and is used to treat ulcers and gastroesophageal reflux disease (GERD). The resulting separation is shown in Figure 1 (top). Since ranitidine is a base with one of its pKa values at 8.2, it has better retention under high pH mobile phase conditions. Ammonium hydroxide was chosen as the mobile phase modifier because it can be removed more easily from purified fractions at the preparative scale when compared to bicarbonate or acetate buffers.

Figure 1: Analysis of ranitidine using an analytical screening gradient (top), an analytical focused gradient (middle) and a preparative focused gradient (bottom). The screening gradient was from 5 to 95% B in 12 min. The focused gradient had an initial hold at 5% B for 1 min, to 35.1% B in 0.5 min, then to 43.1% B in 5.36 min, followed by a rinse at 95% B for 1 min. Analytical flow rate was 1.46 mL/min. Preparative flow rate was 25 mL/min.
Based on the chromatography from the screening gradient, a focused gradient was developed on the analytical column to ensure all impurities were more sufficiently resolved from ranitidine.1 In order to develop a focused gradient, several parameters must be calculated. The calculations shown below describe the step-by-step process needed to formulate a focused gradient from the results obtained in the screening gradient:
Corrected retention time (RT) of ranitidine = Retention time – time to detector* – gradient hold
= 6.30 min – [(0.93 mL + 1.395 mL)/1.46 mL/min] – 0 min
= 4.71 min
*time to detector in min = (system volume in mL + column volume in mL) /flow rate in mL/min
Elution % of ranitidine = (Corrected RT/gradient time) × (% change over the gradient) + initial gradient%
= (4.71 min/12 min)(95% – 5%) + 5%
= 40.1% (% MeOH for ranitidine elution)
Gradient slope expressed as % change per column volume = % change/[(flow rate in mL × gradient time in min)/column volume in mL]
= 7.17% per column volume
Slope for focused gradient expressed as % change per column volume = scouting gradient slope/5
= 7.17%/5
= 1.43% per column volume
The focused gradient should start at 5% lower organic than the elution % and end 3% above the elution % for ranitidine. Therefore, the focused gradient for ranitidine should be from 35.1–43.1% methanol.
Focused gradient segment time = (% change in slope × column volume)/(focused gradient slope × flow rate)
= (8% × 1.395 mL)/(1.43% × 1.46 mL/min)
= 5.36 min
The focused gradient for ranitidine on the analytical column is from 35.1–43.1% methanol in 5.36 min. Figure 1 (middle) shows the resulting separation for the crude ranitidine mixture using this gradient. Note that the ranitidine peak is better resolved from the surrounding peaks than in the scouting gradient. The focused gradient separation on the analytical column was then scaled to the preparative scale. The gradient was adjusted for gradient delay volume1 and gradient times were adjusted so that the number of column volumes for the duration of the gradient remained constant. The preparative separation can be seen in Figure 1 (bottom). The selectivity on the prep column is identical to the analytical column (middle), thus facilitating easier peak detection and fraction collection.
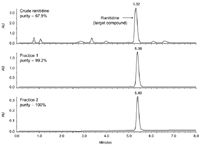
A total of 8.65 mg of the crude ranitidine mixture was injected onto the prep column and collected in two fractions. The fractions were then analysed on the analytical column using the focused gradient shown in Figure 1 (middle). Figure 2 shows the overlay of the two purified fractions and the crude starting material. The resulting purity of both fractions was greater than 99% (middle and bottom chromatograms). These fractions can now be evaporated and used in the next step of the drug development process.

Figure 2: Analysis of crude (top) and purified (middle and bottom) ranitidine using an analytical focused gradient. The focused gradient had an initial hold at 5% B for 1 min, to 35.1% B in 0.5 min, then to 43.1% B in 5.36 min, followed by a rinse at 95% B for 1 min. Flow rate was 1.46 mL/min.
Conclusions
An analytical method using a focused gradient was developed on an XSelect CSH C18 column for the analysis of ranitidine and its associated impurities/degradants. This gradient was then directly transferred to a preparative XSelect CSH Prep C18 OBD column for purification of ranitidine. The resulting fractions were analysed using the analytical method to confirm purity. Directly transferring chromatographic separations between the analytical and preparative column dimensions is accomplished by using the same stationary phase in a different column format. The use of focused gradients allows for high resolution separations without increasing run time. Information about focused gradient parameters can be directly obtained from the analytical screening gradient.
References
1. J.M. Jablonski, T.E. Wheat and D.M. Diehl, Developing focused gradients for isolation and purification, Waters application note, 720002955EN (2009).
©2010 Waters Corporation. Waters, XSelect, CSH Technology, OBD Technology and The Science of What's Possible are trademarks of Waters Corporation. Zantac is a trademark of Glaxo Wellcome plc.

Waters Corporation
34 Maple Street, Milford, Massachusetts 01757
tel. +1 508 478 2000 fax +1 508 478 1990
Website: www.waters.com

Accelerating Monoclonal Antibody Quality Control: The Role of LC–MS in Upstream Bioprocessing
This study highlights the promising potential of LC–MS as a powerful tool for mAb quality control within the context of upstream processing.
Using GC-MS to Measure Improvement Efforts to TNT-Contaminated Soil
April 29th 2025Researchers developing a plant microbial consortium that can repair in-situ high concentration TNT (1434 mg/kg) contaminated soil, as well as overcome the limitations of previous studies that only focused on simulated pollution, used untargeted metabolone gas chromatography-mass spectrometry (GC-MS) to measure their success.
Prioritizing Non-Target Screening in LC–HRMS Environmental Sample Analysis
April 28th 2025When analyzing samples using liquid chromatography–high-resolution mass spectrometry, there are various ways the processes can be improved. Researchers created new methods for prioritizing these strategies.
Potential Obstacles in Chromatographic Analyses Distinguishing Marijuana from Hemp
April 28th 2025LCGC International's April series for National Cannabis Awareness Month concludes with a discussion with Walter B. Wilson from the National Institute of Standard and Technology’s (NIST’s) Chemical Sciences Division regarding recent research his team conducted investigating chromatographic interferences that can potentially inflate the levels of Δ9-THC in Cannabis sativa plant samples, and possible solutions to avoid this problem.

.png&w=3840&q=75)

.png&w=3840&q=75)


.png&w=3840&q=75)


.png&w=3840&q=75)


