ICP MS Detection for HPLC Analyses of Pharmaceutical Products
LCGC North America
The authors investigate applications for ICP-MS detection with reversed-phase HPLC.
Experiments using inductively coupled plasma-mass spectrometry (ICP-MS) as a detection system for reversed-phase chromatographic methods have been conducted for the analyses of various pharmaceutical compounds. Interfacing the ICP-MS instrument to the high performance liquid chromatography (HPLC) system was straightforward. The eluent from the HPLC column was pumped through a photodiode array (PDA) and then directly into the ICP-MS nebulizer using standard sample introduction components at flow rates ranging from 0.5 to 1.5 mL/min. Two separate sets of experiments were carried out. Initial speciation experiments were conducted on the B supplements cyanocobalamin (vitamin B12), biotin, and thiamine (vitamin B1) using isocratic separations. ICP-MS chromatograms were generated by monitoring cobalt at m/z 59, phosphorus at m/z 31, and sulfur at m/z 34 simultaneously. Linear regression data were obtained for cyanocobalamin, thiamine hydrochloride, and biotin. Elemental detection was used to resolve coeluted thiamine and cyanocobalamin peaks in a rapid isocratic separation. The signal for biotin in the sulfur chromatogram was determined to be much larger than that of the corresponding UV chromatogram at 250 nm. In the second set of experiments, an active pharmaceutical ingredient (API) was hydrolyzed with base to monitor the parent compound and two degradation products: degradation product 1 (DP1) and degradation product 2 (DP2). The API molecule contains bromine, chlorine, and sulfur; DP1 contains bromine and sulfur; and DP2 contains chlorine. The ions monitored for analysis of API, DP1, and DP2 were m/z 79 for bromine, m/z 35 for chlorine, and m/z 34 for sulfur. The calculation of relative amounts of API, DP1, and DP2 from the bromine, chlorine, and sulfur chromatograms was performed. The data suggest that the same calculation performed from the UV chromatogram introduces a bias due to the difference in extinction coefficients for each compound. The capacity for monitoring UV absorbance and elemental ions sequentially was demonstrated to provide enhanced analytical specificity without requiring interpretation of complex mass spectra.
Applications were investigated for inductively coupled plasma–mass spectrometry (ICP-MS) detection with reversed-phase high performance liquid chromatography (HPLC) for the speciation of pharmaceutical compounds containing a transition metal (cobalt) or the nonmetallic heteroatoms sulfur, phosphorus, chlorine, and bromine. Multiple elements were monitored simultaneously by ICP-MS in order to fully utilize specificity of elemental detection. An objective of this investigation was to demonstrate the use of elemental detection by ICP-MS with minimal modification of typical packed-column HPLC isocratic and gradient methods. Background signals from polyatomic isobaric interferences at m/z 31, 34, 35, and 79 were attenuated by using a hexapole collision cell charged with a mixture of 1% ammonia–helium.
Proof of concept investigations of this technique were performed using the vitamin B supplements cyanocobalamin (vitamin B12), which contains cobalt and phosphorus; thiamine (B1), which contains sulfur; and biotin, which contains sulfur. These data were collected using isocratic HPLC methods. These compounds were chosen for method development because several HPLC-UV methods have been published to detect water-soluble B vitamins (1–5). Two methods have been reported to detect water-soluble B vitamins, including cyanocobalamin, thiamine, and biotin, using UV detection (6,7). ICP-MS detection has been used previously to detect vitamin B12 (8) by monitoring cobalt at m/z 59. For these experiments, UV and elemental detection were used in a serial arrangement. Cyanocobalamin chromatograms were acquired while monitoring UV absorbance with a photodiode array, along with phosphorus (m/z 31) and cobalt (m/z 59) simultaneously using the ICP-MS.
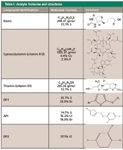
Following the work with the B supplements, the application of the method to the API compound was investigated. These data were collected using a gradient HPLC method. The parent molecule was hydrolyzed with dilute base under elevated temperature to produce degradation product 1 (DP1) and degradation product 2 (DP2). One mole of the active pharmaceutical ingredient (API) molecule contains 1 mole of bromine, 2 moles of chlorine, and 2 moles of sulfur. One mole of compound DP1 contains 1 mole of bromine and 2 moles of sulfur. One mole of DP2 contains 2 moles of chlorine. When hydrolyzed, 1 mole of API will form 1 mole of each degradation product, DP1 and DP2.
See Table I for structures for each compound used for these investigations.

Table I: Analyte formulae and structures
Experimental
A Thermo Elemental X-Series ICP-MS (Waltham, Massachusetts) configured with a hexapole collision cell was used as the elemental detection apparatus. The ICP-MS was configured with a Glass Expansion (West Melbourne, Victoria, Australia) Conikal concentric glass nebulizer and a Thermo glass impact bead spray chamber cooled to 210 °C using a Peltier cooling block. The spray chamber was drained using the integrated ICP-MS system peristaltic pump. A Thermo High Performance Interface (HPI) platinum-tipped sample cone (18-mm Pt insert) was paired with a Thermo HPI nickel Microskimmer skimmer cone. A one-piece quartz torch with a 1.5-mm internal diameter injector tube was used throughout. The ICP-MS chromatographic data were acquired and processed using Thermo PlasmaLab software in the transient time resolved acquisition mode. The ICP-MS workstation was configured with a trigger card and cable to facilitate automatic data acquisition from the HPLC system.

Table II: Element ions and associated polyatomic interferences
HPLC System
A Waters 2695 HPLC system equipped with a Waters 996 PDA detector (Milford, Massachusetts) was used for these studies. An Agilent Zorbax Eclipse XDB-C18 column (150 mm × 4.6 mm, 3.5 μm; Agilent Technologies, Wilmington, Delaware) was used for the B-supplement experiments. An Agilent Zorbax Eclipse XDB-C8 column (150 mm × 4.6 mm, 3.5 μm) was used for the analysis of the API, DP1, and DP2. All of the connections were made with 0.007-in. i.d. PEEK tubing. The eluent from the PDA detector cell was plumbed directly into the ICP-MS sample introduction system.
Reagents, Standards, and Samples
Cyanocobalamin, thiamine hydrochloride, and biotin were obtained from Sigma-Aldrich (St. Louis, Missouri). API material was obtained from Eli Lilly research facilities (Indianapolis, Indiana). HPLC-grade methanol and acetonitrile were purchased from Mallinckrodt (Phillipsburg, New Jersey). Ammonium acetate, acetic acid, and monobasic potassium phosphate were purchased from Sigma-Aldrich. Phosphoric acid was purchased from Mallinckrodt. Sodium hydroxide (1.0 N) was purchased from Red Bird Services (Batesville, Indiana). Milli-Q water (18.3 Mohm-cm) was used throughout (Millipore, Bedford, Massachusetts).
Individual stock solutions of cyanocobalamin, thiamine hydrochloride, and biotin were prepared at a 1000-mg/mL concentration in water. Ammonium hydroxide was added drop-wise to the biotin stock until dissolution. Fresh calibration standard solutions were prepared daily by serially diluting the stock solutions in water. The standards contained a mixture of the three analytes, ranging in concentrations from 5 to 100 mg/mL.
A 1.0-mg/mL API solution was prepared in 0.1 N sodium hydroxide. This solution was thermally stressed at 80 °C for 72 h to form degradation products DP1 and DP2. This solution was injected directly. The 25 mM ammonium acetate buffer was prepared by dissolving ammonium acetate in water and adjusting the final pH to 4.0 with acetic acid. The 25 mM potassium phosphate buffer was prepared by dissolving monobasic potassium phosphate in water and adjusting the final pH to 2.5 with phosphoric acid.
Instrumental Conditions
ICP-MS conditions
A forward power setting of 1.4 kW and nebulizer flow of 0.9060.05 L/min was used for this work. The ICP-MS system was able to tolerate HPLC flow rates as high as 1.5 mL/min without extinguishing the plasma. The HPLC flow rate was optimized according to peak symmetry. Oxygen gas was titrated into the argon nebulizer gas to eliminate carbon deposits on the sample cone and torch injector tube. The collision cell was used for all experiments performed for this work to attenuate the respective polyatomic isobaric interferences for the analytical ions of interest (Table III).

Table III: HPLC conditions
The collision cell was charged with a mixture of 1% ammonia and 99% helium. System optimization was performed by spiking the mobile phase with a suitable source of the element of interest, specifically, cyanocobalamin for 31 P and 59 Co, and API for 34 S, 35 Cl, and 79 Br. Spiked and unspiked mobile phases were alternately introduced into the ICP-MS system using separate channels of the quaternary HPLC pump. The analytical column was replaced with a section of 0.007-in. i.d. PEEK tubing. For optimizing parameters for gradient elution, a 50% mixture of acetonitrile and 0.25 mM phosphate buffer was introduced using separate channels of the HPLC pump. Analyte signal-to-background assessments for optimization were made using the ICP-MS real time display. Compromise parameters were required because multiple elements were acquired simultaneously.
Results and Discussion
Analysis of B-Supplements
Linear regression statistics for the four B-supplement analytes are presented in Table IV.

Table IV: Linear regression statistics for B-supplements by elemental detection
For these experiments, the method quantitation limit has been defined as the low working standard concentration in each standard curve.
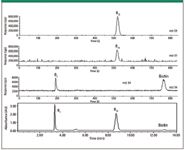
The series of chromatograms in Figure 1 illustrate a potential advantage of monitoring elemental signals by ICP-MS. These data were acquired using isocratic method I. The cyanocobalamin, thiamine, and biotin concentrations of the solution were 100 mg/mL. The biotin molecule exclusively consists of aliphatic carbon–carbon bonds and, therefore, has a small extinction coefficient. Correspondingly, the peak is very small in the UV chromatogram. However, because biotin contains 13.1% sulfur by weight, the biotin peak is very pronounced in the ICP-MS sulfur (m/z 34) chromatogram.

Figure 1: B-supplement chromatograms obtained using isocratic HPLC method I.
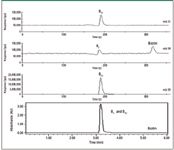
The chromatograms in Figure 2 illustrate the ability of the ICP-MS to resolve coeluted compounds based upon their unique element content. These data were acquired using isocratic method II. Cyanocobalamin and thiamine were coeluted in the 250-nm UV chromatogram at approximately 3.2 min. By monitoring sulfur (m/z 34), phosphorus (m/z 31), and cobalt (m/z 59) sequentially, the thiamine peak is isolated in the ICP-MS sulfur chromatogram, and the cyanocobalamin is isolated in the ICP-MS phosphorus and cobalt chromatograms. This capacity to resolve molecules based upon elemental content has effectively cut the run time from 14 min to 6 min.

Figure 2: B-supplement chromatograms obtained using isocratic HPLC method II.
Analysis of API, DP1, and DP2
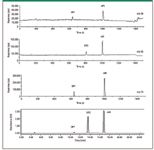
The series of chromatograms in Figure 3 illustrate a potential application of ICP-MS as a detection system for a reversed-phase HPLC assay developed for monitoring relative amounts of an active pharmaceutical ingredient and related degradation products.

Figure 3: API, DP1, and DP2 chromatograms obtained using the gradient HPLC method.
It is standard practice in the pharmaceutical industry to report the relative amount of impurities or degradation products as a percent of total integrated peak area of the chromatogram.
To perform this calculation using the ICP-MS chromatograms, the chlorine (m/z 35) peak area for DP2 was corrected for the relative instrument response of bromine, sulfur, and chlorine in the API ICP-MS chromatograms (Table V). This was necessary because the DP2 molecule contains chlorine, but it does not contain sulfur or bromine.

Table V: ICPâMS peak area calculations for API, DP1, and DP2
The instrument responses for bromine, sulfur, and chlorine also were corrected for the percent weight of each element in each of the three compounds by dividing the peak areas by the respective weight fraction.

Table VI: Relative percentages of API, DP1, and DP2
For example, API is 18.3% bromine by weight. The raw bromine peak area was determined to be 1,173,000 area counts. This value was divided by the bromine/API weight fraction, 0.183, to arrive at the corrected area of 6,409,836 area counts.
The percent of each compound determined from the UV chromatograms recorded at 250 nm and the ICP-MS chromatograms is presented in Table VI. The results presented for the UV chromatogram are calculated directly from the integrated peak areas. The results presented for the ICP-MS chromatograms represent an average of the chlorine peak area calculated separately from both the relative bromine and the sulfur responses.
Hydrolysis of 1 mole of API will result in 1 mole each of degradation products DP1 and DP2, a 1:1 ratio. It is likely that the significant difference in relative peak areas in the UV chromatogram between the two degradation products is due to differences in extinction coefficients of the three compounds. Note that the UV chromatogram in Figure 3 was recorded at the maximum absorbance for API by the PDA detector. This is presented to illustrate further the difference in extinction coefficients for API, DP1, and DP2. Because the ICP-MS elemental responses are independent of the source of the molecular species from which they originate, this mode of detection potentially could provide more accurate percent relative degradation product results than typical UV detection.
In this experiment, the ratio of compound DP1 to DP2 is much closer to the theoretical 1:1 ratio using the ICP-MS data than the relative percent area calculated directly from the UV chromatogram. The calculations from the ICP-MS chromatograms are straightforward, provided that the structure of each compound is known.
Conclusion
The implementation of ICP-MS as a detection system for reversed-phase HPLC has proved to be a useful technique for the investigation of pharmaceutical molecules containing the heteroatoms sulfur, phosphorus, bromine, and chlorine, as well as organometallic compounds containing a transition metal such as cobalt. Multiple isotopes can be monitored simultaneously in sequence with UV detection without altering the HPLC method to accommodate the ICP-MS instrumentation. Interfacing the ICP-MS system with a standard HPLC–PDA system was straightforward. Isocratic and gradient mobile phases were introduced directly into the ICP-MS at flow rates ranging from 0.5 to 1.5 mL/min using standard ICP-MS sample introduction components without detriment to the performance of the system. Enhanced specificity by simultaneous multielement detection can provide resolution of coeluted compounds, provided they contain a heteroatom that can be monitored using ICP-MS. With sequential PDA–ICP-MS detection, this can be accomplished without the need to interpret complex mass spectra. ICP-MS instrument responses are independent of the molecular species from which they originate, which might facilitate investigation of a complex mixture in which one or more compounds do not have a chromophore. However, the relative sensitivity of the elemental detection of a compound depends upon many factors, including the percent composition of the element and the relative abundance of the elemental isotope that is being monitored. For some pharmaceutical applications, elemental detection by ICP-MS might not provide sufficient sensitivity to monitor degradation products adequately down to 0.1% of the parent peak, which typically is the regulatory requirement.
Tim Shelbourn*, Leah Williamson†, Todd Gillespie*, and Robert Montgomery*
* Eli Lilly and Company, Indianapolis, Indiana
† University of Georgia, Athens, Georgia
Please direct correspondence to Tim Shelbourn at Shelbourn_Timothy_Lee@Lilly.com
Tim Shelbourn, Todd Gillespie, and Robert Montgomery are with Eli Lilly and Company, Indianapolis, Indiana. Leah Williamson is with the University of Georgia, Athens, Georgia.
References
(1) B. Klejdus, J. Petrlova, D. Potesil, V. Adam, R. Mikelova, J, Vacek, R. Zikek, and V. Kuban, Anal. Chim. Acta 520, 57–67 (2004).
(2) C. Markopoulou, K. Kaqkadis, and J.E. Koundourellis, J. Pharm. Biomed. Anal. 30, 1403–1410 (2002).
(3) O. Heudi, P. Fontannaz, and E. Marley, J. Chromatogr., A 1101, 63–68 (2006).
(4) P. Chazmichalakis, V. Samanidou, R. Verpoorte, and I. Papadoyannis, J. Sep. Sci. 27, 1181–1188 (2004).
(5) P. Moreno and V. Salvado, J. Chromatogr., A 870, 207–215 (2000).
(6) O. Heudi, T. Kilinc, and P. Fontannaz, J. Chromatogr., A 1070, 49–56 (2005).
(7) H. Li, F. Chen, Chromatographia 54, 217 (2001).
(8) A. Makarov and J. Szpunar, J. Anal. At. Spectrom. 14, 1323–1327 (1999).

New Study Reviews Chromatography Methods for Flavonoid Analysis
April 21st 2025Flavonoids are widely used metabolites that carry out various functions in different industries, such as food and cosmetics. Detecting, separating, and quantifying them in fruit species can be a complicated process.
Extracting Estrogenic Hormones Using Rotating Disk and Modified Clays
April 14th 2025University of Caldas and University of Chile researchers extracted estrogenic hormones from wastewater samples using rotating disk sorption extraction. After extraction, the concentrated analytes were measured using liquid chromatography coupled with photodiode array detection (HPLC-PDA).

.png&w=3840&q=75)

.png&w=3840&q=75)


.png&w=3840&q=75)


.png&w=3840&q=75)


