Facilitating Discovery of Prion Disease Biomarkers by Quantitative Glycoproteomics
LCGC North America
The authors examine MS-based methods to search for protein biomarkers of prion diseases from plasma samples.
Prion diseases, also known as transmissible spongiform encephalopathies (TSEs), are a unique group of neurodegenerative diseases of the central nervous system, which include bovine spongiform encephalopathy (BSE) in cattle, scrapie in sheep, chronic wasting disease (CWD) in deer, and Creutzfeldt–Jacob disease (CJD) in humans. TSEs are caused by the conversion of a normal cellular prion protein designated PrPc into an abnormal form PrPSc (1,2) and are characterized by spongiform degeneration, reactive astrocytosis and prion protein accumulation in the central nervous system. Although the species barrier provides significant protection from the interspecies transmission of prion disease, the BSE epidemic and the resulting rise in variant CJD (vCJD) illustrates the potential impact of prion disease upon human and economic health. Current validated diagnostics for prion diseases are all postmortem. The "gold standard" in prion diagnosis is immunohistochemistry utilizing antiprion protein antibodies on the obex region of the brain (3). Despite the good specificity and sensitivity of these tests, animals infected with prion disease only can be diagnosed late in the preclinical period when sufficient abnormal PrPSc has accumulated in brain tissue.
In recent years, there has been a growing interest in applying mass spectrometry (MS)-based proteomics technology to research on biomarker discovery and clinical diagnostics of diseases such as cancers and neurodegenerative disorders. Body fluids such as plasma and cerebrospinal fluid are rich sources of biomolecules. Investigation of these proteomes can reveal correlations between altered protein expression and certain disorders. The glycoproteome is one of the major subproteomes of blood, where glycoproteins secreted into the bloodstream comprise a major part of the plasma proteome. Functionally, the oligosaccharide moieties of various glycoproteins act as selectivity determinants, playing a fundamental role in many biological processes such as immune response and cellular regulation because cell-to-cell interactions involve sugar–sugar or sugar–protein specific recognition (4). Consequently, aberrant glycosylation has now been implicated in many diseases, including hereditary disorders, immune deficiencies, neurodegenerative diseases, cardiovascular disease, and cancer (5).
Here we present a method that enables isolation, identification, and relative quantification of glycoproteins in blood samples using lectin affinity enrichment, isotopic labeling, and tandem MS. By applying this method, 280 glycoproteins were identified from mouse plasma, among which 49 showed greater than twofold changes in the infected animals compared with the controls. Many of the identified proteins are known to be present at very low abundance, which demonstrates the ability of this method to delve into the plasma proteome.
Materials and Methods
Sample preparation: C57/Bl6 mice were inoculated intraperitoneally with 50 μL of 10% brain homogenate from infected or control mice. At 108 days post-inoculation, animals were anesthetized with isoflorane and blood was collected by cardiac puncture into EDTA-treated vacutainer tubes. The whole blood was centrifuged at 1000xg for 5 min. Plasma was decanted and immediately frozen in liquid nitrogen. Samples from seven infected and seven control mice were pooled separately.
Materials: Tris hydrochloride, chicken ovalbumin, N-acetyl-D-glucosamine, methyl-α-D-mannopyranoside, methyl-α-D-glucopyranoside, manganese chloride tetrahydrate, formaldehyde, deuterated formaldehyde, and sodium cyanoborohydride were purchased from Sigma-Aldrich (St. Louis, Missouri). Sodium chloride, calcium chloride, sodium acetate, and urea were obtained from Fisher Scientific (Pittsburgh, Pennsylvania). Agarose-bound concanavalin A (Con A, 6 mg lectin/mL gel) and wheat germ agglutinin (WGA, 7 mg lectin/mL gel) were purchased from Vector Laboratories (Burlingame, California). Dithiothreitol (DTT) and sequencing grade modified trypsin were purchased from Promega (Madison, Wisconsin). Iodoacetamide was obtained from MP Biomedicals (Solon, Ohio).
Lectin affinity chromatography: Lectin affinity columns were prepared by adding 400 μL each of Con A and WGA slurry to empty Micro Bio-Spin columns (Bio-Rad Laboratories, Hercules, California). The flow through the spin columns was driven by an Eppendorf 5415D centrifuge. A 40-μL volume of pooled mouse plasma was spiked with 4 μg of chicken ovalbumin and was diluted to 400 μL with the binding buffer (20 mM Tris, 0.15 M sodium chloride, 1mM Ca2+ , 1 mM Mn2+ , pH 7.4) and was loaded on the lectin affinity column. After shaking for 6 h, the flow-through containing the unretained proteins was discarded and the lectin bead–protein complexes were washed with 2.5 mL of binding buffer. The captured glycoproteins were eluted with 2 mL of elution buffer (10 mM Tris, 0.075 M sodium chloride, 0.25 M N-acetyl-D-glucosamine, 0.17 M methyl-α-D-mannopyranoside, and 0.17 M methyl-α-D-glucopyranoside). The eluted fraction was concentrated by ultrafiltration using a 10-kDa Centricon Ultracel YM-10 filter (Millipore, Billerica, Massachusetts).
Proteolysis: The concentrated sample was denatured with 6 M urea in 0.2 M sodium acetate buffer, pH 8, and reduced by incubating with 10 mM DTT at 37°C for 1 h. The reduced proteins were alkylated for 1 h in darkness with 40 mM iodoacetamide. The alkylation reaction was quenched by adding DTT to a final concentration of 50 mM. The samples were diluted to a final concentration of 1 M urea. Trypsin was added to the sample at a 50:1 protein to trypsin mass ratio. The sample was incubated at 37 °C overnight.
Isotopic labeling: Sodium cyanoborohydride was added to the protein digest to the final concentration of 50 mM. The control sample was labeled with 0.2 mM formaldehyde, while the infected sample was labeled with 0.2 mM deuterated formaldehyde. The mixture was vortexed, incubated at 37 °C for 1 h. A 2 M ammonium hydroxide solution was added to quench the reaction and the mixture was dried immediately in Speedvac. The samples were reconstituted in 100 μL of doubly distilled water.
High-pH reversed-phase liquid chromatography: Aliquots (50 μL each) of light-labeled control sample and heavy-labeled infected sample were combined and injected onto a Rainin (Varian, Palo Alto, California) high performance liquid chromatography (HPLC) system with a high pH–stable reversed-phase column (150 mm × 2.1 mm, 3 μm Gemini C18, Phenomenex, Torrance, California) at a flow rate of 150 μL/min. The peptides were eluted with a 40-min gradient consisting of 5–45% buffer B (buffer A: 100 mM ammonium formate, pH 10; buffer B: acetonitrile). Fractions were collected every 3 min for 60 min. Collected fractions were dried by Speedvac and reconstituted in 20 μL of 0.1% formic acid. LC–MS-MS analysis was performed using 2-μL injections of each of the 13 fractions containing peptides.
LC–MS-MS: A nanoLC system (Eksigent, Dublin, California) was used to deliver the sample to a trap column and the solvent gradient (mobile phase A: 0.1% formic acid in water; mobile phase B: 0.1% formic acid in acetonitrile). Samples were flushed with mobile phase A at 5 μL/min for 3 min and loaded onto a self-packed column (100 mm × 0.15 mm, 3 μm ProSphere HP C18, Grace Davison Discovery Sciences, Deerfield, Illinois). The peptides were eluted via a 5–40% B gradient in 90 min into a nanoelectrospray-ionization LTQ linear ion-trap mass spectrometer (Thermo Fisher Scientific, San Jose, California). The mass spectrometer was operated in a data-dependent mode in which an initial MS scan recorded the mass range of #m/z# 500–2000, and then the six most abundant ions were selected automatically for collision-activated dissociation (CAD). The spray voltage was 3.0 kV. The normalized collision energy was set at 35% for MS-MS. All MS-MS data were searched against the Swissprot Mus musculus (mouse) protein database using the SEQUEST program. Precursor tolerance was set to 1.4 Da, and fragment tolerance was set to 1.0 Da. A static modification of 57.0215 Da for cysteine residues, and variable modifications of 15.9949 Da for methionine oxidation, 28.0302 Da for light-dimethylation, and 32.0553 Da for heavy-dimethylation on lysine and N-terminus were applied. One missed cleavage site of trypsin was allowed. Filtering criteria for the peptide identification were chosen so that the false discovery rate was lower than 2% determined by the reversed database search. These criteria included Xcorr ≥ 1.5 (+1 charge), 2.2 (+2 charge) and 3.0 (+3 charge); ΔCn ≥ 0.1; peptide probability ≤ 0.001. At least two peptides that met the previously mentioned criteria were required for protein assignment. Relative quantitation was achieved by the PepQuant function in the Bioworks software (Thermo Fisher Scientific, San Jose, California). The ratios of heavy- to light-labeled proteins were normalized according to the ratio obtained by the spiked chicken ovalbumin. Specifically, the raw data files were searched against a database composed only of chicken ovalbumin, and the identified heavy- and light-labeled peptides were compared by PepQuant and a 1.1:1 ratio for heavy-labeled to light-labeled peptide pairs were obtained. All the ratios of identified mouse proteins were then normalized to this internal standard ratio.
Results and Discussion
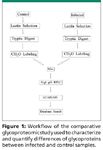
The proteomics studies on serum samples usually suffer from the extreme dynamic range and complexity of proteins. By applying the workflow shown in Figure 1, we incorporated glycoprotein enrichment via lectin affinity chromatography and improved separation of peptides by 2D reversed phase LC before tandem MS experiments to achieve the characterization and quantitation of a total of 280 proteins. Among the proteins identified, 21 exhibited larger than twofold decrease and 28 exhibited larger than twofold increase in their concentrations in the infected samples.

Figure 1
Glycoprotein enrichment by lectin affinity chromatography: The current bottleneck of discovering biomarkers in biofluid using MS is its limited dynamic range of detection compared with a much larger range of protein concentrations in the samples. Recent studies have shown that an effective way to cope with the complexity of the proteome is to use affinity chromatography methods to select a subproteome with a common type of modification. Lectins have been used in glycoprotein and glycopeptide isolation in proteomics, which is referred to as the "glyco-catch method" (6). In our study, to maximize the coverage of the glycoproteome, two lectins with broad selectivities were combined in a single column. Con A has a high affinity to high-mannose type N-glycans, whereas WGA is selective for N-acetyl-glucosamine (GlcNAc). The effectiveness of glycoprotein enrichment has been demonstrated by the identification of several glycoproteins with very low abundance, which will be discussed later in this section. The effectiveness is also evident from the depletion of many of the most abundant proteins. For example, serum albumin, by far the single most abundant protein in blood, takes up about 50% of the total protein mass and usually dominates the identified peptide list (7). However, with the lectin selection, albumin no longer appears on the top of the list. Instead, glycoproteins such as α-2-macroglobulin and complement C3 precursor were identified with the highest scores. It is worth noting that albumin was identified with a moderate number of peptides, due to the interactions with the glycoproteins it carries, or to the nonspecific interactions with the lectin proteins. To further deplete several of the most abundant proteins and enhance the detection of proteins in the low concentration region, an immunodepletion treatment before lectin selection will be desirable (7).

Figure 2
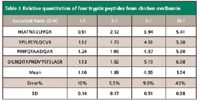
Isotopic labeling by reductive amination: The isotopic labeling technique is based upon the dimethylation of peptide primary amine groups (lysine or N-terminus) with formaldehyde and deuterated formaldehyde in the presence of cyanoborohydride, as shown in Figure 2 (8). A mass difference of 4 Da is produced for each labeling site. The reaction is fast and easy to perform. In a preliminary study, to test the effectiveness and reproducibility of this quantitation approach, different amounts of a standard glycoprotein, chicken ovalbumin, at ratios of 1:1, 1:2, 1:5, and 1:10, were spiked into equal amount of mouse serum samples, respectively, and the quantitation was achieved by a quadrupole time-of-flight (QTOF) mass spectrometer. As expected, most of the mouse serum tryptic peptides appeared to be approximately 1:1 isotopic pairs in the spectra. As for the chicken ovalbumin, four tryptic peptides were identified and the light-to-heavy ratios were measured by integration of their peaks in the chromatogram. The results are shown in Table I. Although the quantitation method starts to lose its linearity above the ratio of 10:1, it is very accurate for a moderate change in ratio. Furthermore, a ratio larger than 10:1 itself would be an indication of a dramatic change in the protein profile, and other immuno-based quantitation methods can be employed to further validate the extent of protein expression change.

Table I: Relative quantitation of four tryptic peptides from chicken ovalbumin
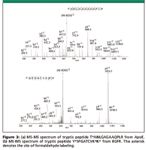
Characterization and quantitation of low-abundance proteins: Figure 3a shows a representative example of MS-MS detection and identification of a tryptic peptide from apolipoprotein E (ApoE). ApoE is an O-glycosylated protein with a concentration of 50–80 μg/mL (9) in both human and mice serum. This protein was implicated previously in TSE disease progression, with an elevated level in the brains of scrapie-infected mice and has been detected in some prion protein deposits (10,11). In the same study, even lower abundance proteins such as epidermal growth factor receptor (EGFR), a membrane glycoprotein with a reported abundance as low as 400 ng/mL in serum samples (12), also were identified (Figure 3b). EGFR is a known transmembrane glycoprotein with three known glycosylation sites and seven potential glycosylation sites.

Figure 3
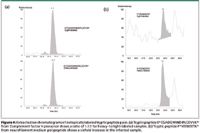
Chicken ovalbumin is used as an internal standard because it is a glycoprotein that can be pulled down readily by Con A, and a separate database serach can be performed to distinguish it from mouse proteins. The heavy- to light-labeled ratios are calculated from the ratios of integrated areas of the peptides in the extracted ion chromatograms. All the tryptic peptides identified for the spiked chicken ovalbumin were averaged to give a 1.1:1 ratio for heavy-labeled to light-labeled peptide pairs, with only 10% error for such a multistep procedure. All of the relative quantitation information was normalized according to this ratio. Extracted ion chromatograms of two isotopically labeled pairs of peptides are shown in Figure 4. Both panels clearly show the co-elution relationship between the heavy- and light-labeled peptide pairs. Panel A shows a peptide assigned to complement factor H precursor with a 1.1 to 1 ratio. This is a secreted glycoprotein with five known glycosylation sites and two potential glycosylation sites. Panel B shows a tryptic peptide FVEEIIEETK from neurofilament medium polypeptide (neurofilament M) exhibiting about a sixfold increase in abundance. A significant peak above the baseline level was extracted for the heavy-labeled peptide, whereas only a small amount of signal was extracted for the light-labeled counterpart. The glycosylation sites of neurofilament M have been characterized by the combination of WGA weak affinity chromatography and MS equipped with electron-capture dissociation (ECD) (13). Neurofilament proteins previously have been shown to be associated with a number of neurodegenerative diseases (14). For example, it has been reported that the levels of antibodies against neurofilament M are elevated in multiple sclerosis (15). The characterization and relative quantitation of this protein of particular interest has demonstrated clearly that the application of our approach in discovering biomarkers in prion diseases is very promising.

Figure 4
Conclusion
In summary, we have successfully developed an analytical platform that can detect and quantify glycoproteins readily in complex biofluid samples. By applying this platform, 280 proteins were identified and quantified, among which 49 proteins have shown larger than twofold changes in the blood samples from mice infected with prion disease. Although this list is preliminary and further replicate experiments must be done to validate the findings, this comparative glycoproteomic methodology offers significant promise in the search for low-abundance and glycosylated disease biomarkers.
In future studies, immuno-depletion of the most abundant proteins before lectin selection will be desirable. Different lectin combinations with various selectivities towards glycan structures will generate different profiles of the serum glycoproteome and provides more information on the changes of glycoproteome of prion disease. Once a panel of proteins can be detected with reproducible changes by MS, other methods such as antibody-based assays will be required for validation before the candidates can be used for diagnostic purposes.
Acknowledgment
The authors would like to thank the University of Wisconsin Human Proteomics Program for access to the LTQ instrument. This work was supported in part by National Institutes of Health through grant AI0272588, the Congressionally Directed Medical Research Program and National Prion Research Program, and the Wisconsin Alumni Research Foundation at the University of Wisconsin-Madison. L.L. acknowledges an Alfred P. Sloan Research Fellowship.
Xin Wei*, Allen Herbst†, Joshua Schmidt‡, Judd Aiken†, and Lingjun Li*†
* Department of Chemistry, University of Wisconsin-Madison
†Department of Animal Health and Biomedical Sciences, University of Wisconsin-Madison
‡School of Pharmacy, University of Wisconsin-Madison, Madison
Please direct correspondence to Lingjun Li at lli@pharmacy.wisc.edu
References
(1) B. Caughey, R.E. Race, D. Ernst, M.J. Buchmeier, and B. Chesebro, J. Virol. 63, 175 (1989).
(2) D.R. Borchelt, M. Scott, A. Taraboulos, N. Stahl, and S.B. Prusiner, J. Cell. Biol. 110, 743 (1990).
(3) O. Schaller, R. Fatzer, M. Stack, J. Clark, W. Cooley, K. Biffiger, S. Egli, M. Doherr, M. Vandevelde, D. Heim, B. Oesch, and M. Moser, Acta Neuropathol. 98, 7 (1999).
(4) C.R. Bertozzi and L.L. Kiessling, Science 291, 2357 (2001).
(5) J.B. Lowe and J.D. Marth, Ann. Rev. Biochem. 72, 643 (2003).
(6) J. Hirabayashi and K.-i. Kasai, J. Chromatogr., B 771, 67 (2002).
(7) M. Ramstrom, C. Hagman, J.K. Mitchell, P.J. Derrick, P. Hakansson, and J. Bergquist, J. Proteom. Res. 4, 410 (2005).
(8) J.L. Hsu, S.Y. Huang, N.H. Chow, and S.H. Chen, Anal. Chem. 75, 6843 (2003).
(9) A.H. Hasty, M.F. Linton, L.L. Swift, and S. Fazio, J. Lipid Res. 40, 1529 (1999).
(10) J.F. Diedrich, P.E. Bendheim, Y.S. Kim, R.I. Carp, and A.T. Haase, P. Nat. Acad. Sci. USA 88, 375 (1991).
(11) J.F. Diedrich, H. Minnigan, R.I. Carp, J.N. Whitaker, R. Race, W. Frey, and A.T. Haase, J. Virol. 65, 4759 (1991).
(12) A.T. Baron, J.M. Lafky, C.H. Boardman, S. Balasubramaniam, V.J. Suman, K.C. Podratz, and N.J. Maihle, Cancer Epidem. Biomar. 8, 129 (1999).
(13) K. Vosseller, J.C. Trinidad, R.J. Chalkley, C.G. Specht, A. Thalhammer, A.J. Lynn, J.O. Snedecor, S. Guan, K.F. Medzihradszky, D.A. Maltby, R. Schoepfer, and A.L. Burlingame, Mol. Cell Proteom. 5, 923 (2006).
(14) R.C. Lariviere and J.P. Julien, J. Neurobiol 58, 131 (2004).
(15) A. Bartos, L. Fialova, J. Soukupova, J. Kukal, I. Malbohan, and J. Pit'ha, J. Neurol. 254, 20 (2007).


.png&w=3840&q=75)

.png&w=3840&q=75)


.png&w=3840&q=75)


.png&w=3840&q=75)


