A Green, Low-Cost Method for Determining Sulphonamides in Milk
LCGC Europe
Whether in industrial nations or developing countries, an international harmonized method for drug residue monitoring in animal products is needed.
Sulphonamides (SAs) are the most widely used drugs for the treatment of mammary or pulmonary infections in cows. Overuse of SAs in lactating dairy cows is of great concern because they can appear in milk — the very same milk that forms a major part of the human diet. The European Union has set a maximum residue limit (MRL), as the sum of all SAs, in milk at 0.1 μg/mL to ensure that milk products suitable for human consumption are virtually residue free.1 Methods for determining SA residues in milk are, therefore, an important means of guaranteeing food safety.
An acceptable method must be simple, reliable, inexpensive, relatively fast and capable of determining residues at concentrations less than the MRL. For environmental reasons, the method should not use organic solvents or hazardous reagents.2–7 Risks associated with these chemicals extend beyond the direct implications on human health and wildlife to effects on the environment and ecosystem. Additionally, treatment and disposal costs for these analytical chemicals has been steadily increasing over the past ten years.
International trade in animal products has expanded in the past 30 years. To guarantee equitable international trade in these products and to ensure food safety for consumers the Codex Committee (in FAO/WHO) is developing and harmonizing international standardized analytical methods for determining veterinary drug residues in animal products.8 Whether in industrial nations or developing countries, an international harmonized method for drug residue monitoring in animal products is needed.
Existing methods for the determination and identification of SA residues in milk using high performance liquid chromatography (HPLC) coupled with ultraviolet,9 fluorescence10 or photodiode array detection,11,12 or mass spectrometry2,13,14 require the use of organic solvents as mobile phases, and organic solvents or hazardous acids15 for extraction and deproteinization in sample preparation. Also, in most of these methods, sample preparation involves several analytical steps, which are time-consuming and expensive.
This article describes a revolutionary method that enables rapid and low-cost determination of five SAs in milk by sample preparation followed by HPLC using 100% aqueous conditions.
Experimental
Materials: HPLC-grade water (distilled) was obtained from Wako Pure Chem. Ltd (Osaka, Japan). Sulphadimidine (SDD), sulphamethoxypyridazine (SMPD), sulphachloropyridazine (SCPD), sulphathiazole (STZ) and sulphamethoxazole (SMX) standards were purchased from Sigma Chemical Co. (St Louis, Missouri, USA).
Stock standard solutions of SDD, SMPD, SCPD, STZ and SMX were prepared by dissolving each in water to a concentration of 100 μg/mL. Mixed standard solutions of these SAs were prepared by diluting the stock solutions with water. The solutions could be kept in a refrigerator for up to one month.
The following were used in the sample preparation: a hand-held ultrasonic-homogenizer (model HOM-100, 2 mm i.d. probe, [Iwaki Glass Co., Ltd, Funabashi, Japan]); a micro-centrifuge (Biofuge fresco, Kendo Laboratory Products, Hanau, Germany); two membrane types of the Ultrafree-MC (nominal molecular weight limit = 5000 Da, maximum sample size = 0.5 mL), -MC/PL (regenerated cellulose ultra-filtration membrane) and -MC/biomax (Biomax high-flux polysulphone ultra-filtration membrane [all Millipore, Bedford, Massachusetts, USA]) as centrifugal ultra-filtration units.
Sample preparation: A 200 μL milk sample was placed in a 1.5 mL microcentrifuge tube and homogenized with a hand-held ultrasonic homogenizer for 20 s with 0.8 mL of water. The capped tube was then centrifuged at 12000 g for 5 min. 100 μL of the supernatant was placed into an Ultrafree-MC/PL and centrifuged at 5000 g for 5 min. The ultra-filtrate was then injected into an HPLC system.
HPLC: The HPLC system included a model PU-980 pump and DG-980-50 degasser (both Jasco Corp., Tokyo, Japan), as well as a model SPD-M10A VP photodiode array detector (Shimadzu Scientific Instruments, Kyoto, Japan). The analytical column used was a 150 × 4.6 mm, 5 μm Discovery HS PEG (polyethyleneglycol, endcapped) column (Sigma-Aldrich Japan, Supelco Division, Tokyo, Japan) with a 300 m2/g surface area and a 120 Å pore diameter. The isocratic mobile phase was 100% water and the flow-rate was set at 1.0 mL/min. The PDA detector was operated at 190–350 nm. Monitoring the SAs wavelength was adjusted to 263 nm, which represented an average maximum wavelength for all the analytes. The column temperature was 37 °C and the injection volume was 20 μL.
Results and Discussion
Sample preparation and optimal HPLC condition: The homogenization enabled satisfactory extraction of SAs from milk samples with 100% water. The extract obtained was deproteinized by subsequent centrifugal ultra-filtration.
We had previously reported that a centrifugal ultra-filtration, with Ultrafree-MC/PL or -MC/Biomax membranes, was an effective clean-up technique for determining SAs in milk.11,12 These procedures were applied to the milk extract processed with 25 or 50% (v/v) ethanol (in water) using the Ultrafree-MC membranes. Table 1 presents the recoveries of SAs using the two Ultrafree-MC membranes of when the milk extract processed with a 100% water was applied to the units. The selected unit gave satisfactory accuracy for all analytes.

Table 1: Comparison of recoveries of SA standards from Ultrafree-Mcs.*
The column used in this study is an extremely low hydrophobic reversed-phase column based on highly purified silica to which PEG groups have been covalently bonded. The PEG sorbent is significantly less hydrophobic than the C1 sorbent. The column can be used with a 100% aqueous mobile phase.
Figure 1 shows the complete separation of five target compounds, their symmetrical natures and their short retention times using the PEG column and an isocratic 100% water mobile phase.

Figure 1: Chromatograms obtained from HPLC analyses of a milk sample (a) and a typical absorption spectra of peak 5 for SMX in the upper chromatogram (b). (a) A milk sample spiked with 0.2 μg/mL of each compound (upper) and a blank milk sample (lower).
As can be seen, the chromatograms are free from interfering compounds for quantification and identification. Separation and identification were achieved in a 10 min run without requiring precolumn washing following analysis. Because HPLC is performed serially, the time of a run becomes more critical in routine residue analysis.
Method Qualification
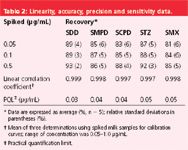
Table 2 summarizes the analytical performance parameters of the complete method. The parameters were linearity, precision, accuracy and sensitivity.

Table 2: Linearity, accuracy, precision and sensitivity data.
Linearity: The practical calibration line was generated by plotting peak areas of fortified sample extracts ranging from 0.05 to 1.0 μg/mL versus concentration. Excellent linearity was found for all target compounds (r ≥ 0.997, P < 0.01).
Accuracy and precision: The average recoveries from milk samples at different spiking levels (0.05, 0.1 and 0.5 μg/mL) were ≥ 81%, (RSDs of 3–7%). These values are well within "acceptable criteria" for residue analysis as defined by the Codex Committee. Acceptable criteria are average recoveries of 80–110% with RSDs < 15% when the MRL for the analyte is 0.1 μg/mL and when the analytical method can be performed with acceptable precision.8
Sensitivity: The sensitivity for each SA under the established conditions was calculated by measuring the analytical background response. The minimum detectable drug amounts (signal-to-noise ratio > 5) were 0.08 ng for SDD; 0.12 ng for SMPD and SCPD; and 0.16 ng for STZ and SMX. The practical quantification limit (PQL) is defined as five times the standard deviation obtained by replicate analysis at a sufficiently low spike concentration. Five different blank samples known to be near the PQL were analysed in duplicate. The PQLs in milk samples were ≤ 0.05 μg/mL (Table 2).
Selectivity: The photodiode array detector chosen provides an easy way to confirm peak identity and enable the separation and identification of target compounds from retention time and spectrum. For example, in Figure 1(b), the SMX spectra obtained from the milk sample is practically identical to that of the standard. The present HPLC system made it unnecessary to use MS to identify the target compounds.
Ruggedness: Using a spiked (0.4 μg/mL of each analyte) milk sample obtained under the established procedure, two chromatographic parameters were examined to demonstrate the ruggedness of the method. The RSDs calculated for ten replicate injections of the extract were 0.09% for peak areas and 0.6% for retention times.
Cost/time performances: The budget and total time required for the analysis of one sample were ~1.46 euro and less than 30 min, respectively.
Monitoring Residues in Marketed Milk
Using the complete procedure, the authors analysed the differences in 30 samples of marketed milk in Osaka and Ibaraki, Japan. No milk samples contained detectable concentrations of SDD (< 0.03), SMPD (< 0.04), SCPD (< 0.04), STZ (< 0.05) or SMX (< 0.05 μg/mL). In addition, the chromatograms were free from interferences.
Conclusions
The present study describes a green, low-cost method for the simultaneous determination of SDD, SMPD, SCPD, STZ and SMX in milk. The complete procedure, which harms neither the environment nor humans, has a short analysis time, is economical and provides reproducible recoveries. The procedure is proposed as an international standardized analytical method for the routine residue monitoring of SDD, SMPD, SCPD, STZ and SMX in milk.
N. Furusawa is an associate professor with the Graduate School of Human Life Science, Osaka City University, Osaka, Japan. K. Kishida is a research associate with the Faculty of Food and Nutrition, Kyushu Nutrition Welfare University, Fukuoka, Japan.
References
1. Commission of the European Community, The rules governing medical products in the European Community IV, Brussels, (1991).
2. K. Dost et al., Analyst, 125, 1243 (2000).
3. M. Ogawa, J. Food Hyg. Soc. Jpn, 37, 289 (1996).
4. M. Ishibashi, J. Food Hyg. Soc. Jpn, 38, J194 (1997).
5. P.T. Anastas and J.C. Warner, "Green Chemistry — Theory and Practice" (Oxford University Press, UK, 1998).
6. R. Malish et al., Dtsch Lebensm-Rundsch., 88, 205 (1992).
7. W.A. Moat, J. AOAC Int., 73, 343 (1990).
8. Codex Alimentarius Commission. "Joint FAO/WHO Food Standards Program, Residues of Veterinary Drugs in Food. Vol. 3", 2nd ed. (Codex Alimentarius Commission, Roma, Italy, 1993).
9. N. Rerez et al., J. AOAC Int., 85, 20 (2002).
10. C.E. Tsai and F. Kondo, J. AOAC Int., 78, 674 (1995).
11. N. Furusawa, J. Chromatogr. A, 898, 185 (2000).
12. N. Furusawa and K. Kishida, Fresen.J. Anal. Chem., 371, 1031 (2001).
13. J. Abian et al., J. Chromatogr., 629, 267 (1993).
14. S. Bogialli et al., J. Agric. Food Chem., 51, 4225 (2003).
15. N. Furusawa, Chromatographia, 57, 317 (2003).

Thermodynamic Insights into Organic Solvent Extraction for Chemical Analysis of Medical Devices
April 16th 2025A new study, published by a researcher from Chemical Characterization Solutions in Minnesota, explored a new approach for sample preparation for the chemical characterization of medical devices.
Sorbonne Researchers Develop Miniaturized GC Detector for VOC Analysis
April 16th 2025A team of scientists from the Paris university developed and optimized MAVERIC, a miniaturized and autonomous gas chromatography (GC) system coupled to a nano-gravimetric detector (NGD) based on a NEMS (nano-electromechanical-system) resonator.
Miniaturized GC–MS Method for BVOC Analysis of Spanish Trees
April 16th 2025University of Valladolid scientists used a miniaturized method for analyzing biogenic volatile organic compounds (BVOCs) emitted by tree species, using headspace solid-phase microextraction coupled with gas chromatography and quadrupole time-of-flight mass spectrometry (HS-SPME-GC–QTOF-MS) has been developed.
A Guide to (U)HPLC Column Selection for Protein Analysis
April 16th 2025Analytical scientists are faced with the task of finding the right column from an almost unmanageable range of products. This paper focuses on columns that enable protein analysis under native conditions through size exclusion, hydrophobic interaction, and ion exchange chromatography. It will highlight the different column characteristics—pore size, particle size, base matrices, column dimensions, ligands—and which questions will help decide which columns to use.


