GC Detectors: From Thermal Conductivity to Vacuum Ultraviolet Absorption
LCGC Europe
A brief history of GC detectors is presented.
Some might consider gas chromatography (GC) a mature technique. However, several substantial advances in GC technology in the past few years have proven that there is still room for innovation. Here, we present a brief history of GC detectors, leading to the most recent introduction of a vacuum ultraviolet (VUV) absorption detector, which has been shown to provide significant benefits in areas where mass spectrometry (MS) detection has problems. It provides full scan absorption spectra in the range of 120–240 nm, where all gas-phase chemical species absorb and have unique spectral features. VUV detection can be used to deconvolute signals from coeluted analytes and has detection sensitivity on par with MS detection.
Is gas chromatography (GC) a mature technique? If one speaks as to whether the use of GC in analytical laboratories is routine and established, then the answer is most certainly yes. If one speaks as to whether there are no new advances to further enhance the technique, then the answer is a resounding no. There have been many recent advances in GC. The use of comprehensive multidimensional GC (GC×GC) has increased significantly in the past decade with the development of more efficient means of modulating the transfer of first dimension separations to the second dimension. Commercial systems and associated software to collect and analyze data for highly complex separations in petrochemical, environmental, and food science applications have allowed a wider user base for GC×GC. Recent advances in column chemistry, including the introduction of ionic liquid stationary phases (1,2) in capillary columns, have enabled novel selectivity on some of the most polar phases available since the 1950s. Until the past few years, there were very few new choices in GC detection concepts. Of course, mass spectrometry (MS) has continued to evolve, but before 2012, one had to look back three decades to see the introduction of new detector concepts; the most well-known detectors were originally developed in the 1950s and 1960s. In 2012, a new embodiment of barrier discharge ionization detection (BID) was introduced by Shimadzu Scientific Instruments, Inc., but in reality, this helium plasma-based technology was originally conceived in 1960. Just this year, the vacuum ultraviolet (VUV) absorption detector was introduced as a new universal detector with unique capabilities. In this instalment of "GC Connections", we recount a brief history of the development of GC detectors through the years (3), and in the end pay special attention to the new VUV detector, which is a clear indication of the ongoing advancement of the still maturing technique of GC.
GC Detector History
Many of the inventors of the first GC detectors are seemingly immortalized pioneers to the young scientists of today. The 1950s and 1960s saw enormous growth in new technology to support major advances. As with many analytical areas, growth was driven by the insatiable desire of a growing industry, particularly the petrochemical industry in those early days. Although the modern-day manifestations of many detectors, supplied by many manufacturers, are vastly improved over initial embodiments, the theory and concepts remain true to an exciting time of new developments in GC. Table 1 shows a comparison of modern GC detectors and their capability to achieve ideal performance parameters.
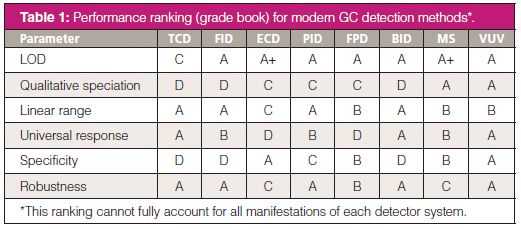
Table 1: Performance ranking (grade book) for modern GC detection methods*.
Early on, titration and gas density balance measurements as a means for detection were quickly eclipsed by more advanced technologies. Originally referred to as a katharometer, Ray (4) was the first to demonstrate thermal conductivity detection (TCD) as a universal means for GC detection. TCD is based on a change in electrical resistance as a gas is passed across a heated filament. The change in resistance in the sample path is measured relative to a reference channel of pure carrier gas. Although all gaseous components yield a signal, the relative sensitivity of this detection device is a few orders of magnitude lower than other detection techniques, especially for flame ionization detection (FID), which was invented soon thereafter. In the United States, Gow-Mac was the first to introduce a TCD system. It was originally used as an automotive engine analyzer in 1935, but was later adapted as a convenient GC detector.
It was not long before researchers devised and implemented FID as a more sensitive detection technique. In 1958, Harley and colleagues (5) and McWilliam and Dewar (6) first demonstrated the potential for passing the column effluent through a hydrogen–air flame as a means of generating ions. While the technique was not truly universal, it was effective for any carbon-containing compounds, which covers a lot of ground. Importantly, detection limits that were 3–4 orders of magnitude better than those obtained by TCD could be demonstrated. Today, FID is still one of the most widely used GC detection methods; it is an excellent resource for quantitative analysis based on sensitivity (low nanogram to high picogram limits of detection [LODs]), linearity, and robustness, but it does not provide any qualitative information. Qualitative assignment with detection methods such as TCD and FID rely heavily on retention time matching. This can be tenuous for very complex mixtures; it may be necessary to perform retention time matching using multiple stationary phases (and analytical runs) to improve confidence in the compound assignment.
In 1959, another major development was the introduction of electron-capture detection (ECD) by Lovelock and Lipsky (7). Featuring a radioactive β-emission source, the electron-capture detector runs with a high standing current. When an analyte with a high electron affinity (for example, halogenated compounds), passes through the cell, a reduction of the current is recorded and transformed into a chromatographic signal. This highly selective detector has been quite popular since its inception, primarily because of its exceptional sensitivity (picogram to femtogram on column LODs). Yet, its incorporation of a radioactive source is a drawback from the stand-point of regulatory issues.
During a time when many were focused on ionization-based detectors, Lovelock was also credited with the introduction of photoionization detection (PID) in 1961 (8). In this case, different discharge gases could be used to create high energy photons in the VUV wavelength regime that were useful for selectively probing alkanes (with photons generated in the 100–120 nm range) or aromatics (photons in the 160–180 nm range). Yet, gas discharges are essentially line sources and thus, while they provided selective detection, the inability to measure absorption across wider wavelength ranges limited their use for qualitative analysis. Other researchers, such as Zlatkis (9) and Driscoll (10), continued to explore the use of PID into the 1970s, 1980s, and 1990s, especially their combination with capillary columns and using some of the first commercial PID formats. Regarding the use of broadband absorption detection, Lagesson and coworkers promoted an ultraviolet (UV) absorption detector for GC right around the turn of the century (11,12). This UV detector offered full scan absorption detection in the range of 168–330 nm, which enabled both quantitative and qualitative analysis of many heteroatom-containing and conjugated compounds that absorb light at longer wavelengths. However, the application of this detector for many gas-phase species is limited because of their low absorption in the UV range; even close to 168 nm, the more limited transmittance of light limits sensitivity in this regime.
Many other detector configurations will be familiar to practicing gas chromatographers. In the late 1950s and 1960s, flame emissivity (13) and flame photometric detectors (FPD) (14) were introduced. In FPD, light from emitting combustion products are measured in a cool hydrogen-rich flame. Phosphorus-containing compounds can be detected based on their emission at 526 nm, while sulphur-containing compounds emit at 394 nm. For these compounds, FPD is quite sensitive, and can provide limits of detection in the picogram on-column range; its sensitivity to hydrocarbons is 3–4 orders of magnitude worse, making the detector quite selective. Similar discrimination and sensitivity for nitrogen- and phosphorus-containing compounds can be obtained with nitrogen–phosphorus detection (NPD), also referred to as thermionic detection. As in ECD, a high standing current is reduced by the presence of compounds that can absorb current produced from the ejection of electrons in a cold plasma between an anode and a cathode.
One of the most powerful GC detection methods, especially when dealing with complex mixtures, is mass spectrometry (MS). It was originally coupled to GC in the 1950s, and began as a very large system that would take up most of the room. Much of the credit for this coupling can be given to Gohlke and McLafferty at Dow Chemical (15). They first reported their efforts in 1956 at an American Chemical Society meeting (16), and then later in full in 1959 (17). Their initial work was based on time-of-flight detection, but in the many years since then a great variety of instrument variations have been used, ranging from high-resolution double-focusing sector systems to more common and inexpensive quadrupole instruments. The introduction of capillary columns was a major advance that reduced the gas flows into the mass spectrometer, which was a major problem with packed column systems. Today's benchtop systems provide excellent qualitative and quantitative performance. They can detect down to low picogram amounts. There are only a few places where the MS detector has problems. This includes the analysis of low mass species where significant noise in the mass spectrum causes interferences, some isomers and isobaric species that generate essentially identical mass spectra, and some highly labile compounds that do not generate a significant signal. Alterations to chromatography ahead of detection can be a solution for some, but perhaps not all of these problems.
As a whole, there have been very limited introductions of new detector technology in the past 30 years. Manufacturers certainly have improved the performance of existing detectors, but entirely new concepts have been lacking. In 2012, Shimadzu introduced their Tracera system, which features a barrier discharge ionization detector. Though this detector provides sensitivity better than FID and universal detection for all species except helium and neon, the detection concept itself was actually introduced many years ago. In 1960, Barry (18) was the first to use helium as a carrier gas for ionization detection. Formation of a plasma for ionization of analytes is based on the Penning effect (19,20). Because the ionization potential for helium is so high (24.6 eV), and higher than most GC analytes, a helium ionization detector is essentially universal (21). The main problem with these early versions was their use of a radioactive source. The new BID system makes use of a high voltage, low frequency power source applied to metal electrodes outside of a quartz tube to create a low-temperature (17.7 eV) helium plasma.
Gas Chromatography–Vacuum Ultraviolet Absorption Detection
It was our pleasure to be involved in the newest introduction of GC detection technology, based on VUV absorption spectrophotometry (22). A schematic in Figure 1 depicts an instrument that measures broadband absorption at a rate of up to 100 Hz from 115 nm to 240 nm. Importantly, all chemical species absorb and have unique gas phase spectra in this wavelength range. The outlet of the GC column is attached to a deactivated stainless steel heated transfer line. Any common carrier gas can be used. The effluent is mixed with a make-up gas (argon or nitrogen, typically), which can be controlled to alter the residence time of the chromatographic peaks in the flow cell. The flow cell itself has a 10-cm pathlength and an approximately 80-µL volume. The make-up flow is optimized to ensure that the detector volume does not induce band broadening, but also that the residence of analyte is sufficient for appropriate signal averaging to reduce noise. A deuterium source lamp supplies the electromagnetic radiation. Reflective optics pass the light through magnesium fluoride windows, through the flow cell, and into the detector module. A charge-coupled detector simultaneously records the transmittance of all wavelengths, in a manner similar to a photodiode-array detector for liquid chromatography. A data station is loaded with software specifically designed to collect and analyze the chromatographic signal. In the current manifestation of the instrumentation, the VUV detector software can either trigger the GC run through a contact closure, the GC can trigger the VUV detector, or separate GC controller software can be used on the data station. In our laboratory, the VUV detector is installed on a Shimadzu GC system, but it has also been installed on Agilent and PerkinElmer systems. There are no limitations in this regard.
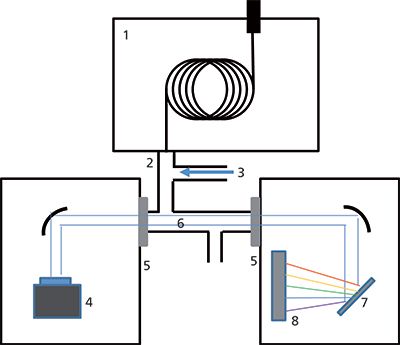
Figure 1: General schematic of a GC–VUV instrument (based on VGA-100 from VUV Analytics, Inc.). 1 = gas chromatograph, 2 = heated transfer line, 3 = make-up gas flow, 4 = deuterium lamp, 5 = MGF2 windows, 6 = flow cell, 7 = diffraction grating, 8 = charge-coupled detector.
In our initial work (22), we focused on showing a breadth of applications, but especially focused on demonstrating the capabilities for VUV detection where MS and FID had problems. We reported the ability to detect spectra for water, nitrogen, carbon dioxide, methanol, hydrocarbons, polyaromatic hydrocarbons, fatty acid methyl esters, and pesticides, among others. A selection of spectra for various analytes is shown in Figure 2. VUV is highly capable of deconvolving the contribution of coeluted analytes when the spectra for different analytes are registered in the spectral library. For example, meta- and para-xylene are quite difficult to separate chromatographically on a standard GC column; however, with VUV detection, the spectra of these isomers are sufficiently distinct to be able to deconvolute each of their contributions to the summed absorption signal measured. In general, by applying spectral filters, where the data for a given signal is projected based on the absorption at different wavelengths, significant selectivity can be attained. Because of the details of the spectral features, quite complex combinations of data treatments along these lines can be considered to enhance data quality. Whereas alkanes absorb in the low wavelength region, as stated above, aromatics absorb at higher wavelengths. By the same principles, with VUV, conjugation and aromaticity are very easy to tell apart from saturated compounds; this is apparent for fatty acid method esters, and in paraffins, isoparaffins, olefins, naphthenes, and aromatics (PIONA) analysis. In fact, the ability to sacrifice resolution and push separations faster, but deconvolute contributions based on well characterized signals is likely to be a major advantage of this technology. It may very well be that the VUV detector will reduce the pressure on manufacturers to provide specialty column technologies for the separation of compounds that cannot be resolved by a given detector, especially MS.
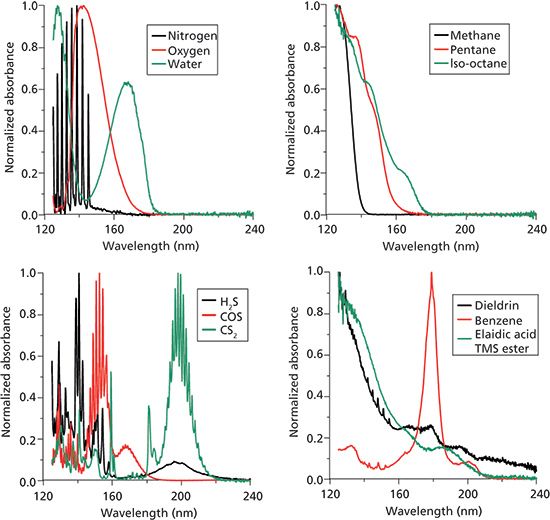
Figure 2: Absorption spectra for selected chemical compounds.
Because all wavelengths are collected simultaneously, chromatograms can be reconstructed using spectral filters. Users of photodiode-array technology will recognize a similar capability, and the ability to gain selectivity and sensitivity for different classes of compounds. From the standpoint of quantitative analysis, different molecules will possess different chromophores, based on their functional and electronic structures. In the VUV wavelength range, σ → σ*, n → π*, and high probability π → π* electronic transitions are probed through absorption events. Aromatic species generally exhibit the latter, and as expected, these compounds are the most sensitively detected. Table 2 shows some limits of detection determined for various different analytes (22). First, it is noted that benzene and napthol exhibit the lowest limit of detection based on their strong chromophores. Given with the LODs in Table 2 is also the integrated wavelength range, or spectral filter over which the absorption data was selected to maximize sensitivity. It should be noted that most of the recorded LODs do not vary by much more than an order of magnitude. In general, for most classes of chemical compounds, the gas-phase absorptivity in the VUV range does not appear to vary as much as it does in liquid-phase UV–vis absorption spectrophotometry. This is another useful aspect of GC–VUV, that sensitive spectral response across the wavelength range monitored gives quite a predictable performance.
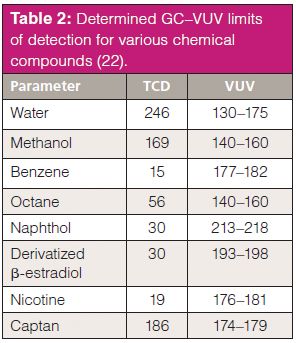
Table 2: Determined GC–VUV limits of detection for various chemical compounds (22).
Another interesting feature of the GC–VUV detector that we have only begun to explore is its potential for pseudo-absolute quantitation of analytes without the need for traditional calibration (23). In short, this means that for analytes that have their absorption cross-section known, the numbers of molecules registering an absorption event can be directly determined from the measurement. With a known detector scan rate, flow cell volume and path length, carrier gas and make-up gas flow rates, and analyte absorption cross-section, the amount of analyte introduced on-column (assuming no extracolumn losses) can be directly determined. That said, in a typical analytical method, many analyte losses are encountered before an injection is made in the instrument, during sample preparation. In capillary GC, a split ratio is also commonly used to avoid column overload, and this further reduces the mass of analyte introduced on-column. So, even though one can determine the amount of analyte that enters the detector, it would be necessary to carry out some determination or internal standardization of sample losses before that point. This is the specification for calling it a pseudo-absolute quantitative method, rather than an absolute quantitative method (23). Even so, this capability could lessen the analytical burden and it can provide an excellent means for carrying out system performance checks at the outset of typical analytical sequences. If a given amount is registered in the detector, then the amount in the sample can be no less than this value, and it would be theoretically equal if perfect transfer of the analyte was attained without any losses.
Conclusions
Based on the scoring in Table 1, VUV shows good promise as the newest member in the GC detector pantheon. Because it provides universal response, yet can be tuned to yield class specific information, even for compounds that cannot be resolved chromatographically or mass spectrometrically, it addresses many common problem areas in GC analysis. It is also robust, and simple to use and maintain. It does not require any special gas configurations aside from the choice of carrier and make-up gases, which are flexible. For analysis of truly unknown samples, there is still much work that can be done. We have started to explore the interface between collected spectra and computational calculations, which may yield new means for spectral interpretation; however, for the vast majority of analytes we have tested using GC–VUV, it was no doubt the first time that anyone had seen their associated VUV absorption spectrum. Significant efforts have been made to populate a reference library of spectra. What is nice about the VUV library compared to an MS library, is that if a search to match an experimental spectrum does not yield the exact compound of interest, in VUV, the search will generally yield the correct class of compound; because MS searches return primarily elemental formulas, search results could span quite a large range of components. As the range of GC–VUV applications grows, we believe that the promise of the technique will grow as well. Consequently, the need for other more specialized detectors and column chemistries may diminish. It seems that the notion of maturity is relative. There is still a lot of work that needs to be done.
Kevin A. Schug is an Associate Professor and Shimadzu Distinguished Professor of Analytical Chemistry in the Department of Chemistry & Biochemistry at The University of Texas (UT) at Arlington, USA. He joined the faculty at UT Arlington in 2005 after completing a Ph.D. in Chemistry at Virginia Tech under the direction of Prof. Harold M. McNair and a post-doctoral fellowship at the University of Vienna under Prof. Wolfgang Lindner. Research in the Schug group spans fundamental and applied areas of separation science and mass spectrometry. Schug was named the LCGC Emerging Leader in Chromatography in 2009, and most recently has been named the 2012 American Chemical Society Division of Analytical Chemistry Young Investigator in Separation Science awardee.
Harold McNair is Professor Emeritus in the Department of Chemistry at Virginia Tech in Blacksburg, Virginia, USA.
"GC Connections" editor John V. Hinshaw is a senior scientist at Serveron Corporation in Beaverton, Oregon, USA, and a member of LCGC Europe's editorial advisory board. Direct correspondence about this column should be addressed to "GC Connections", LCGC Europe, Honeycomb West, Chester Business Park, Chester, CH4 9QH, UK, or e-mail the editor-in-chief, Alasdair Matheson, at amatheson@advanstar.com
References
(1) D.W. Armstrong, L. He, and Y.-S. Liu, Anal. Chem.71, 3873–3876 (1999).
(2) J.L. Anderson and D.W. Armstrong, Anal. Chem.75, 4851–4858 (2003).
(3) K.D. Bartle and P. Myers, Trends Anal. Chem. 21, 547–557 (2002).
(4) N. Ray, J. Appl. Chem.4, 21–25 (1954).
(5) J. Harley, W. Nel, and V. Pretorius, Nature181, 177–178 (1958).
(6) I.G. McWilliam and R.A. Dewar, Nature181, 760 (1958).
(7) J.E. Lovelock and S.R. Lipsky, J. Amer. Chem. Soc. 82, 431–433 (1960).
(8) J.E. Lovelock, Anal. Chem. 33, 162–178 (1961).
(9) B.S. Middleditch, N.-J. Sung, A. Zlatkis, and G. Settembre, Chromatographia23, 273-278 (1987).
(10) J.N. Driscoll, M. Duffy, and S. Pappas, J. Chromatogr. 441, 63-71 (1988).
(11) V. Lagesson, L. Lagesson-Adrasko, J. Andrasko, and F. Baco, J. Chromatogr. A867, 187-206 (2000).
(12) D.G. Hatzinikolaou, V. Lagesson, A.J. Stavridou, A.E. Pouli, L. Lagesson-Andrasko, and J.C. Stavrides, Anal. Chem. 78, 4509-4516 (2006).
(13) D.W. Grant, in Vapour Phase Chromatography, D.H. Desty (Ed.) (Butterworths, London, 1957).
(14) S.S. Brody and J.E. Chaney, J. Gas Chromatogr.4, 42 (1966).
(15) R.S. Gohlke and F.M. McLafferty, J. Am. Soc. Mass Spectrom.4, 367–371 (1993).
(16) W.C. Wiley, Science124, 817–820 (1956).
(17) R.S. Gohlke, Anal. Chem.31, 535–541 (1959).
(18) R. Berry, Nature188, 578–579 (1960).
(19) S. Laksc and J. Sevcik, Chromatogr.5, 311 (1972).
(20) V.A. Rotin and B.G. Gelman, J. Chromatogr.365, 297–307 (1986).
(21) Q. Jin, W. Yang, A. Yu, X. Tian, and F. Wang, J. Chromatogr. A761, 169–179 (1997).
(22) K.A. Schug, I. Sawicki, D.D. Carlton Jr., H. Fan, H.M. McNair, J.P. Nimmo, P. Kroll, J. Smuts, P. Walsh, and D. Harrison, Anal. Chem.86, 8329–8335 (2014).
(23) A. Hulanicki, Pure Appl. Chem. 67, 1906–1911 (1995).

New Study Reviews Chromatography Methods for Flavonoid Analysis
April 21st 2025Flavonoids are widely used metabolites that carry out various functions in different industries, such as food and cosmetics. Detecting, separating, and quantifying them in fruit species can be a complicated process.
University of Rouen-Normandy Scientists Explore Eco-Friendly Sampling Approach for GC-HRMS
April 17th 2025Root exudates—substances secreted by living plant roots—are challenging to sample, as they are typically extracted using artificial devices and can vary widely in both quantity and composition across plant species.
Sorbonne Researchers Develop Miniaturized GC Detector for VOC Analysis
April 16th 2025A team of scientists from the Paris university developed and optimized MAVERIC, a miniaturized and autonomous gas chromatography (GC) system coupled to a nano-gravimetric detector (NGD) based on a NEMS (nano-electromechanical-system) resonator.

.png&w=3840&q=75)

.png&w=3840&q=75)


.png&w=3840&q=75)


.png&w=3840&q=75)


