Fast Analysis of “Dirty” Samples with Monolithic Silica LC and Silica Gel TLC Stationary Phases
LCGC Europe
The development of sample prep, separation, and detection methods for the analysis of food and pharmaceutical samples are described.
This article describes the development of fast and straightforward processes of sample preparation, separation, and detection for the analysis of various food and pharmaceutical samples with a high matrix load. The use of stationary phases such as monolithic silica columns or silica gel thin-layer chromatography (TLC) plates allows for no sample preparation or very simple sample preparation protocols. After the chromatographic separation, samples were analyzed using UV–vis or mass spectrometry (MS) detection. In the case of TLC, MS analysis was performed by applying a combination of a TLC–MS interface and a compact mass spectrometer. The developed setups enabled the identification of colourants, isoflavones, and caffeine in drinks as well as beta blockers and paracetamol in human urine and drug formulations.

(PHOTO CREDIT: WENDELLANDCAROLYN/GETTY IMAGES)
Food and pharmaceutical analyses typically involve the examination of "dirty" samples that are contaminated with particulate matter and may also contain high amounts of dissolved substances. The analysis of food is required to confirm a specified composition, to meet regulatory aspects, and to protect products against fraud. In the pharmaceutical environment the needs are similar; in addition, patient samples must be analyzed for abnormalities, drug molecules, or metabolites (1). In food analyses, the dissolved substances can be carbohydrates, proteins, lipids, or inorganic salts. In the pharma sector, bodily fluids such as blood (whole blood, serum, and plasma) or urine contain proteins, urea, inorganic salts, and organic acids. The main matrix compounds (excipients) of drug formulations are partly soluble additives and binding materials (for example, starch, lactose, or microcrystalline cellulose in pills or glycerides in suppositories) (2).
Click here to view full-size graphic
Sample analysis is a three-step process of sample preparation, separation via chromatography as the most widely used technique, and analyte detection with ultraviolet–visible (UV–vis) spectroscopy or mass spectrometry (MS). In general, sample handling should be minimized to allow for cost-effective investigations. Separation using robust liquid chromatography (LC) columns with a long lifetime or high-performance thin layer chromatography (HPTLC) plates displaying a high matrix tolerance is desirable.
The sample preparation can be as simple as a dissolution step followed by precipitation, filtration, or a multistep solid-phase extraction (SPE) procedure. The sample preparation procedures strongly correlate to the subsequent separation experiment. Particle-packed LC columns often lack robustness and tend to clog, especially when the particle diameter is less than 2 µm; as a result, tedious and time-consuming sample preparation procedures are necessary. In contrast, monolithic silica stationary phases used with standard HPLC equipment are extremely robust and clogging is minimized because of their fritless design and specific pore structure. TLC is a third option for the separation of samples with very high matrix load, and it requires no sample preparation. It is an effective, low-cost, and rather simple method used for the analysis of organic compounds in food, pharmaceutical, and environmental samples. Next to the high matrix tolerance of TLC, another huge advantage is the possibility of performing many chromatographic runs in parallel on one plate (3). Today, all steps from sample application to detection have been automated, which makes reliable quantitative and qualitative analyses possible. Recent developments allow for off-line TLC–MS, adding additional value by generating data about molecular masses and detailed structural parameters of target molecules (4). In addition, MS is by far more sensitive in most applications than widely used detectors such as UV–vis or fluorescence detectors.
Hence, extensive sample preparation procedures can be avoided in most cases when using either monolithic silica columns or TLC plates as stationary phases.
Most analytical laboratories use UV–vis or MS detectors in the final step of sample analysis. The former is a quite unspecific system, but it can handle a high matrix load very well and maintenance intervals are more or less independent of the nature of the analyzed sample. On the other hand, a mass spectrometer delivers precise and specific data about the molecular weight and molecular structure of analytes. But the robustness of the detector is comparably lower, and contamination with matrix components deteriorates reproducibility and accuracy (so-called matrix effects caused by ion suppression or ion enhancement - for example, as might be encountered in quantification) and increases maintenance costs.
As a consequence, the choice of both the detector and the chromatographic column or plate has a direct impact on the efforts to be made during sample preparation.
Here, we present a set of application examples describing the analysis of different food and pharmaceutical samples on a monolithic silica column and with UV–vis or MS detection. The sample preparation protocols were kept as short as possible to meet the requirements of both the stationary phase and the detector, and fast chromatographic separations were achieved via short gradient runs.
In a second set of experiments, HPTLC–MS was used for the determination of analytes in complex sample matrices without applying any tedious classical sample preparation steps. Two methods were developed for the parallel analysis and quantification of caffeine and paracetamol using MS-grade HPTLC silica gel plates and an elution-based TLC–MS interface coupled with a compact mass spectrometer. To enable high sensitivity and low background signals, special MS-grade silica gel HPTLC plates were applied in this setup.
Experimental
Materials and Methods
High Performance Liquid Chromatography: The high performance liquid chromatography (HPLC) system used was a Dionex Ultimate 3000 (Thermo Scientific Dionex Corporation) equipped with a UV–vis detector (detection wavelength 500 nm). The data acquisition was performed with Chromeleon software.
Separation was performed on 50 mm × 2 mm Chromolith FastGradient RP-18 endcapped analytical monolithic silica columns and 5 mm × 2 mm Chromolith RP-18 endcapped guard cartridges (both Merck Millipore).
A Bruker Esquire 6000 mass spectrometer with an ion trap and an on-line electrospray ionization (ESI) source operated in positive mode was used in the m/z 100–600 scan range (depending on the sample).
HPTLC: Images of HPTLC plates were taken under UV irradiation (254 nm). The direct extraction of HPTLC plates was performed using a TLC–MS interface (CAMAG). The interface was directly connected to an Expression CMS mass spectrometer (Advion) operated in positive ESI mode (m/z range 100–300). TLC plates (20 cm × 10 cm HPTLC silica gel 60 F254 MS-grade glass plate) were extracted at 0.1 mL/min with 95:5 (v/v) acetonitrile–water plus 0.1% formic acid. All solvents, reagents, and TLC plates were purchased from Merck Millipore.
Sample Preparation: Soy drink, flavoured alcoholic beverage, and energy soft drinks were obtained from supermarkets and the paracetamol formulations were obtained from a pharmacy. Detailed information about sample preparation or fortification can be found in the different sections below.
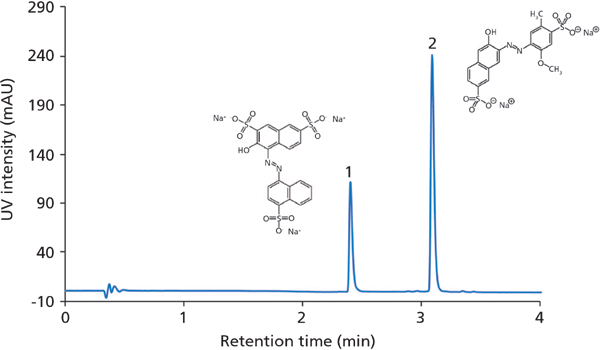
Figure 1: LC-UV chromatogram (control run) of a rum–watermelon beverage sample during a long-term stress test. Column: 50 mm × 2 mm Chromolith FastGradient RP-18 endcapped monolithic silica; mobile-phase A: acetonitrile; mobile phase B: 20 mM ammonium acetate (pH 4.70); gradient: 100% B for 0.5 min, 100–50% B in 4 min, 50–95% B in 0.5 min, 95% B for 1 min; detection: UV–vis (500 nm). Sample: 1 = amaranth, 2 = Allura Red AC.
All solvents, reagents, and equipment used for the sample preparation procedures were purchased from Merck Millipore.
Stock Solutions: A mixture of seven beta blockers was prepared by dissolving the analytes in methanol. Concentrations of the analytes in the stock solution were as follows: atenolol, 184 mg/L; nadolol, 135 mg/L; metoprolol (tartrate), 202 mg/L; labetalol, 194 mg/L; alprenolol, 124 mg/L; and carvediol, 220 mg/L.
For caffeine, one single stock solution with an analyte concentration of 100 mg/L was prepared. Calibration data was collected by applying different volumes of the standard solution onto the TLC plate.
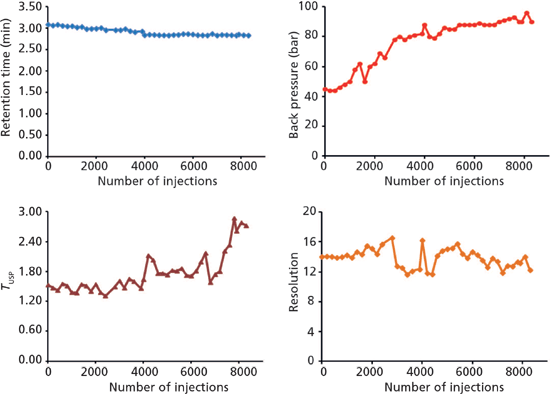
Figure 2: Evaluation of monolithic silica column robustness in long-term analysis of colourants in an alcoholic beverage. Stress test data taken from consecutive control runs as shown in Figure 1.
Rum–Watermelon Beverage: This beverage is an aqueous mixture of rum and the ingredients saccharose, aroma, citric acid, sodium citrate, potassium sorbate, potassium benzoate, caramel E150d, saccharose acetate isobutyrate (E444), glycerol esters of wood resins (E445), and the two red colourants amaranth (E123) and Allura Red AC (E129). Before analysis the only sample preparation step was a filtration using a 0.45-µm Millex syringe microfilter.
Urine: Human urine was centrifuged at 4500 rpm for 45 min and filtered using a 0.45-µm pore diameter syringe filter. The liquid was then combined with the beta blocker stock solution in a 3:1 volume ratio.
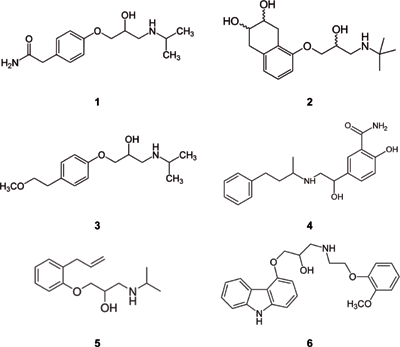
Figure 3: Chemical structures of beta blockers analyzed in this work. 1 = atenolol, 2 = nadolol, 3 = metoprolol, 4 = labetalol, 5 = alprenolol, 6 = carvediol.
Soy Drink: A 10-mL volume of a soy drink was combined with 40 mL of methanol and stirred for 30 min. The precipitated proteins were removed via centrifugation (10 min at 4500 rpm), and the supernatant was filtered using a 0.45-µm syringe filter.
Energy Drinks: Four different energy drink samples were directly applied on the TLC plates without any sample preparation step.
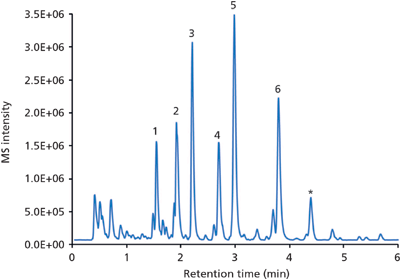
Figure 4: LC–MS base peak chromatogram (BPC) of the analysis of six beta blockers spiked in human urine. Column: 50 mm × 2 mm Chromolith FastGradient RP-18 endcapped monolithic silica; guard cartridge: 5 mm × 2 mm Chromolith RP-18 endcapped; mobile-phase A: acetonitrile plus 0.1% formic acid; mobile-phase B: water plus 0.1% formic acid; gradient: 100–80% B in 1 min, 80–60% B in 4 min, 60–5% B in 1 min, 5% B for 2 min; detection: positive ESI mode, m/z range 100–600. Peaks: 1 = atenolol, 2 = nadolol, 3 = metoprolol, 4 = labetalol, 5 = alprenolol, 6 = carvediol. Asterisk marks impurity from atenolol.
Paracetamol Formulations: The quantitative analysis of paracetamol was performed using three different formulations (suppositories, pills, syrup) and short sample preparation procedures. In detail, one suppository containing 125 mg of paracetamol was diluted in 125 mL of ethanol at 36 °C; 0.2 mL of paracetamol pain syrup containing 4% paracetamol was diluted in 7.8 mL of methanol; and one pill containing 500 mg paracetamol was diluted in 500 mL of methanol and filtered with a 0.45-µm syringe filter. All sample solutions were applied directly after dissolution.
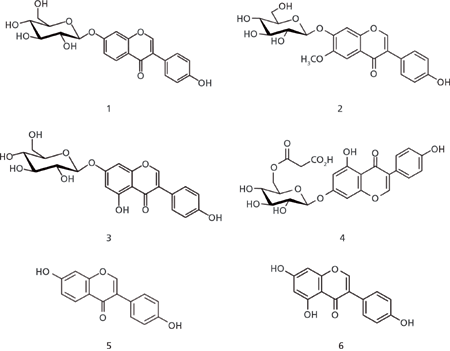
Figure 5: Chemical structures of the six isoflavones detected in a soy drink. 1 = daidzin, 2 = glycitin, 3 = genistin, 4 = malonylgenistin, 5 = daidzein, 6 = genistein.
Results and Discussion
A gradient run method was developed for the analysis of two food colourants - E123 (amaranth) and E129 (Allura Red AC) - in an alcoholic drink containing 5% rum to illustrate method robustness and long-term performance of the monolithic silica column. The test consisted of a repeated procedure of 100 stress test runs (with a flow rate of 1.4 mL/min and a run time of 2 min; other experimental conditions as listed in the caption for Figure 1) followed by two control runs (Figure 1). No sample preparation was conducted before injection of the drink. Both colourants were eluted within approximately 3 min and displayed narrow and symmetric peaks. Figure 2 illustrates how retention, column back pressure, peak shape, and chromatographic resolution between E129 and E123 are affected with time; in total more than 8300 chromatographic runs were performed. The largest effects are seen on peak shape and back pressure. A similar tailing factor (TUSP) for Allura Red AC was obtained over the first 4000 injections, after which some deterioration was observed. Despite column ageing, accurate analysis of all chromatographic parameters was achieved. The column back pressure increases with time as the sample matrix and pump debris accumulates. Hence, the column head had turned black at the end of the long-term performance test, without exceeding a back pressure of 100 bar (1450 psi). The chromatographic resolution between the analytes was substantial (Rs > 10) with good overall retentivity and no additional disturbing peaks were found in the chromatogram.
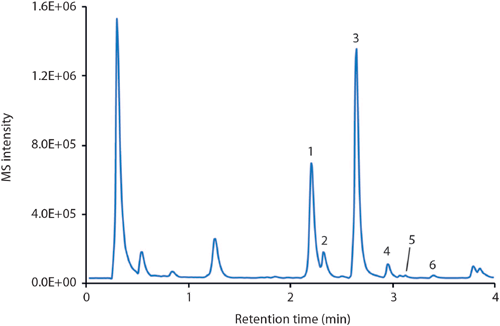
Figure 6: LC–MS (BPC) of the analysis of six natural isoflavones in a soy drink. Column: 50 mm × 2 mm Chromolith FastGradient RP-18 endcapped monolithic silica; mobile-phase A: acetonitrile plus 0.1% formic acid; mobile-phase B: water plus 0.1% formic acid; gradient: 95–85% B in 1.5 min, 85–45% B in 2 min, 45% B for 0.5 min; detection: positive ESI mode, m/z range 200–550. Peaks: 1 = daidzin, 2 = glycitin, 3 = genistin, 4 = malonylgenistin, 5 = daidzein, 6 = genistein.
Beta blockers (Figure 3) are among the most often prescribed drugs that block the effect of adrenaline or noradrenalin in the human body. The main impacts of these drugs are a reduction of blood pressure and heart rate, making them the ideal choice for the treatment of high blood pressure and coronary heart disease. On the other hand, they can be abused by athletes when low sympathetic activity is desirable for high performance. Because of this, beta blockers were banned in some sports (5). Their analysis - for example, in human urine - is of interest when monitoring patients or attempting to prevent drug abuse (doping). Figure 4 displays the LC–MS analysis of six beta blockers spiked in a human urine matrix on a monolithic silica column equipped with a short guard cartridge. After a simple filtration the sample was injected without any further pretreatment. All drugs were separated within 4 min using a short two-step gradient; MS detection was used.
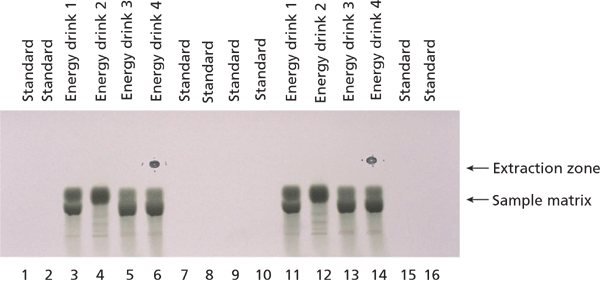
Figure 7: High matrix load of energy drinks made visible via staining of a plate with p-anisaldehyde–sulphuric acid reagent after the whole analysis process (separation, extraction, identification-quantification). The image was taken under ambient light conditions. Several large sample matrix zones were clearly separated from the caffeine spots (invisible under the applied conditions). In the extraction zone, the two dark oval areas (samples 6 and 14) were extracted using the CAMAG interface.
Isoflavones belong to the large group of flavonoids, secondary plant compounds consisting of two aromatic rings connected via a tetrahydropyran entity (Figure 5). Approximately 8000 compounds are known, which vary in their substitution pattern and oxidative properties. Flavonoids are the most important group of plant pigments attracting pollinators, which act as repellents against herbivores or work as UV filters (6). So far flavonoids have not been approved as pharmaceutical drugs. But because of the antioxidative properties that have been prescribed to them and some reports suggesting potential medicinal properties, many substances are being used medicinally. The beneficial effects of fruits, vegetables, tea, and red wine have been attributed to the presence of flavonoid compounds. The analysis of flavonoids is therefore desirable, but challenging because of the complex nature of the sample matrices. Figure 6 illustrates the use of a monolithic silica column, combined with MS detection, for the monitoring of natural isoflavones in a soy drink. Six compounds were identified within 3.5 min, with genistin and daidzin being the most abundant molecules under the chosen conditions.
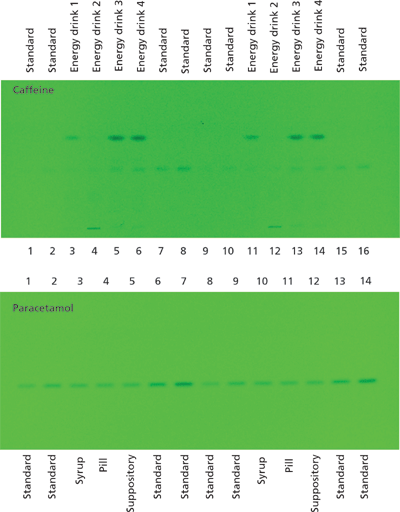
Figure 8: Images of two HPTLC silica gel MS-grade glass plates under UV irradiation (254 nm) after separation of 16 caffeine samples (four energy drinks and standards, top) and 14 paracetamol samples (three different formulations and standards). Separation was performed using 7:3:1 (v/v/v) 2-propanol–n-heptane-water as a mobile phase in 50 min (caffeine) and 1:1 (v/v) acetone–toluene plus 0.1% acetic acid in 9 min (paracetamol), respectively.
Two HPTLC methods were developed for the quantification of caffeine and paracetamol in energy drinks and pharmaceutical formulations using MS-grade silica gel plates. The analysis of caffeine in energy drinks can be performed by direct application of the liquid on the TLC plate. The image in Figure 7 displays the excellent separation of caffeine from high amounts of sample matrix components (mainly saccharose). The broad matrix zones were made visible via staining of the plate with p-anisaldehyde–sulphuric acid reagent after the complete analysis process of separation, quantification, extraction, and identification. Caffeine is not visible under these conditions. In the extraction zone two oval areas are visible. These stem from the extraction process, during which the elution head is pressed on the silica gel plate. The result of the parallel separation of 16 energy drink and standard samples can be seen under UV irradiation (Figure 8). The application of standard solutions together with different corresponding samples on one and the same plate enables a precise quantification. The quantification experiments revealed the caffeine content of the analyzed energy drinks to be in the 0.13–0.41 mg/mL range (Table 1).
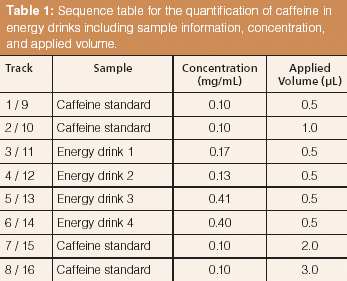
Table 1: Sequence table for the quantification of caffeine in energy drinks including sample information, concentration, and applied volume.
As a second example for the use of TLC in the analysis of samples with high matrix load, the paracetamol content of three pharmaceutical formulations (suppositories, syrup, pills) and of several standards was determined (Figure 8, bottom). A simple dissolution step was used to solubilize the active component, and a filtration step was necessary only in the case of the pill formulation to remove insoluble additives and binder materials.
The identification of both caffeine and paracetamol was performed with the combination of a TLC–MS interface coupled with a mass spectrometer. The analysis of a caffeine spot derived from the separation of an energy drink revealed two signals at m/z 195.12 and 236.06. These were attributed to the protonated molecular ion of caffeine [M+H]+ and the acetonitrile adduct [M+H+ACN]+, respectively. Paracetamol from a syrup formulation was identified via the signals with m/z 152.12 [M+H]+ and 193.18 [M+H+ACN]+ (Figure 9).
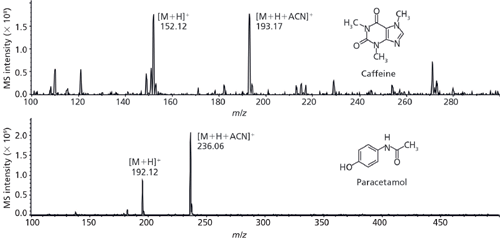
Figure 9: MS spectra of an energy drink sample (top) and a paracetamol formulation (bottom). System: TLC–MS interface (CAMAG); Expression compact mass spectrometer (Advion), detection: positive ESI–MS, m/z range 100–300; HPTLC plate extraction at 0.1 mL/min with 95:5 (v/v) acetonitrile–water plus 0.1% formic acid.
Conclusion
The analysis of complex, "dirty" samples such as food, body fluid, or pharmaceutical formulations was performed using LC and robust monolithic silica columns on standard HPLC systems as well as TLC silica plates in a combination with MS detection. Because of the robust nature of the stationary phases, it was possible to keep the sample preparation procedure short or make it completely unnecessary and in turn achieve short analysis times. In combination, the high matrix tolerance of stationary phases, long lifetime of the monolithic silica column, and the opportunity of parallel analysis of many samples with TLC lead to setups that provide a low cost per analysis.
A hyphenation of HPLC and TLC to MS detection generated data about molecular masses and detailed structural parameters of target molecules and is by far more sensitive in the wide majority of applications than classical UV or fluorescence detection.
Stephan Altmaier and Michael Schulz are with Merck Millipore in Darmstadt, Germany.
References
(1) S.S. Nielsen, in Food Analysis, S.S. Nielsen, Ed. (Kluwer Academic/Plenum Publishers, New York, USA, 3rd Edition, 2002), pp. 13–33.
(2) Handbook of Pharmaceutical Excipients, R.C. Rowe, P.J. Sheskey, and M.E. Quinn, Eds. (Pharmaceutical Press, London, UK, 6th Edition, 2009).
(3) Merck KGaA, ChromBook (Darmstadt, Germany, 2011), pp. 142–147.
(4) G. Morlock and W. Schwack, J. Chromatogr. A1217(43), 6600–6609 (2010).
(6) R. Koes, W. Verweij, and F. Quattrocchio, Trends Plant Sci.10(5), 236–242 (2005).

New TRC Facility Accelerates Innovation and Delivery
April 25th 2025We’ve expanded our capabilities with a state-of-the-art, 200,000 sq ft TRC facility in Toronto, completed in 2024 and staffed by over 100 PhD- and MSc-level scientists. This investment enables the development of more innovative compounds, a broader catalogue and custom offering, and streamlined operations for faster delivery. • Our extensive range of over 100,000 high-quality research chemicals—including APIs, metabolites, and impurities in both native and stable isotope-labelled forms—provides essential tools for uncovering molecular disease mechanisms and exploring new opportunities for therapeutic intervention.
New Guide: Characterising Impurity Standards – What Defines “Good Enough?”
April 25th 2025Impurity reference standards (IRSs) are essential for accurately identifying and quantifying impurities in pharmaceutical development and manufacturing. Yet, with limited regulatory guidance on how much characterisation is truly required for different applications, selecting the right standard can be challenging. To help, LGC has developed a new interactive multimedia guide, packed with expert insights to support your decision-making and give you greater confidence when choosing the right IRS for your specific needs.

.png&w=3840&q=75)

.png&w=3840&q=75)


.png&w=3840&q=75)


.png&w=3840&q=75)


