HPLC Detector Selection — What, Where, When, and How
A guide to HPLC detector selection.
Volume 28 Number 1
Page 66
An excerpt from LCGC's e-learning tutorial on HPLC detector selection at CHROMacademy.com
The ideal UV detector would allow us to monitor the presence of our target analytes without influence from the background eluent and sample matrix components that may be present in the detector measuring cell at the same time. We would want this detector to be able to measure very low levels of the analytes of interest and be stable within the limits of experimental error and not susceptible to changes in response because of changes in temperature or the chemical nature of the eluent system being used. The ideal detector will not contribute to band broadening via dispersion of the analyte, which will make it more difficult to maintain the quality of the separation and will reduce the sensitivity of the detector. The detector response time (sampling rate) needs to be fast enough to properly record the very narrow peaks that are associated with high efficiency forms of chromatography. We also wish the detector was easy to manipulate, simple to understand, mechanically robust, and inexpensive. Despite our pleadings - this detector has, so far, not been invented or commercialized.
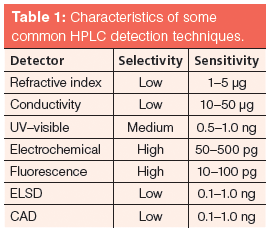
Table 1 shows some generally accepted performance measurements of common HPLC detectors, and you should note that those with the highest selectivity generally give the best sensitivity. The more specific the analyte physicochemical property or combination of properties that are measured by the detector, the less likely that any potentially interfering species will possess the same characteristics; therefore very small amounts of the analyte may be distinguished from the background, giving rise to good inherent sensitivity. Of particular note are evaporative light scattering detection (ELSD) and charged aerosol detection (CAD) which, while measuring relatively general properties of molecules, also retain relatively high sensitivity and are therefore very useful when one needs to detect all analyte species and make relative normalized measurements of analyte concentration within the sample. These detectors are often used in combination with mass spectrometry detectors to ensure all relevant analytes have been detected and estimate normalized analyte concentrations.

Table 1: Characteristics of some common HPLC detection techniques.
UV detection is highly popular because of its wide applicability and ease of use. The analyte will absorb incident light of certain energy (wavelength) according to the electronic configuration of the atoms within the molecule, and unsaturated, conjugated, and analytes containing heteroatoms are most likely to absorb light in the usable region of the UV spectrum. These molecules, which possess a so-called chromophore, give a reasonably linear response in terms of analyte concentration present within a flow cell versus light absorbance and are governed by the relatively straightforward Beer–Lambert law. The main confounding factors in UV detectors are the lack of a chromophore, analytes at high concentration (an absorbance of 1.5 AU or less is recommended to remain within the detector linear range for relative measurement), dispersion by the flow cell, and interference from certain eluent solvents and additives when monitoring signals at wavelengths below 210 nm. The Beer–Lambert law involves a molar absorptivity coefficient that is particular to each analyte and, when pure reference standards are available, can be determined to derive a response factor for the analyte or to make simple relative measurements against standards of known concentration. When pure reference standards are not available, it is common to assume the molar absorptivity is similar for analytes of similar chemistry and use "pseudo" standards. While common, this is not a good practice and one should seek an alternative method of detection if accurate, absolute quantitation of the analyte is required. Diode-array UV detectors are able to measure absorbance over a wide range of wavelengths and as such are able to give UV spectra at any point within the chromatogram to make qualitative analysis possible.
Fluorescence detection is similar to UV, but the property being measured is the fluorescence caused by the relaxation into the ground state of electrons excited by UV radiation of a certain wavelength (energy). The combination of specific energy of excitation and specific wavelength of relaxation makes this detector highly selective and therefore highly sensitive. Of course, the success of this detection method relies upon the analytes of interest being able to fluoresce, which is not as common as having, for example, a chromophore, and so the property that leads to the specificity of the detector also gives rise to its main limitation. One can consider the use of a fluorescing derivatization agent if this detection type is highly favoured.

Understanding FDA Recommendations for N-Nitrosamine Impurity Levels
April 17th 2025We spoke with Josh Hoerner, general manager of Purisys, which specializes in a small volume custom synthesis and specialized controlled substance manufacturing, to gain his perspective on FDA’s recommendations for acceptable intake limits for N-nitrosamine impurities.
University of Rouen-Normandy Scientists Explore Eco-Friendly Sampling Approach for GC-HRMS
April 17th 2025Root exudates—substances secreted by living plant roots—are challenging to sample, as they are typically extracted using artificial devices and can vary widely in both quantity and composition across plant species.
Determining the Serum Proteomic Profile in Migraine Patients with LC–MS
April 17th 2025Researchers used liquid chromatography–mass spectrometry (LC–MS) in their proteomic analysis to compare the serum proteome of migraine patients with healthy controls and to identify differentially expressed proteins as potential migraine biomarkers.


