Food Metabolomics: Fact or Fiction?
It is expected that new developments in analytical chemistry will increase the value of food metabolomics in the future.
Comprehensive analysis of both volatile and non-volatile metabolites in food combined with information on sensory properties and multivariate statistics can be a valuable tool in understanding and improving the taste of food. Performing food metabolomics studies is, however, challenging and requires the analytical measurements to be of a very high quality. Although in some cases more targeted approaches are adequate, it is expected that new developments in analytical chemistry will increase the value of food metabolomics in the future.
Metabolomics plays an important role in systems biology. It enables better understanding of complex interactions in biological systems. There are many definitions and interpretations of metabolomics but generally it aims to analyse as many — if possible all — small molecules (< 1500 Da) in a biological system. The idea is that the biochemical level of the metabolome is closest to that of the daily function of a cell. It is an emerging tool in many disciplines such as plant physiology, drug discovery, human disease and nutrition and others. Developments in analytical chemistry, such as high-resolution mass spectrometry (HRMS), ultra-high pressure liquid chromatography (UHPLC), and software programs for fast processing of large analytical data sets have been responsible for the popularity and evolution of metabolomics.

Metabolomics has also found its place in food science as recently reviewed by Wishart1 and Cevallos-Cevallos et al.2 Within the area of food science, three main applications of metabolomics can be distinguished:
- Food consumption monitoring and/or physiological monitoring of diet and nutrition focuses mainly on analysing nutrients and their metabolites in biofluids and/or health effects of food on an organism. Although this is a very exciting application, concomitant analysis is performed on biofluids or tissue of humans or animals and not on the food itself.
- Food authenticity. This type of analysis is also performed on food itself and the main purpose is to classify samples according to, for example, origin and age. The advantage of this approach is that one is only interested in accurate classification and that can, in many cases, be achieved by a single method like NMR covering a limited number of metabolites. Furthermore, understanding the reason why different samples are separated and thus identifying discriminating metabolites is not of primary interest.
- Food safety or quality improvement where the analyst wants to correlate a specific property, for example, taste, to metabolite patterns using biostatistics. Taking taste as an example, the main goal is often to understand the taste of food in terms of chemical composition and physical properties so it can be optimized by processing and growth conditions, or to find markers that can be measured routinely and easier than taste itself. This puts strong demands on the experimental design. First of all, the specific property, such as sensory scores, should be quantifiable and the variance herein should be well represented by the different samples. Furthermore, the coverage of the analytical methods used should be high, in order to detect all relevant metabolites that lead to understanding and optimizing the specific property. Dependent on the research question, in some cases the relevant metabolites can be analysed by a target analytical platform, while in other cases a more holistic view (i.e. multiple platforms) is required.
Sample Preparation
The typical workflow of a metabolomics experiment is shown in Figure 1. Every aspect of this workflow has to be optimized in order to make metabolomics studies a success. With respect to the analytical chemistry involved in metabolomics, sample work-up, analysis of the samples and data-preprocessing are items that have to be dealt with.

Figure 1: Schematic diagram of the different steps in a food metabolomics experiment.
The sample preparation procedures strongly depend on the type of matrix and compounds of interest. In the case of volatiles, food samples are preferably analysed directly by headspace, solid phase microextraction (SPME) or stir bar sorptive extraction (SBSE) in combination with gas chromatography–mass spectrometry (GC–MS). Choices should be made with respect to adding agents to stop enzymatic reactions, like salt-solutions. This can have both positive and negative effects on the response depending on the specific compound.
For less volatile and non-volatile compounds the sample extraction is determined by the polarity range of interest. In the case of metabolomics, where all metabolites can be of importance, extraction using CHCl3:MeOH:H2O mixtures are most often used to extract both polar and non-polar compounds. Samples should be quickly frozen prior to extraction to stop any further reactions. Extraction should always be performed at low temperature to prevent loss of volatile compounds or thermal degradation.
Usually, a single analytical method will not be sufficient to analyse all relevant metabolites and thus a combination of different methods should be applied to increase the coverage. In the case of taste, it is essential to cover both volatile and non-volatile compounds. Hence the combination of methods for very volatile components, like SPME–GC–MS, and less- or non-volatile components, like GC–MS and LC–MS, is essential but can hardly be found in literature.
In this article, an example of food metabolomics in food quality will be described using tomato sensory properties as a demonstration case. Some highlights of this study will be shown; an extensive paper on this study can be found elsewhere.3 The challenges of this approach will be described, especially from an analytical chemical point of view, and recommendations will be made for future developments in food metabolomics with respect to analytical chemical requirements.
Experimental
Sample generation and work-up: Nineteen different tomato samples from different origins were used. From each sample 22 sensory attributes were quantified in duplicate by a sensory panel consisting of nine assessors.
For SPME–GC–MS, tomatoes were cut into equal parts and stored for 20 min to allow enzymatic reactions to take place. Next, the samples were pulped on ice and liquid nitrogen was added to stop enzymatic reactions. Prior to analysis an equal weight of saturated CaCl2 solution was added.
The sample extraction method applied for GC–MS and LC–MS was adapted from a procedure developed for microbial metabolomics samples where it is essential to quench samples as quickly as possible.4 For oximation silylation-GC–MS (OS-GC–MS), and LC–MS, tomatoes were freeze-dried and grinded followed by extraction using a CHCl3:MeOH:H2O (20:11:9) mixture. After extraction for 30 min at –40 °C, the extracts were centrifuged. The aqueous phase was pipetted off and freeze-dried. Prior to analysis the freeze-dried samples were redissolved in H2O:MeOH 3:1 v/v for LC–MS or derivatized using a solution of ethoxyamine hydrochloride in pyridine followed by silylation with MSTFA.5
Instrumentation and operational conditions: GC–MS was performed on a Agilent 6890 gas chromatograph with an Agilent 5973 mass selective detector (Agilent Technologies, Palo Alto, California, USA). Detection was performed using MS detection in electron impact mode. For SPME–GC–MS, volatiles from mixed tomato/CaCl2 samples were absorbed on a 50/30 μm DVB/Car/PDMS fibre (Supelco, Bellefonte, Pennsylvania, USA) for 15 min at 50 °C. Desorption was performed at 250 °C for 10 min followed by splitless injection on a HP5-MS column (30 m × 0.25 mm i.d., 1 μm; Agilent) with a temperature gradient from 0–320 °C at a rate of 10 °C/min. For OS-GC–MS, derivatized samples were analysed by 1 μL PTV injection on a HP5-MS column (30 × 0.25 mm i.d., 0.25 μm; Agilent) with a temperature gradient from 70–325 °C at a rate of 15 °C/min. LC–MS was performed on a LTQ linear ion-trap system consisting of a Surveyor AS autosampler, Surveyor MS pump and LTQ LT–10000 mass detector with an Opton ESI probe (Thermo Fisher Scientific, San Jose, California, USA). Separation of tomato-extracts (10 μL) was performed on a Xbridge C18 column (100 mm × 2.1 mm i.d., 3.5 μm, Waters, Millford, Massachusetts, USA) using a linear mobile phase gradient from 0.1% formic acid in water (100%) to 0.1% formic acid in acetonitrile (30%) in 30 min with a flow-rate of 300 μL/min. Compounds were detected by ESI in both positive and negative mode (m/z 150–2000).
Results and Discussion
Analysis of the samples: SPME–GC–MS was chosen as the method for volatiles for the tomato samples [Figure 2(a)] and resulted in the analysis of 101 metabolites, including aldehydes, alcohols and thiazoles. Various SPME fibres were tested but the fibre used here showed, on average, the best results for a broad range of volatile compounds. In general SPME shows better sensitivity and coverage than headspace GC–MS but requires more method optimization with respect to adsorption conditions and the type of SPME fibre. Other techniques like stir bar sorptive extraction (SBSE) seem to have superior performance over SPME. Coupling of these techniques to GC×GC–TOF-MS will increase the sensitivity and coverage significantly but non-targeted metabolite quantification of GC×GC–TOF-MS data is still a challenge and very time-consuming.6

Figure 2: Typical chromatograms of tomato samples obtained by (a) SPMEâGCâMS; (b) GCâMS; (c) LCâMSâ(ESI+).
Extreme volatile metabolites are of course difficult to analyse by techniques like SPME–GC–MS and more specific techniques have to be used when it is expected that these types of compounds might be of interest.
A common method used in metabolomics, in many application areas, is GC–MS in which metabolites are first oximated and silylated.5 With this method various classes of small polar compounds can be analysed by GC–MS, such as organic acids, amino acids, sugars, sugar monophosphates, alcohols, aldehydes, amines and acyl monophosphates. These classes of compounds are present in almost every biofluid or food sample, which explains the popularity of this method. As a result this method can be easily applied to a new (food) matrix without extensive optimization. Moreover, large databases exist of mass spectra of reference compounds facilitating identification. Derivatized water/methanol extracts of tomato analysed by OS-GC–MS resulted in the detection of 112 metabolites, including organic acids, amino acids, sugars, amines, sugar phosphates and nucleosides [Figure 2(b)]. However, a significant number of metabolites could not be identified using existing databases. The coverage and sensitivity of the OS-GC–MS method can be increased significantly by using GC×GC–TOF-MS as has been demonstrated for other matrices.7 However, as mentioned before, non-targeted metabolite quantification of GC×GC–TOF-MS data in large scale studies is mainly hampered by the limitation of existing data preprocessing tools.
Non-volatile metabolites are usually analysed by LC–MS. Reversed-phase (RP) LC–MS methods using a C18 column with a mobile phase gradient from water to acetonitrile or methanol are most commonly used for aqueous extracts of food and plant material. Tomato extracts were analysed by RPLC–MS in both the positive ionization (PI) and negative ionization (NI) mode [Figure 2(c)]. Data preprocessing finally resulted in 1394 features that were used for further data analysis. Compounds identified were mainly secondary metabolites like (poly)phenolic compounds and derivatives thereof.
Small differences exist between methods used in literature and usually include additives used for the mobile phases and different types and suppliers of C18 columns. Untargeted screening is performed using ion-trap or time-of-flight mass spectrometers (TOF-MS), preferably in the PI and NI mode to increase the coverage. These methods are especially capable of analysing larger, non-volatile compounds such as phenolics and peptides. These classes of compounds do exist in many different foods and plant materials, but the exact structures are very type-specific. Due to this and the fact that many LC–MS methods exist with somewhat different experimental conditions, no databases are available that can be used for identification. Databases have been set-up, but primarily starting from a specific matrix, for example tomato.8 However, these are often of little use for other matrices. As a result many peaks can often be detected by LC–MS but many remain unidentified. This is a key problem in the success of LC–MS in metabolomics studies. Consequently, standardization of LC–MS methods in combination with proper databases and successful identification strategies are essential for the future of the use of LC–MS in (food) metabolomics.
Recent developments in liquid chromatography, such as columns with sub-2 μm particles in UHPLC have led to increased throughput, better separation and sensitivity in metabolomics applications.9 The issue with respect to the large number of unknown peaks and their identification will then become even more urgent. Other developments, like robust HILIC and mixed-mode columns or ion-pair methods, may lead to the use of more than one LC–MS method in metabolomics studies resulting in increased coverage.10 Ideally these methods will be used for high-throughput detection of small polar metabolites without derivatization, in addition to the larger non-polar metabolites detected with RPLC–MS. Some examples do exist in literature, especially in the field of microbial metabolomics, and have shown that it is possible to detect a wide range of underivatized small polar compounds in complex matrices with LC-based methods.11–13 One limitation of these LC–MS methods is their separation efficiency compared with GC–MS, especially when dealing with isomers like monosaccharides and sugar-phosphates. However, the speed, sensitivity and sample preparation of the LC–MS methods can be superior to GC–MS, for example by coupling of UHPLC to high-resolution MS or MS–MS in hydrophilic interaction liquid chromatography (HILIC) or ion-pair (IP) mode. Quantification of many metabolites in a complex matrix is challenging for both types of methods. While in LC–MS one always has to deal with ion-suppression, the GC–MS method with oximation and silylation shows strongly deviating analytical performance for different classes of compounds, mainly due to the characteristics of the derivatization step 5. Furthermore, with the GC–MS method the results obtained for some metabolites in calibration solutions are very different from that in a complex matrix.5 As a result, the use of labelled standards for LC–MS methods might be sufficient for quantification while this is not true for the GC–MS method, although each metabolite will require its own labelled standard. Therefore these profiling methods are unlikely to be used for absolute quantification in the near future. Future developments in both GC–MS and LC–MS will determine whether LC–MS methods might replace the existing GC–MS methods used in metabolomics.
Data preprocessing
After collection of the data the next step in the metabolomics workflow is data preprocessing (i.e., converting the raw data to reliable peak areas/peak lists). Various programs exist for the different analytical techniques. For GC–MS methods either peak picking or deconvolution is applied. Due to the nature of electron impact ionization, peak picking routines usually lead to enormous peak lists, represented by a mass and retention time, in which a metabolite is represented by many entries which is not ideal for statistical analysis. Therefore deconvolution routines are much more practical and ideally lead to metabolites lists — one entry per metabolite represented by the whole mass spectrum and area based on all masses of the EI mass spectrum. The SPME–GC–MS and OS-GC–MS data of the tomato samples were deconvoluted using TNO-DECO14 and resulted in 101 and 112 metabolites, respectively. For LC–MS data, deconvolution is under development but currently peak picking is usually applied using different freeware software packages (e.g., MetAlign, XCMS, MzMine). Due to the soft ionization in ion-trap and TOF equipment, the mass spectrum of a metabolite often contains one main ion, such as [M–H]– or [M+H]+ or common adducts such as [M+Na]+ depending on the nature of the metabolite and the mobile phases used. Thus, the metabolite can be represented by one mass without losing to much information. Software tools exist that combine masses belonging to one metabolite taking into account chemical rules and knowledge, like natural isotopes and common adduct. For the LC–MS data of the tomato samples, in-house developed alignment and peak picking software was used, resulting in 1181 peaks excluding isotopes and adducts for as much as possible. These are typical numbers of entries obtained with LC–MS in combination with peak-picking algorithms but so far it is not known what percentage of the number of entries are real metabolites as no one has annotated these peak lists.

Figure 3: Standardized analysis scheme used for metabolomics studies.
Many different analytical methods have been developed and applied in metabolomics-related research areas. Interestingly, attention has only very recently been paid to the data quality of these methods using quality control (QC) samples, such as pooled study samples (Figure 3). These samples reflect the average metabolite concentrations and the performance of the analytical platform can be assessed using the relative standard deviation (RSD) of the metabolites in these samples. This approach has only been applied in a qualitative way — by visual inspection — and no attempt was made to really improve the data quality in a quantitative way. However, an explicit way of reducing the analytical error is better.15 Its workflow first consists of data normalization using internal standards (IS) which reduces differences in sample extraction, derivatization and injection volume. With the use of the relative standard deviations (RSDs) of the analyte response in the QC samples to quantify the amount of analytical variation, the best IS is the one that gives a minimum RSD. Adjustments of the analytical instrument between batches of samples can be the cause of analytical errors. This behaviour results in different response factors between and even within batches. Using two types of QC samples the data quality can be improved further. The first type, calibration QC samples, is used to perform a one-point calibration, and the second type, validation QC samples, is used to assess how well the calibration procedure improved the data quality. Figure 4 shows the result of the batch calibration procedure on both the study samples and QC samples. It can be seen that both the intra- and inter-batch trends are corrected for by the procedures. Table 1 shows the result of the calibration procedures on the data quality of the OS-GC–MS tomato data. It can be seen that the raw data are already of good quality and that the calibration procedures lead to further improvement of the data quality.
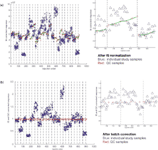
Figure 4: Improvement of the analytical data quality by (a) internal standard (IS) normalization and (b) batch correction.
It is essential to integrate the analytical data coming from the different analytical platforms prior to statistical analysis to find better correlations with the taste attributes. This so-called data fusion procedure16 has been applied to the three different data sets obtained for the tomato samples.
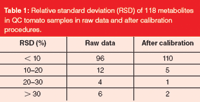
Table 1: Relative standard deviation (RSD) of 118 metabolites in QC tomato samples in raw data and after calibration procedures.
Data analysis
Multivariate data, such as metabolomics data, can be analysed best by multivariate statistics. In contrast to univariate statistics, which looks at one metabolite at the time, multivariate statistics analyses all metabolites simultaneously. This approach has shown to be more powerful and sensitive because it exploits existing relations between metabolites. Principal component analysis (PCA) is a common multivariate statistical method that is often used to summarize and to visualize the relations that exist within variables, such as metabolites or sensory scores, within samples and between samples and variables. Methods like regression analysis that build models on both metabolomics and sensory data are much more suitable for food metabolomics studies because it explicitly models the relation between two data sets (i.e., multivariate metabolomics data and a selected sensory attribute). The quality of the regression model determines if the model is good enough for further interpretation. For that the correlation coefficient (R2) between the predicted and the true outcome is used. Double cross validation is used to determine the R2 in an unbiased way.
Both the sensory data and (fused) analytical data were analysed by typical multivariate techniques such as PCA and partial least squares (PLS). Figure 5(a) shows a so-called PCA biplot displaying both the tomato samples and the sensory attributes. In this plot it can be directly seen which tomato samples score high or low on specific taste attributes. For example, samples 1 and 3 score high on sour, while samples 8 and 12 score high on sweet. It is also clear that tomatoes 16 and 17 are clearly different from the other tomatoes. A similar PCA plot can be made of the fused analytical data [Figure 5(b)]. Again, it can be seen that tomato samples 16 and 17 are different from the others. From these plots it can be concluded that these samples have a significantly different taste and a significantly different metabolite pattern. However this is not true for all samples. Samples 4, 14 and 19 cluster together in Figure 5(a) but in Figure 5(b) sample 4 is separated significantly from samples 19 and 14. In this case the taste of these three samples is similar but the metabolites patterns do show significant differences. One other striking example is samples 8 and 10. In Figure 5(b), these samples are almost on the same spot indicating very similar metabolite patterns. However, in Figure 5(a) samples 8 and 10 are clearly separated, sample 8 scoring high on sweet and sample 10 high on bitter. From this it can be concluded that despite the large differences in taste, the metabolite patterns are very similar indicating that taste differences can be caused by very subtle differences in metabolites. Summarizing, the relative positions of the tomato samples in the sensory PCA plot and metabolomics PCA plot are very different. Hence it can be concluded that PCA analysis does not suffice in correlating tomato sensory data and instrumental metabolomics data. Nevertheless from the overview of Cevallos-Cevallos,2 it is seen that methods like PCA are still used.

Figure 5: (a) PCA plot of the sensory data showing both the tomatoes (numbers) and the attributes to enable interpretation about the relations. In total, 63% of the variation of the sensory data is represented by PC1 (39%) and PC2 (24%); (b) PCA plot of the fused metabolomic data. In total, 39% of the variation of the sensory data is represented by PC1 (25%) and PC2 (14%).
PLS was carried out for different sensory attributes. For sourness R2 = 0.92 as can be seen in Table 2, which indicates that at least 92% of the sensory attribute variation is independently described by the metabolomics data. For other taste attributes similar high R2 values were found after variable selection (see Table 2). From these models the most important metabolites can be determined that contribute most to the model (i.e., explain the most variation in the sensory attribute). Table 3 shows an example of such important metabolites for the PLS model of sourness including the analytical platform they were derived from and whether the metabolites showed a positive or negative correlation with the sensory score. The results in Table 3 demonstrate the added value of applying and integrating different analytical platforms while all methods used in this study are represented. It should be mentioned that part of the important metabolites found for the different taste attributes could not be identified and these were mostly metabolites detected by LC–MS. It was discussed earlier that identification of metabolites, especially those detected by LC–MS, is one of the critical issues in metabolomics which should be solved in the near future in order to make metabolomics a more successful technology. It should be noted that the metabolites themselves do not necessarily lead to the sensory experience with which they correlate. They can also be precursor molecules, cause synergetic or masking effects with other metabolites or have a regulatory role. In this study most of the important metabolites could be identified and of those 29 compounds, 20 were reported earlier to occur in tomatoes.
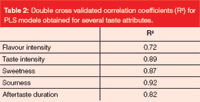
Table 2: Double cross validated correlation coefficients (R2) for PLS models obtained for several taste attributes.
The next step in the whole process is the biological interpretation of the results (i.e., can one understand the observed relation between the identified metabolites and the specific taste attribute). This of course needs profound knowledge of the chemistry of taste in the specific matrix.

Table 3: Selected metabolites on basis of PLS regression on metabolomics data and sensory data on sourness.
Validation is another key step in the metabolomics workflow. In order to demonstrate the validity of the results obtained, a separate second study with new samples and sensory data should be conducted and treated in the same way as described here. With respect to the analytical chemistry involved in metabolomics, this requires good reproducibility of the analytical methods used. For bioanalytical methods it is standard procedure to validate analytical methods according to FDA guidelines including reproducibility. This part has been largely overlooked in metabolomics and only recently has more attention been paid to the stability of analytical methods over long time periods for, for example, large-scale metabolomics studies.17
After positive validation, the results obtained can be used to optimize or improve the taste of food products, for example by adapting growth or food processing conditions.
Conclusions
The different aspects of food metabolomics were described using tomato taste as an example. It is shown that the different parts of the metabolomics workflow should be of high quality in order to be successful. With respect to analytical chemistry, it is essential to have as much metabolite coverage as possible. Therefore different complementary analytical techniques should be used and the data should be integrated. Also aspects like data quality, data preprocessing and metabolite identification are essential aspects within a food metabolomics study. This makes food metabolomics studies often laborious, tedious and costly. However, in cases where targeted approaches using existing knowledge are not sufficient, the food metabolomics approach can be a valuable tool in food science. New technological developments in analytical chemistry and statistics will increase the value of food metabolomics even further.
Acknowledgement
We would like to thank Karin Overkamp, Bianca van der Werf, Jan Jetten, Luco Ravensberg, Miriam Kort, Richard Bas, Bas Muilwijk, Maarten Hekman, Marc Tienstra, Marloes ter Beek, Wilbert Oostrom and Jack Vogels for their contribution to the different aspects of the metabolomics workflow. Toon van de Ven (Monsanto Holland B.V., Antwerp, Belgium) is acknowledged for his contribution to the tomato sensory study.
Leon Coulier is a research scientist and project manager analytical research at TNO. His current research interests include development and application of MS-based metabolomics technology for food, microbial and medical applications.
Albert Tas is a consultant in analytical research and statistics at TNO. He has been active in the field of mass spectrometry, NMR and multivariate statistics for over 30 years.
Uwe Thissen is a research scientist and project manager life sciences at TNO Triskelion BV. His main interests regard the development and application of analytical technologies for innovations in food.
References
1. D.S. Wishart, Trends Food Sci. Technol, 19, 482–493 (2008).
2. J.M. Cevallos-Cevallos et al., Trends Food Sci. Technol., 20, 557–566 (2009).
3. U. Thissen et al., Food Qual. Prefer., (in press) (2010).
4. B. Pieterse et al., J. Microbiol. Methods, 64, 207–216 (2006).
5. M.M. Koek et al., Anal. Chem., 78, 1272–1281 (2006).
6. M.M. Koek et al., Metabolomics, in press.
7. M.M. Koek et al., J. Chromatogr. A, 1186, 420–429 (2008).
8. S. Moco et al., Plant Physiol., 141, 1205–1218 (2006).
9. D. Guillarme et al., Trends Anal. Chem, 29, 15–27 (2010).
10. K. Spagou et al., J. Sep. Sci., 33, 716–727 (2010).
11. H. Yoshida et al., J. Agric. Food Chem, 55, 551–560 (2007).
12. W. Lu et al., Anal. Chem, 82, 3212–3221 (2010).
13. L. Coulier et al., Anal. Chem., 78, 6573–6582 (2006).
14. R.H. Jellema et al., Chemom. Intel. Lab. Syst. 104(1), 132–139 (2010).
15. F. van der Kloet et al., J. Prot. Res., 8, 5132–5141 (2009).
16. A.K. Smilde et al., Anal. Chem., 77, 6729–6736 (2005).
17. S. Bijlsma et al., Anal. Chem, 78, 567–574 (2006).
Analytical Challenges in Measuring Migration from Food Contact Materials
November 2nd 2015Food contact materials contain low molecular weight additives and processing aids which can migrate into foods leading to trace levels of contamination. Food safety is ensured through regulations, comprising compositional controls and migration limits, which present a significant analytical challenge to the food industry to ensure compliance and demonstrate due diligence. Of the various analytical approaches, LC-MS/MS has proved to be an essential tool in monitoring migration of target compounds into foods, and more sophisticated approaches such as LC-high resolution MS (Orbitrap) are being increasingly used for untargeted analysis to monitor non-intentionally added substances. This podcast will provide an overview to this area, illustrated with various applications showing current approaches being employed.

.png&w=3840&q=75)

.png&w=3840&q=75)


.png&w=3840&q=75)


.png&w=3840&q=75)
