Determining Saccharidic Tracers in Atmospheric Aerosols
Levoglucosan is a combustion product of cellulose and, as such, widely used as a unique tracer for biomass burning sources in atmospheric aerosols.
S. Rick1, A. Wille2, and A. Steinbach2,
1Leibniz Center for Tropical Marine Ecology (ZMT) and 2Metrohm International Headquarters
Levoglucosan is a combustion product of cellulose and, as such, widely used as a unique tracer for biomass burning sources in atmospheric aerosols. Similarly, the sugar alcohols arabitol and mannitol are tracers for primary bioparticles, such as fungal spores, in aerosols. Therefore, determination of these polar oxygenated organic compounds is of high interest.
Glass fiber filters containing winter and summer aerosol fractions were extracted with water and analyzed for levoglucosan, mannosan, galactosan, and the sugar alcohols arabitol and mannitol. The analytical method couples ion chromatography with a highly sensitive pulsed amperometric detector (IC-PAD) providing a simple alternative to GC–MS, which requires laborious sample extraction and derivatization. A Metrosep A Supp 15 – 150/4.0 was coupled to a Metrosep Carb 1 – 150/4.0 column. Separation between the levoglucosan and mannosan peaks can be further improved by using the longer Metrosep Carb 1 – 250/4.6 column. The calibration for the anhydrosugars and sugar alcohols is linear over a wide concentration range and thus copes with the strongly varying tracer concentrations in atmospheric aerosols. Less than 17 min were needed to achieve separation with a detection limit for levoglucosan of approximately 5 ng/m3.
Aerosol concentrations of the isomeric anhydrosugars made up the largest fraction of identified carbohydrates in both winter and summer. Owing to elevated wood burning during the winter season, concentrations of the anhydrosugars were clearly higher in winter, while biogenic sugar alcohol and glucose contributions were more prevalent during the summer season.
The presented methodology allows the sensitive and robust determination of saccharidic tracers in atmospheric aerosols enabling a deeper understanding of biomass burning and primary biogenic aerosols.
Besides vehicle emissions and industrial sources, biomass burning is one of the largest sources of air pollution. Approximately 3 billion metric tons of biomass are annually burned. Main contributions derive from residential wood burning, the burning of leaves, grass, and trash as well as from wildfires. The evolving atmospheric aerosol particles — suspensions of fine solid particles or liquid droplets in a gas — can persist for days to weeks in the troposphere and thus significantly contribute to long-range particle transport. Most of the released smoke aerosol particles are smaller than 10 microns in size (PM10) and can easily enter the human lung and cause adverse health effects. Moreover, smoke aerosol particles affect cloud formation and precipitation and thus the climate in general. For this reason, properties and chemical composition of aerosol particulate matter have to be investigated.
Aerosols consist of a complex mixture of inorganic and organic compounds. Especially, the water-soluble organic compounds (WSOC) make up a major fraction of the atmospheric aerosol. Within the WSOC, the monosaccharide anhydrides levoglucosan (1,6-anhydro-beta-D-glucopyranose) and, to a lesser extent, its stereoisomers mannosan (1,6-anhydro-beta-D-mannopyranose) and galactosan (1,6-anhydrobeta-D-galactose) can be determined as thermal degradation products of structural polysaccharides present in biomass. While levoglucosan arises from the pyrolysis of cellulose, the main building material of wood, its stereoisomers mannosan and galactosan stem from the pyrolysis of hemicellulose. During the combustion of fossil fuels no anhydrosugars are released. Levoglucosan fulfils all important requirements of an ideal molecular marker necessary for source apportionment: it is abundant in wood smoke, highly source specific, and relatively stable in the atmosphere. In contrast, monosaccharides are released by microrganisms, plants, and animals; sugar alcohols are characteristic for fungi, lichens, and bacteria. In particular, arabitol and mannitol, which are storage substances in fungal spores, can be used as valuable tracers for quantifying airborne fungal spores (1).
Anhydrosugars are typically extracted into an organic solvent, derivatized with a silylation reagent, and most commonly determined via gas chromatographic (GC) separation with mass spectrometric detection (MS). Due to their polar nature, these compounds are challenging to analyse by GC–MS. A faster and simpler method, which does not require relatively sophisticated and expensive analytical instrumentation, organic solvents, sample workup, and derivatization, is ion chromatography (IC) followed by pulsed amperometric detection (PAD). PAD, the oxidation of electrochemical active molecule groups at a gold electrode, works well for carbohydrates and combines the advantages of an excellent sensitivity and good selectivity over other classes of compounds. Moreover, IC-PAD allows a straightforward water extraction of the large WSOC fraction of aerosols and thus excels by the possibility to handle wet samples, such as rain, fog, or cloud water (2, 3). Characterization of these samples is important for understanding the role of aerosols in cloud formation and precipitation.
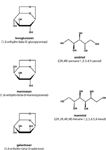
This study presents a straightforward ion chromatographic method with amperometric detection for the simultaneous determination of the biomass burning tracer levoglucosan, its stereoisomeric anhydrosugars mannosan and galactosan as well as the sugar alcohols arabitol and mannitol (Figure 1).

Figure 1: Chemical structures of the anhydrosugars levoglucosan, mannosan, and galactosan as well as of the sugar alcohols arabitol and mannitol.
Materials and Methods
Instrumentation
871 Advanced Bioscan
838 Advanced IC Sample Processor
818 Advanced IC Pump
Reagents and Eluents
Levoglucosan, the sugar alcohols, and glucose were reagent grade and purchased from Fluka (Sigma Aldrich, Buchs, Switzerland). Mannosan and galactosan were obtained from Carbosynth Ltd (Berkshire, UK). All standard solutions and eluents were prepared with deionized water having a specific resistance higher than 18 MΩ·cm. A carbohydrate standard mix covering the concentration range 80–800 μg/L served to determine the system characteristics. An air monitoring agency provided the aerosol winter and summer filter subsamples for method development.

Figure 2: PAD chromatograms of an 8-component carbohydrate standard using a Metrosep A Supp 15 â 150/4.0 column in series with a Metrosep Carb 1 â 150/4.0 (a) and a Metrosep Carb 1 â 250/4.6 (b). The following determinations were performed with the shorter Metrosep Carb 1 â 150/4.0 column; Table I summarizes the chromatographic parameters and the PAD settings of the method.
Separation, Calibration, and Precision
A problem frequently encountered in the analysis of atmospherically relevant saccharidic compounds in aerosols is the poor chromatographic separation of the two compound pairs arabitol/levoglucosan and mannitol/mannosan (4). Because both pairs represent different compound classes and are important tracers for different aerosol sources, chromatographic separation is crucial. To overcome this drawback, the optimized IC-PAD method uses two columns in series, a Metrosep Carb 1 – 150/4.0 and a Metrosep A Supp 15 – 150/4.0, and thus achieves an excellent separation of anhydrosugars and sugar alcohols in a single isocratic run in less than 17 min [Figure 2(a)]. Separation, especially between levoglucosan and mannosan, can be further improved by using a weaker eluent or a longer carbohydrate separation column [250 mm instead of 150 mm, Figure 2(b)].

Figure 3: Calibration curves of (a) the sugar alcohols inositol, erythritol, arabitol, and mannitol as well as of the (b) anhydrosugars levoglucosan, mannosan, and galactosan using linear regression.
The saccharidic tracers are determined by applying a triple-step potential waveform: a positive potential E1 to determine the carbohydrates followed by a stronger pulse E2 for oxidative desorption of adsorbed species and finally a third, negative potential E3 to reactivate the electrode's surface (Table I). The entire sequence lasts 1 s and is continuously repeated. PAD detection is highly sensitive and as shown in Figure 3, calibration curves are linear over a wide concentration range. Calibration curves for the atmospherically important saccharidic compounds have correlation coefficients (R) better than 0.9998 (Table II). The reproducibility of the IC-PAD method was evaluated for the peak height of each carbohydrate with RSDs equal to or less than 2%. The detection limit for levoglucosan was estimated to be below 10 μg/m3 using a 100 μL loop. With an extraction volume of 4 mL, 5 ng/m3 levoglucosan aerosol concentration can be determined. These data show the suitability of IC-PAD to accurately quantify water-extractable saccharidic compounds in atmospheric aerosols.

Table I: Chromatographic parameters and PAD settings of carbohydrate determinations
Filter Extraction
Contribution of biomass smoke and biogenic sources to ambient aerosol levels is determined by collecting the aerosol fraction of a defined air volume on a filter. Before extraction, the 15 cm diameter glass fiber filter, through which 80 m3 air was drawn, was subdivided into 4.7 cm diameter filter samples. After addition of 14 mL ultrapure water, the filters were treated by ultrasonic extraction for about 30 min. Before injection, samples were filtrated through a 0.45 μm syringe filter. Alternatively, Metrohm's Inline Ultrafiltration was used. In case concentrations on the filters are very low, the extraction volume may be reduced to 4 mL.

Table II: Linearity and precision of the developed method
Results
Seasonal Variations in Summer and Winter Samples
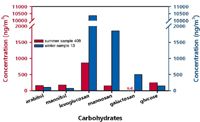
Table III shows the results of the determined carbohydrate concentrations of three analyzed winter and four summer filter extracts. Figure 4 contains the chromatograms of an exemplary winter (ID 13) and summer sample (ID 408); corresponding aerosol concentrations in ng/m3 are plotted in the bar chart of Figure 5. The anhydrosugars levoglucosan and mannosan as well as the sugar alcohols arabitol and mannitol and the monosaccharide glucose were detected in each filter. Galactosan was only quantified in one summer filter in the low μg/L range. In both summer and winter samples, levoglucosan was the most dominant identified carbohydrate. The highest levoglucosan concentration, approximately ten times higher than that detected in summer, was observed in winter, when residential wood burning for heating purposes was most intense.

Table III: Overview of analyzed glass fiber winter and summer samples and corresponding carbohydrate concentrations
In summer, concentrations of combustion-derived anhydrosugars strongly decreased whereas the contributions of biogenic sugars and sugar alcohols increased. Arabitol and mannitol summer aerosol concentrations even achieved mannosan levels. These results are consistent with the fact that in summer the biological activity and thus the emission of biogenic volatile organic compounds such as fungal spores and plant pollen is at their maximum.

Figure 4: PAD chromatogram obtained from the analysis of (a) the winter sample 13 and (b) the summer sample 408.
Conclusions
Ion chromatographic determination coupled with pulsed amperometric detection is highly sensitive and selective to saccharidic aerosol tracers. After straightforward water extraction of the filters, atmospheric tracers for biomass combustion and for biogenic sources can be determined at the ng/m3 scale. The method requires no complex sample pretreatment or derivatization and is well suited to handle a large number of samples. The IC-PAD method is an invaluable tool for the distinction between anthropogenic and natural aerosol emissions and offers novel insights for elucidating the impact of atmospheric aerosols on the climate.

Figure 5: Bar chart comparing the detected carbohydrate concentrations in (a) the winter sample 13 and (b) the summer sample 408.
References
(1) H. Bauer et al., Atmospheric Environment, 42, 588–593 (2008).
(2) G. Schkolnik and Y. Rudich, Anal. Bioanal. Chem., 385, 26–33 (2006).
(3) G. Schkolnik et al., Environ. Sci. Technol., 39, 2744–2752 (2005).
(4) A. Caseiro et al., J. Chromatogr. A, 1171, 37–45 (2007).

Metrohm International Headquarters
Oberdorfstrasse 68, CH-9101 Herisau, Switzerland
tel. +41 71 353 85 04
Email: aw@metrohm.com; Website: www.metrohm.com

SEC-MALS of Antibody Therapeutics—A Robust Method for In-Depth Sample Characterization
June 1st 2022Monoclonal antibodies (mAbs) are effective therapeutics for cancers, auto-immune diseases, viral infections, and other diseases. Recent developments in antibody therapeutics aim to add more specific binding regions (bi- and multi-specificity) to increase their effectiveness and/or to downsize the molecule to the specific binding regions (for example, scFv or Fab fragment) to achieve better penetration of the tissue. As the molecule gets more complex, the possible high and low molecular weight (H/LMW) impurities become more complex, too. In order to accurately analyze the various species, more advanced detection than ultraviolet (UV) is required to characterize a mAb sample.


