Determination of Furan in Coffee by Static and Dynamic Headspace-GC–MS
Coffees have aroma and taste based on where the beans are grown, roasting techniques, and flavor additives.
Roger Bardsley, Teledyne Tekmar
Coffees have aroma and taste based on where the beans are grown, roasting techniques, and flavor additives. One component of the bean responsible for the aroma and some of the taste are volatile organic compounds (VOCs). Furan is one VOC that has recently been investigated in food (1).
An FDA method for furan in food uses static headspace and requires 30 min of incubation time at 60 °C (2). This paper presents data comparing the determination of furan in dry coffee by both static and dynamic headspace techniques. In the dynamic headspace method analytes are swept and concentrated on a sorbent trap that greatly increases compound sensitivity and decreases sample preparation time.
Experimental- Instrument Conditions
Coffee samples of 5 grams were weighed into vials and crimp capped. Both the static and dynamic methods maintained the sample at 60 °C with the valve oven and transfer line held at 100 °C. The static method followed the FDA's 30 min sample heating time (2). The vial was then pressurized to 10 psi and the loop filled to 5 psi. The loop contents were transfered to the Thermo Focus DSQ™II GC–MS for detection and quantitation with EnviroLab Forms™ 3.0 mass spectrometry software.
The dynamic method trapped the VOCs on a proprietary #9 trap by sweeping the sample for 15 min at 50 mL/min. The VOCs were rapidly desorbed from the trap at 250 °C and detected with the Thermo Focus DSQ™II GC–MS.
A Restek Rtx®-VMS, 20 m by 0.18 mm internal diameter column with a 1.0 m film thickness was used for both static and dynamic headspace samples. The column had a constant flow of 1.0 mL/min helium and an oven program of 35 °C for 4 min, then 16 °C/min to 80 °C, then 30 °C/min to 230 °C with a final hold of 3 min. The inlet was held at 220 °C with a split ratio of 80:1. The mass spectrometer was scanned from 35 m/z to 300 m/z with the source at 230 °C and a scan rate of 1492.11.
Results
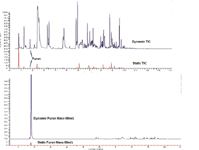
The peak area of the 68 m/z ion specific for furan with both the static and the dynamic methods were compared. Table I is the furan peak area data from the mass 68 m/z chromatogram in Figure 1.

Table I: Furan peak area data from the mass 68 m/z chromatogram in Figure 1
Conclusions
The dynamic technique detects approximately 30 times more furan from the same size sample when compared to a static method. In addition the dynamic option shortens the analysis time to 15 min.

Figure 1: Comparison of the Dynamic (Blue) and Static (Red) total ion chromatogram (TIC) (top) and the specific mass Ion 68 m/z for Furan (bottom).
The HT3 system offers food scientists a powerful analysis tool that can perform both static and dynamic techniques in a single package thus optimizing performance as well as efficiency.
References
(1) Report of the Scientific Panel on Contaminants in the Food Chain on Provisional Findings on Furan in Food, Adopted on 7 December 2004, The EFSA Journal, 137, 1–20, http://www.efsa.eu.int (2004).
(2) Determination of Furan in Foods, US Food and Drug Administration, October 27, 2006.

Teledyne Tekmar
4736 Socialville Foster Road, Mason, OH 45040
tel. (800) 874-2004; fax (513) 229-7050
Website: www.teledynetekmar.com


