The Determination of Furan in Foods — Challenges and Solutions
LCGC Europe
The determination of the carcinogenic food processing contaminant furan by headspace sampling of foods is challenging because it can easily escape from the sample during preparation. Furan can also be easily formed as a by-product when the sample is heated in the headspace apparatus. This article describes a number of approaches to overcome these difficulties and alternative methods to quantify furan in a variety of matrices.
The determination of the carcinogenic food processing contaminant furan by headspace sampling of foods is challenging because it can easily escape from the sample during preparation. Furan can also be easily formed as a by-product when the sample is heated in the headspace apparatus. This article describes a number of approaches to overcome these difficulties and alternative methods to quantify furan in a variety of matrices.
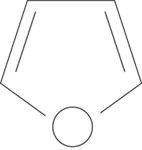
Furan is a small, highly volatile compound (Figure 1) formed in a wide range of foods when they are heated during manufacturing and, in some instances, during domestic cooking. It was previously used as a solvent in industry but has been classified by the International Agency for Research on Cancer (IARC) as "possibly carcinogenic to humans". Several formation pathways have been proposed from precursors which are common natural food ingredients. It is therefore difficult to eliminate or reduce its formation.

Furan in Food
The presence of furan in foods was confirmed in the 1960s after it was detected in a wide range of products, including canned cooked meat, hydrolysed proteins, bread and coffee.1 Modern interest in dietary furan was stimulated after it was discovered in some foods that had undergone irradiation for preservation purposes.
This prompted the US Food and Drug Administration (US FDA) to survey the furan content of certain foods. Food sold in cans and jars was initially targeted because any furan formed during manufacturing was less likely to have been lost through evaporation. The samples were mainly baby foods, infant formulae, canned vegetables, packaged fruits and sauce mixtures and most had been heat treated. The results revealed that many foods contained furan at levels up to about 100 μg/kg.2 Starchy foods, including beans, which had been heated and sold in jars or cans contained the most furan. High levels of furan were also found in roasted coffee, although much of this was lost on brewing.
A survey performed in Switzerland and Germany by the European Food Safety Authority (EFSA) included samples similar to the FDA's investigation.3 This was also targeted at foods that had been heated and sold in cans and jars and the results broadly mirrored the US findings of quite high levels of furan in these products.
Although these surveys covered a limited range of food products that were selected because they were likely to contain furan the data caused concern, particularly for processed baby foods which can form a major part of a baby's diet. Further studies into the effects of cooking found that normal domestic cooking does not increase furan levels in foods and that it is lost rapidly from brewed coffee.

Figure 1: Chemical structure of Furan.
The surveys described used headspace gas chromatography mass spectrometry (HS–GC–MS) to detect furan. Most of the analytical results were published before the initial methods had been optimized and validated because of the urgency for preliminary data. However, as the principles of HS–GC–MS were well established, acceptable detection limits of about 2 μg/kg were achieved for most food matrices. Even so, to date the methods have only been validated in-house4 and there has been limited proficiency testing of similar methods. In a test organized by the Food Analysis Performance Assessment Scheme (FAPAS) 11 of 14 participants achieved a satisfactory score for analysis of a single baby food test material with an assigned value of 25 μg/kg furan.5
During the 1960s furan was detected in foods by an established method for volatiles based on purging and trapping headspace volatiles using cold traps or devices, such as the Likens-Nickerson apparatus where the sample is co-distilled in steam from a large volume of water into a very small volume of a volatile organic solvent. This technique provides a clean and relatively concentrated extract.
These techniques were applied to foods to identify compounds responsible for flavour and the products of Maillard browning reactions. Most early studies failed to spot the inevitable presence of furan in heated foods because its volatility meant it was lost by evaporation when the solvent was evaporated at the concentration stage, or when the furan peak was unresolved from the solvent front.
Sample Preparation
The volatility of furan indicates that headspace sampling is the best approach for analysis. The sample (1–10 g) is placed into a vial (10–20 mL) sealed with a polytetrafluoroethylene (PTFE)–faced septum. The vial is heated to drive volatiles (including furan) into the headspace gas. A portion of the gas is transferred to the GC column. The transfer may be accomplished by a heated syringe or a transfer line, or the analyte can be trapped on to an absorbent material on a fibre in a solid-phase microextraction (SPME) system. All of these methods can be automated and, therefore, a substantial number of samples can be analysed in a day with very few manipulations of the sample or apparatus.
The determination of furan is difficult because of its ease of formation and volatility. It is essential that foods are blended to a homogenous state before sampling for analysis to ensure that a representative portion of the sample is analysed. This process generates some heat and increases the surface area available for evaporation. Homogenization is less of a problem for liquid foods but complex samples, such as complete ready meals, need very careful treatment.
A suitable way to do this is to chill the product to 4 °C or below and then perform preliminary homogenization using a domestic kitchen or laboratory blender fitted with a cutting blade and operated for 1–2 min at high speed. The final homogenization step (or a single treatment for finer samples) is best performed using a high-speed laboratory homogenizer with a top-driven shaft, which allows the sample to be kept in an ice bath. Even though an ice bath is used, the blending time should be kept to a minimum to reduce losses to the atmosphere and avoid heat generation by the cutting blades. It is feasible to add a measured proportion of cold water to the sample at this stage to aid mobility. Other procedures such as cryomilling or hand grinding of frozen samples, are viable (but labour-intensive) alternatives.
Headspace Sampling
The blended or liquid sample can be weighed directly into a headspace autosampler vial. It is essential that the sample is fluid in the vial or repeatable equilibration of furan between the sample and headspace will not be possible. To achieve this, chilled water can be blended with the sample at the homogenization stage or added independently directly to the headspace vial. Internal standard (IS) and spiking solutions should be added directly to the headspace vial.
Modern automated headspace samplers usually have mechanisms for shaking the vial during the incubation period, but the mixing of standards and equilibration of the partitioning of furan between food sample and the headspace in the vial can be improved by using a laboratory bench top roller or shaker. If these are not available equilibration can be improved by prolonging the incubation time or by adding glass beads to the headspace vial to agitate the sample during shaking.
Partitioning of analytes for headspace sampling can be increased by raising the incubation temperature, and for many analytes it is typical to use a temperatures of about 80 °C. However, it is now well established that furan can be formed in many foods during headspace incubation at this temperature. Raising the incubation temperature from 60–80 °C has been shown to increase the furan formed in a range of foods substantially.6,11
The FDA has recently confirmed that low level furan formation can occur in a few relatively high fat foods equilibrated in an 80 °C oven for 30 min,7 and the FDA method has been revised to reduce the oven temperature to 60 °C to reduce any furan formation during analysis.
Compensation for a low-level "background" of furan formed in this way can be had by using calibration standards prepared in the same foodstuff but for convenience it is usually adequate to work with incubation temperatures at or below 50 °C.
Sufficient incubation time is required to reach equilibrium and in any headspace sampling procedure it is sensible practice to compare the effect of using a range of incubation times (e.g., 10–60 min) at different temperatures. The furan response should increase with time to a plateau, shortly after which the routine sampling can be performed. This usually takes about 20 minutes.
Another technique to influence partitioning is to add salt to the sample to decreases the solubility of organic materials. Ammonium sulphate is a popular choice. This can cause a large increase in the furan signal, but in practice the high sensitivity of modern instruments means that such techniques are not required for routine surveys for furan.
Sampling of the headspace can be performed using a heated syringe; a system of valves to trap a volume of the headspace gas inside a sample loop; or solid-phase microextraction (SPME) in which the volatiles are absorbed by a coated fibre and inserted into the vial and then desorbed in the GC injector. All of these systems are usually automated.
SPME is particularly popular for furan analysis because the fibre can be left in the headspace vial to absorb the analyte over a period of time. In this way a relatively large quantity of furan can be absorbed, with less requirement to heat the sample as a slower rate of partition is acceptable.
A number of fibre coatings are available but those based on carboxen-polydimethylsiloxane (PDMS) are successful for furan analysis.8 Extraction times of 10–20 min and desorption times of about 1–3 min are typical. Cryofocussing is particularly useful for SPME because of the slow desorption process.
The high volatility of furan means that care must be taken to avoid losses during sample and standard preparation. Also, samples must be stored away from standards and laboratory chemicals. As neat furan and concentrated standards are difficult to dispense with pipettes, stock standards must be prepared gravimetrically. To achieve this, septum-sealed vials are almost filled with a solvent, usually methanol, and weighed. A small volume of furan of the approximate weight required is added with a gas-tight syringe and the vials are then re-weighed and the exact furan concentration calculated. Subsequent serial dilutions can be made into water provided the furan concentration is not too high.
Gas Chromatography Mass Spectroscopy
Chromatographic systems used to analyse furans have mostly employed the HP PLOT Q column phase (Agilent Technologies, Santa Clara, California, USA) specified in the original FDA method. This is a bonded porous-polymer phase based on polystyrene and divinylbenzene, which is relatively inert and stable to water.9 Equivalent columns such as CP PoraBOND Q, (Varian Inc., Palo Alto, California, USA) or wax-based columns can also be used, with "standard" oven temperature programmes running from about 50–220 °C at 10 °C/min.
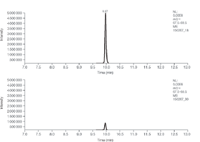
A chromatogram showing the typical response to furan in a canned baby food sample before and after warming for consumption is shown in Figure 2.

Figure 2: Chromatogram of furan in canned carrot-based baby food (a) before heating (20 ug/kg furan) and (b) after saucepan warming (3 ug/kg furan).
Quantification
The mass spectrum of furan has a relatively intense molecular ion with a mass-to-charge ratio (m/z) of 68, but for selected ion confirmation the fragment ion at a m/z of 39 provides the only additional mass of sufficient abundance. The lower abundance of the ion with a m/z of 39 effectively sets the limit of quantification for furan in samples free of interfering signals.
Standard addition and external calibration are equally favoured for the quantification of furan. In the former, specified in the FDA method, the approximate level of furan in the sample is measured and a series of samples are prepared spiked with furan over a range that extends from below and above the approximate level. A calibration plot line of response against added furan intersects the x–axis at the actual level in the sample. When many sample analyses are required for this technique the number of standard addition samples has frequently been reduced below the number specified by the FDA for practical purposes.
For external calibration a series of standards are prepared in water or a furan-free matrix similar to the food sample and a graph of response versus furan concentration is prepared to calculate the amount of furan in the sample. Furan has also been quantified by comparing the response for furan against that of the IS.10 This approach is suitable where the relative response ratios have been verified and the furan level in the sample is similar in magnitude to that of the standard. It is a very useful way to check results obtained through calibration graphs or standard additions.
Deuterium-labelled ISs are now used routinely in furan quantitative analyses although deuterium-labelled acetone has also been used.11 Fully deuterated (d4-) furan placed in the headspace vial and equilibrated fully with the sample mimics the behaviour of the native furan and can be detected by monitoring the response for its molecular ion at a m/z of 72. The PLOTQ column will not separate d0-from d4-furan under all conditions and in this instance it should be confirmed that the [M-D2]+fragment ion does not contribute to the response for furan at the m/z 68 signal.
To confirm the identity of the furan peak the standard procedures of comparing retention times and the relative responses for different ions with those of authentic standards are used. The ions at m/z of 39 and a m/z of 68 provide the only signals suitable for this and their ratio should agree with the average of the response ratios for calibration standards by ±10%. The retention time for the test samples should agree with the average of those of the calibration standards by ±2%.
Recoveries from foods are generally better than 90% with limits of detection (LOD) calculated from a 3:1 signal-to-noise ratio (S/N) of calibration standards typically about 0.3 ng/g. For food surveys reliable data can usually be reported at a limit of 2.0–5.0 ng/g. Measurement uncertainty calculations naturally show a wider variation than many trace analyses because of the handling problems discussed.
Colin Crews and Laurence Castle, Defra Central Science Laboratory, York, UK.
References
1. J.A. Maga, Critical Reviews in Food Science and Nutrition, 4, 355–400 (1979).
2. http://www.cfsan.fda.gov/~dms/furandat.html
3. European Food Safety Authority (EFSA), EFSA Journal 137, 1–20 (2004).
4. P.J. Nyman et al., Journal of AOAC International, 89(5) 1417–1424 (2006).
5. FAPAS Proficiency test 3012. www.fapas.com (2005).
6. S. Hasnip, C. Crews and L. Castle, Food Additives and Contaminants, 23(3) 219–227 (2006).
7. http://www.cfsan.fda.gov/~dms/furan2.html
8. T. Goldmann et al., Analyst, 130(6) 878–883 (2005).
9. Z.H. Ji, R.E. Majors and E.J. Guthrie, Journal of Chromatography A, 842, 115–142 (1999).
10. K. Hoenicke, R. Gatermann and S. Weidemann, Czech Journal of Food Science, 22, (Special Issue) 357–358 (2004).
11. H.Z. Senyuva and V. Gökmen, Food Additives and Contaminants, 22(12) 1198–1202. (2005).
Analytical Challenges in Measuring Migration from Food Contact Materials
November 2nd 2015Food contact materials contain low molecular weight additives and processing aids which can migrate into foods leading to trace levels of contamination. Food safety is ensured through regulations, comprising compositional controls and migration limits, which present a significant analytical challenge to the food industry to ensure compliance and demonstrate due diligence. Of the various analytical approaches, LC-MS/MS has proved to be an essential tool in monitoring migration of target compounds into foods, and more sophisticated approaches such as LC-high resolution MS (Orbitrap) are being increasingly used for untargeted analysis to monitor non-intentionally added substances. This podcast will provide an overview to this area, illustrated with various applications showing current approaches being employed.
Study Explores Thin-Film Extraction of Biogenic Amines via HPLC-MS/MS
March 27th 2025Scientists from Tabriz University and the University of Tabriz explored cellulose acetate-UiO-66-COOH as an affordable coating sorbent for thin film extraction of biogenic amines from cheese and alcohol-free beverages using HPLC-MS/MS.
Multi-Step Preparative LC–MS Workflow for Peptide Purification
March 21st 2025This article introduces a multi-step preparative purification workflow for synthetic peptides using liquid chromatography–mass spectrometry (LC–MS). The process involves optimizing separation conditions, scaling-up, fractionating, and confirming purity and recovery, using a single LC–MS system. High purity and recovery rates for synthetic peptides such as parathormone (PTH) are achieved. The method allows efficient purification and accurate confirmation of peptide synthesis and is suitable for handling complex preparative purification tasks.


