Calibration Curves, Part 2: What are the Limits?
LCGC Asia Pacific
John Dolan looks at the signal-to-noise ratio and its relationship to uncertainty in a measurment.
John W. Dolan, LC Resources, Walnut Creek, California, USA.
How are the signal-to-noise ratio and imprecision related?
This is the second instalment in a series of "LC Troubleshooting" articles on calibration curves for liquid chromatography (LC) separations. Part 1 of the column looked briefly at single-point, two-point and multipoint calibration curves.1 Then the multipoint calibration curve was used to illustrate the importance of deciding whether or not to force the curve through the origin (x = 0, y = 0). This month we will look at the signal-to-noise ratio and its relationship to uncertainty in a measurement. We will use this information as a tool to set the lower limits for a method. Next month, we will look at some additional ways to evaluate calibration curves.

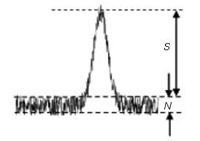
Figure 1: Measurement of signal, S, and noise, N from a chromatogram.
Signal-to-Noise and %-Error
Before we look at method limits, we need to examine the signal-to-noise ratio (S/N) and how it relates to %-error — this is the basis of the lower limits for a method. S/N is determined as shown in Figure 1. If measured manually, print an expanded chromatogram or work with an expanded version on the computer monitor, then draw horizontal lines at the bottom and top edges of the baseline that bracket most of the noise; the distance between these is the noise (0.18 units in Figure 1; the measurement units are unimportant, because they cancel). The signal is the distance from the middle of the baseline noise to the top of the peak (1.14 units in Figure 1). S/N is simply the ratio of these two values (1.14/0.18 = 6.3). The data system might be able to measure the noise automatically by averaging the noise over a selected time, using a root-mean-square (RMS) algorithm. The signal is the peak height (be sure to use the same units of measurement for both signal and noise). Noise, of course, is superimposed on the signal at the top of the peak, so picking the magnitude of the signal is somewhat uncertain, which adds error to the measurement. As the peak gets larger, the errors contributed by measurements at the baseline and the peak top become a smaller proportion of the total, so their contribution to the uncertainty of the reported peak area (or height) becomes smaller. The error contributed by S/N can be estimated by

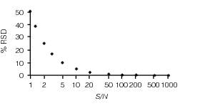
Figure 2: Plot of error (%RSD) vs. signal-to-noise ratio (S/N).
%RSD ≈ 50/(S/N) [1]
Thus, from the data of Figure 1, the percent relative standard deviation (%RSD) is (50/6.3) ≈ 7.9%. We can use Equation 1 to make a plot of %RSD versus S/N, as in Figure 2, where the error in the measurement (%RSD) is negligible at large ratios of S/N and grows larger with diminishing S/N. One way to define trace analysis is that it encompasses analyte concentrations at which the overall method error is affected by S/N. When S/N exceeds 50–100, its RSD will be <1%, which is negligible in most methods, so methods with S/N < 100 might be considered trace analysis. The lower limits of the method are in this region of trace analysis, so S/N can be an important factor in the overall method error.
Each source of error x in a method accumulates as the sum of the variances x2:
ET = (E12 + E22 +...+ En2 )0.5 [2]
where ET is the total error and E1, E2...En are the contributions of error from each source, 1, 2...n. For example, E1 might be the error due to sample preparation, E2 the error due to the autosampler, E3 the error due to signal-to-noise (Equation 1) and so forth. As a general rule, if there are multiple sources of error and the %RSD of a single error source is less than half the total RSD, its contribution to total RSD will be less than 15%. The largest error source in Equation 2 will dominate the result, so to reduce the total error, the largest source of error (often S/N at the lower limits of a method) should be reduced first. If a single source of error is larger than the acceptable total error, the desired total error will not be reached until this source is reduced. This means that we want S/N to be small enough that it is not a dominant factor in the overall method error, as calculated by Equation 2. Equation 2 gives us a tool to examine the effect of S/N on the overall method error.
Let's look at two types of pharmaceutical methods, a high-precision method to measure the content of a drug substance (the chemical itself) or potency of a drug product (the formulated drug) and a low-precision bioanalytical method to measure the drug in plasma. The first method type typically has a requirement that imprecision is no larger than ±2% RSD, whereas the latter will tolerate ±20% variability at the lower limit of quantification (LLOQ). For a high-precision method, we generally like to develop the method so that the imprecision for the validated method is less than the requirement, so there is some tolerance for additional errors if unexpected changes take place in time. This might lead us to establish a target of ±1% RSD for the high-precision method. If we want S/N to contribute less than 15% of this overall error, it must be no more than half of this, or ≤0.5% RSD. Rearranging Equation 1 to
S/N ≈ 50/%RSD [3]
allows us to determine that S/N must be at least (50/0.5) ≈ 100. This is why, for high-precision methods, we want to have large peaks and smooth baselines — to keep the S/N contribution to overall error low. With a bioanalytical method, we can go through the same logic and come up with a target that for S/N to contribute less than 10% RSD, S/N > 5 (= 50/10) is required. A S/N value of 10 is commonly used for the LLOQ (see additional discussion in the following section), so this would mean 5% RSD contributed by S/N. Bioanalytical methods also have substantial error in sample preparation that add in to the total, as in Equation 2.
Limit of Detection
Next let's turn our attention to the limit of detection (LOD) and lower limit of quantification (LLOQ, also called the limit of quantification, or just lower limit). The LOD is the smallest concentration at which you can state confidently that an analyte is present. The International Committee on Harmonization (ICH) lists three methods to determine the LOD:2
- visual evaluation
- signal-to-noise
- standard deviation of the response and the slope
Visual evaluation: Establishing the LOD just by looking at the chromatogram ("Yes, I am pretty sure that there is a peak present.") is highly subject to operator bias, even if unintended. This is not a quantitative technique and I do not recommend using it except for making a decision about what concentration to examine more closely using one of the other two techniques.
Signal-to-noise: A value of S/N = 3 is commonly used to determine LOD. If S/N alone is used, this technique is also somewhat subject to operator bias, because measuring both the signal and noise might have to be done manually. A better technique is to turn the S/N technique into a statistical technique with the help of Equation 1. According to Equation 1, ≈ 17% RSD (= 50/3) should be observed at S/N = 3. Now we can pick a candidate concentration for the LOD by using a visual guess or measuring S/N = 3 for a peak. Next, we inject a sufficient number of replicate injections (five or six is sufficient) to calculate the %RSD of the peak area. If RSD ≈ 17%, this confirms the LOD.
Standard deviation of the response and the slope: This technique relies on the overall performance of the calibration curve, not just the response at one concentration, to estimate the LOD. Equation 4 is listed in reference 2:
LOD = (3.3σ)/S' [4]
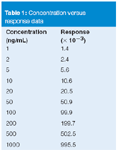
where σ is the standard deviation for a calibration curve and S' is its slope (for example, unit response per ng/mL of concentration). The tables from last month's example are repeated as Tables 1 and 2.1 Table 1 contains the data for a calibration curve covering analyte concentrations of 1–1000 ng/mL. Table 2 is a portion of the linear regression results produced by Excel for these data. For Equation 4, we set the standard error (SE) of the y-intercept equal to σ (see last month's article for justification of using this instead of SE for the entire curve). The X-variable (slope) of Table 2 is set equal to S'. Thus, for these data, LOD = (3.3 × 0.5244)/0.9963 = 1.74 ng/mL. For convenience, this would probably be rounded to 1.75 or 2.0 ng/mL. Then five or six injections would be made at this concentration to confirm that RSD ≤ 17%, as expected at the LOD.

Table 1: Concentration versus response data
Lower Limit of Quantification
The LLOQ is the concentration at which you can confidently report an analyte concentration for a sample, with a defined amount of error. The ICH lists the same three techniques used for the LOD to determine the LLOQ.2 I can't figure out a way to use the visual approach for quantitative purposes, so it should be limited to making an estimate of the LLOQ that can be tested by one of the other techniques.

Table 2: Regression statistics from Excel.
The signal-to-noise technique is the same for both the LOD and LLOQ, except a value of S/N = 10 is chosen for the LLOQ. This translates into a RSD of (50/10) = 5%.
The standard deviation and slope technique uses Equation 5:
LLOQ = (10σ)/S' [5]
With the data of Table 2, we can estimate the LLOQ as (10 × 0.5244)/0.9963 = 5.26 ng/mL. Samples can be formulated at this concentration and tested for RSD ≤ 5%.
Potential Problems
It is important to set the LOD and LLOQ properly during method validation. A method that has a LOD or LLOQ that barely reaches the required performance specifications during validation is bound to have problems when it is put into routine use. For this reason, it is essential to test the method rigorously at the lower limits to ensure that the proper values were chosen. One trick that can help to rescue a method that does degrade is to do sufficient testing during validation so that alternate LOD and LLOQ values can be used later. For example, if the LOD of a method is 5 ng/mL and the LLOQ is 15 ng/mL, also test 10 and 20 ng/mL samples for performance during validation. If you have these concentrations validated, and you have problems later in the application of the method, it might be possible to raise the LOD and LLOQ without further experimentation. Of course, the method or a standard operating procedure (SOP) should be written to allow this change.
There might be alternative ways to reach the LOD or LLOQ for a method that does not perform as desired at these low concentrations. For example, a larger injection or injection of a more concentrated sample will increase the amount of analyte on the column and, thus, the detector signal. It is possible to increase the signal in this manner without increasing the noise, so that a S/N value with less variability can be attained. Another option is to reduce the noise by judicious use of the detector time constant or data system sampling rate. Both of these provide signal averaging, or smoothing, which can give smoother baselines without loss in signal intensity. If improperly set, time constants and data rates can degrade the signal by allowing too much noise in the data or loss of signal from excessive smoothing. Because the low concentration calibrators and samples generally have a disproportionate number of problems — interferences, poor integration, excessive variability and so forth — you want to make sure that the method is as robust as possible for low-concentration samples.
It can be understood from the previous discussion that the signal-to-noise ratio and the uncertainty (error) of measuring a chromatographic peak are closely related. Thus, we can use either S/N or %RSD to determine the LOD and LLOQ for a method. Thus, S/N = 3 or RSD ≈ 17% can be used for LOD, and S/N = 10 or RSD ≈ 5% can be used for LLOQ. Note that S/N is based upon the width of the baseline noise plus the height of the peak, as in Figure 1, but the %RSD is more typically measured based upon the peak area. It must be remembered that any estimate of the method limits are just that — merely estimates. To confirm the limits, a sufficient number of replicate injections must be made to confirm that the %RSD requirements are met; usually five or six measurements are sufficient for this purpose. If the method includes other significant sources of error, such as sample preparation for bioanalytical methods, replicate preparations of a homogeneous, spiked sample should be made to confirm that the entire method meets the requirements for method precision at the lower limits.
"LC Troubleshooting" editor John W. Dolan is vice president of LC Resources, Walnut Creek, California, USA; and a member of the Editorial Advisory Board of LCGC Asia Pacific. Direct correspondence about this column to "LC Troubleshooting", LCGC Asia Pacific, Park West, Sealand Road, Chester CH1 4RN, UK.
References
1. J.W. Dolan, LCGC Eur., 22(4), 190–194 (2009).
2. Validation of Analytical Procedures: Text and Methodology Q2(R1), International Conference on Harmonization, Nov. 2005, http://www.ich.org/LOB/media/MEDIA417.pdf.

Common Challenges in Nitrosamine Analysis: An LCGC International Peer Exchange
April 15th 2025A recent roundtable discussion featuring Aloka Srinivasan of Raaha, Mayank Bhanti of the United States Pharmacopeia (USP), and Amber Burch of Purisys discussed the challenges surrounding nitrosamine analysis in pharmaceuticals.
Extracting Estrogenic Hormones Using Rotating Disk and Modified Clays
April 14th 2025University of Caldas and University of Chile researchers extracted estrogenic hormones from wastewater samples using rotating disk sorption extraction. After extraction, the concentrated analytes were measured using liquid chromatography coupled with photodiode array detection (HPLC-PDA).


