Authentication of Panax Ginseng‑Based Herbal Teas Using “Chemical Markers” Strategy
This article describes the method development involved in the authentication of nutraceuticals, particularly those containing Panax ginseng, which is popular because of possible positive effects on human health. For this purpose, an analytical strategy based on a metabolomic approach was chosen. The aqueous methanolic extracts were analyzed using ultrahigh-performance liquid chromatography coupled to high-resolution mass spectrometry (UHPLC–HRMS). Generated data were processed by advanced statistical methods that enabled the specific markers for Panax ginseng and other plants that can be used for its adulteration (Gynostemma pentaphyllum, Withania somnifera, Eleutherococcus senticosus) to be found. The developed method is primarily intended for verifying the presence of Panax ginseng and its adulterants in Panax ginseng-based herbal teas.
Ginseng is a common name for medicinal plant species representing mainly Araliaceae genera Panax L. and Eleutherococcus Maxim. They are found in the Northern Hemisphere and East Asian countries, with China and Korea being the key producers (1). Currently, 13 ginseng species have been recognized, however, new taxa of species, subspecies, and variety levels are continuously reported (2,3). P. ginseng together with P. quinquefolium and P. notoginseng are the dominating species used in herbal medicine (4–6). The major therapeutic effects of ginseng are associated with unique secondary metabolites, ginsenosides. More than 30 compounds of this group have been identified, with the highest quantities occuring in the root (1,7). Regarding ginseng quality and its curative properties, cultivar, locality, growth conditions (cultivated vs. harvested from the wild), and plant age (roots from older plants are more valuable) are the most important factors for product value (6). Huge price differences exist among the main Panax processed varieties, and so it is not surprising that ginseng-based products are prone to economically driven fraud. As has been confirmed by the recent review on literature reports of 507 ginseng‑containing commercial herbal products from different countries worldwide (6), the adulteration rate is as high as 24% (both botanical and chemical identity tested).
It is worth noting that authentication of ginseng-labelled food supplements, extracts, and other products is a fairly challenging task. This is mainly due to the diversity of Panax varieties and the means of their processing (1,3). Most of the authentication strategies are based on the analysis of ginsenosides patterns in the respective sample (4,5,8,9). Target analysis/screening employing liquid chromatography coupled to mass spectrometry (LC–MS) is commonly employed for this purpose (4,8–10); alternatively, the use of nuclear magnetic resonance (NMR) has been reported (11,12), along with molecular biology method options (2,13–16).
As well as the use of low-grade material from the above-ground parts or processing waste, substitution by alternative plant species is a common fraudulent practice. This article documents the potential of metabolomic fingerprinting employing ultrahigh‑performance liquid chromatography coupled with tandem high-resolution mass spectrometry (UHPLC–HRMS/MS) to detect plant adulterants other than the Panax genus, but with similar biologically active compounds. In this particular case, the authentication, contrary to other studies, was not based on ginsenosides profiling only, but on the assessment of the entire fingerprint metabolome.
Materials and Methods
Chemicals: Methanol was of HPLC-grade and obtained from Honeywell. The other chemicals were of analytical-grade. Formic acid was supplied by VWR Chemicals, leucine-encephalin and ammonium formate from Merck. Deionized water was obtained from a Milli Q purification system supplied by Millipore.
Samples: Samples of dried root of P. ginseng (n = 2), the extract of the root of P. ginseng (n = 1), leaves and stem of Gynostemma pentaphyllum (n = 3), samples of dried Eleutherococcus senticosus (n = 4), and samples of dried Withania somnifera (n = 3) were analyzed. Panax notoginseng was also analyzed but only one sample was available, so this sample was used for verification of the specificity of markers. For this purpose, the frequently used ingredients of herbal teas like green tea, ginger, peppermint, lemongrass, rooibos, orange peel, lemon balm, cinnamon, clove, cardamom, black pepper, and dead nettle were also analyzed. Two samples of each ingredient were available. All the analyzed samples were purchased at the Czech market from certified suppliers, except for the P. ginseng root extract. This sample came directly from Korea and is an authentic sample.
Sample Preparation: The samples were homogenized in the grinder Grindomix GM 200 (Retsch GmbH), and then were weighed (0.5 g) in 15-mL polypropylene tubes. The extraction solvent, 5 mL of 4:1 (v/v) methanol–water mixture, was added to the tube, shaken for 10 min on an automatic shaker (240 oscillations per min), and then was centrifuged (5 min, 5 °C, 10,000 rpm). The supernatant was collected using a 5-mL plastic syringe and filtered through a 0.22-µm filter. An aliquot of the filtrate was transferred to a 2-mL vial and prepared for UHPLC–HRMS/MS analysis. All samples were prepared in duplicates. The quality control (QC) sample was a combined aliquot of samples and was analyzed at the beginning of the sequence, and always after a set of 10 tested samples to control the stability of instrument conditions. The extraction mixture was also analyzed within the sample sequence to check the absence of carryover effects.
Instrumental Conditions: The chromatographic analysis of sample extracts was performed using an Acquity UPLC system (Waters) on a 100 × 2.1 mm, 1.7-μm Acquity UPLC BEH C18 column (Waters) held at 40 °C. The mobile phase consisted of water with 5 mM ammonium formate and 0.1% formic acid (A) and methanol with 5 mM ammonium formate and 0.1% formic acid (B) with a gradient elution: 0–2 min 95–60% (A); 2–5 min 60–0% (A); 5–10 min 0% (A); 10–13 min 0–95% (A). The sample injection volume was 2 µL for the positive mode and 5 µL for the negative mode of ionization. Mass spectrometric detection was performed using a Synapt G2 MS system (Waters) equipped with an electrospray ionization (ESI) source. In addition to MS1, MS2 was performed to investigate precursor ions and product ions. The resolution was around 20,000 FWHM (full width at half maximum). Positive and negative ion spectra were recorded in the range of m/z 50–1200. The ion source conditions were as follows: capillary voltage, 1.0 kV in positive mode and - 0.7 kV in negative mode; cone voltage, ± 25 V; ESI source temperature, 120 °C; desolvation temperature, 350 °C; desolvation gas flow, 800 L/h. The instrument was tuned using leucine-encephalin (2 ng/µL, 50:50, [v/v] water–methanol with 0.1% formic acid), sodium formate was used for calibration. The LC–MS method was taken from the previous research in this department (17).
Data Processing and Statistical Analysis: The data processing was performed by MarkerLynx XS of MassLynx 4.1 software. This software was employed to pre‑process raw data generated by the UHPLC–HRMS instrument. For the peak detection, the following parameters were applied: m/z range 50–1200; XIC window 0.05 Da; intensity threshold 1000 counts; mass window 0.05; retention time window 0.10; data deisotoping. The resulting data files were exported to the SIMCA software (version 13.0.3, Umetrics). Principal component analysis (PCA) and partial least squares-discriminant analysis (PLS-DA) were used in this software. Before the statistical analysis, Pareto scaling was applied to all datasets. For sorting the marker ions according to their importance, the VIP (variable importance in the projection) plots were used. The ten most important variables with VIP score >1 in a given model were chosen. Ions that were the most significant for the classification of the sample were selected with an S-plot generated by the SIMCA software. For confirmation of ions as the markers, a trend plot was used. The tentative identification of compounds selected as the potential marker ions were based on the calculation of the elemental formula (accurate mass and mass error for respective m/z values in MS1 were considered). To confirm the suggested identification of marker ions, their product ions were investigated in MS/MS spectra, which were obtained by using a collision energy ramp ranging from 10 to 30 V in the positive mode and 40 V in the negative mode of ionization. For compound identification, online databases such as mzCloud (https://www.mzcloud.org/home), Chemspider (http://www.chemspider.com/), PubChem (https://pubchem.ncbi.nlm.nih.gov/), or METLIN (https://metlin.scripps.edu/index.php) were employed.
Results and Discussion
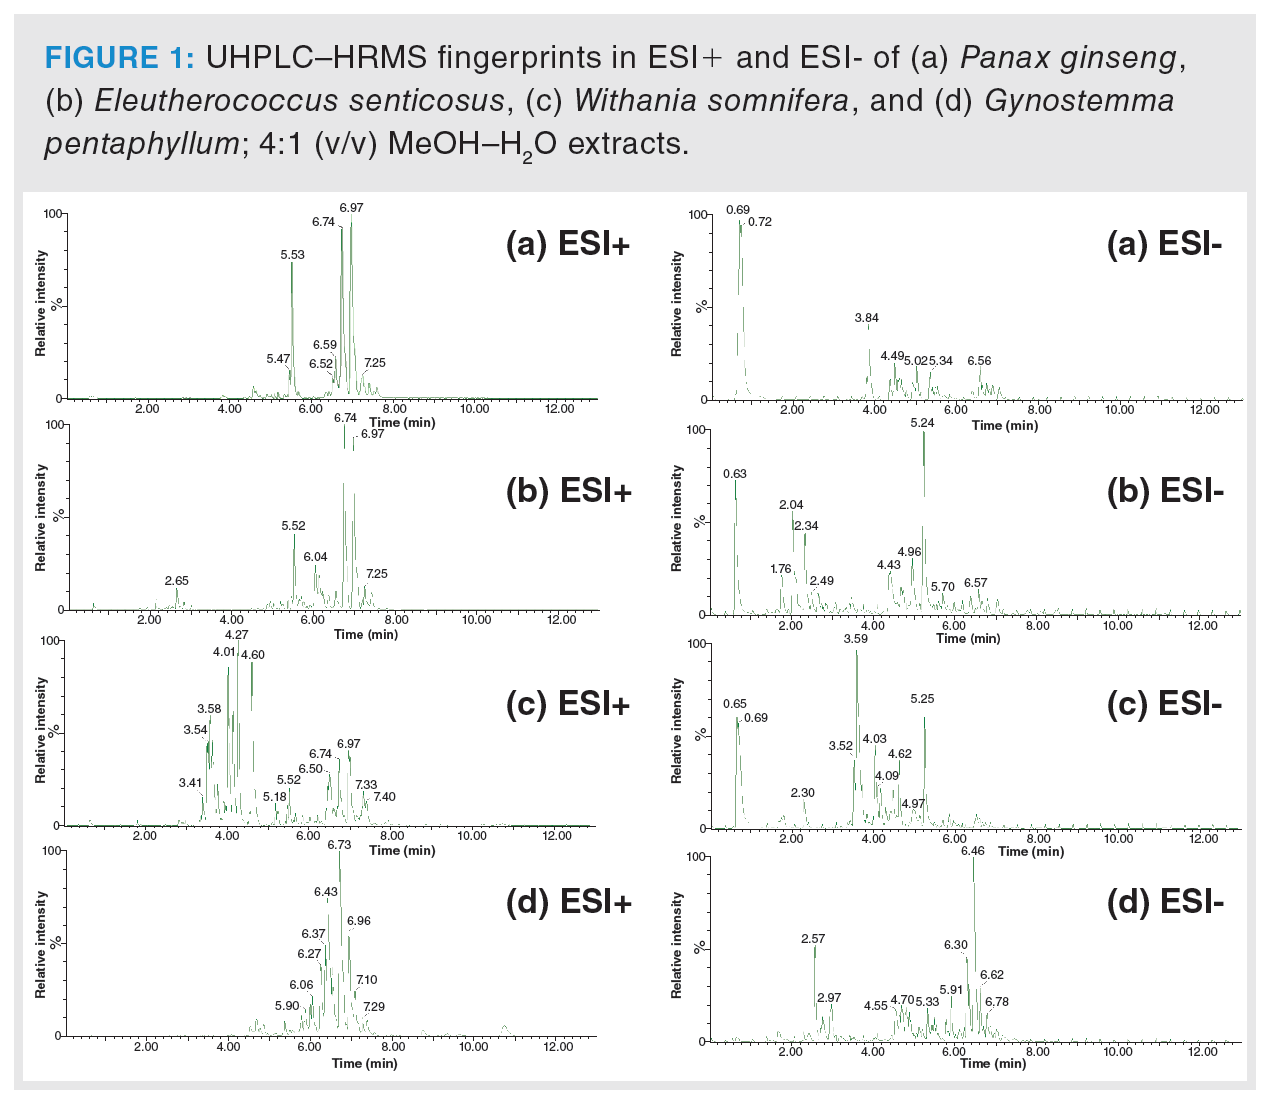
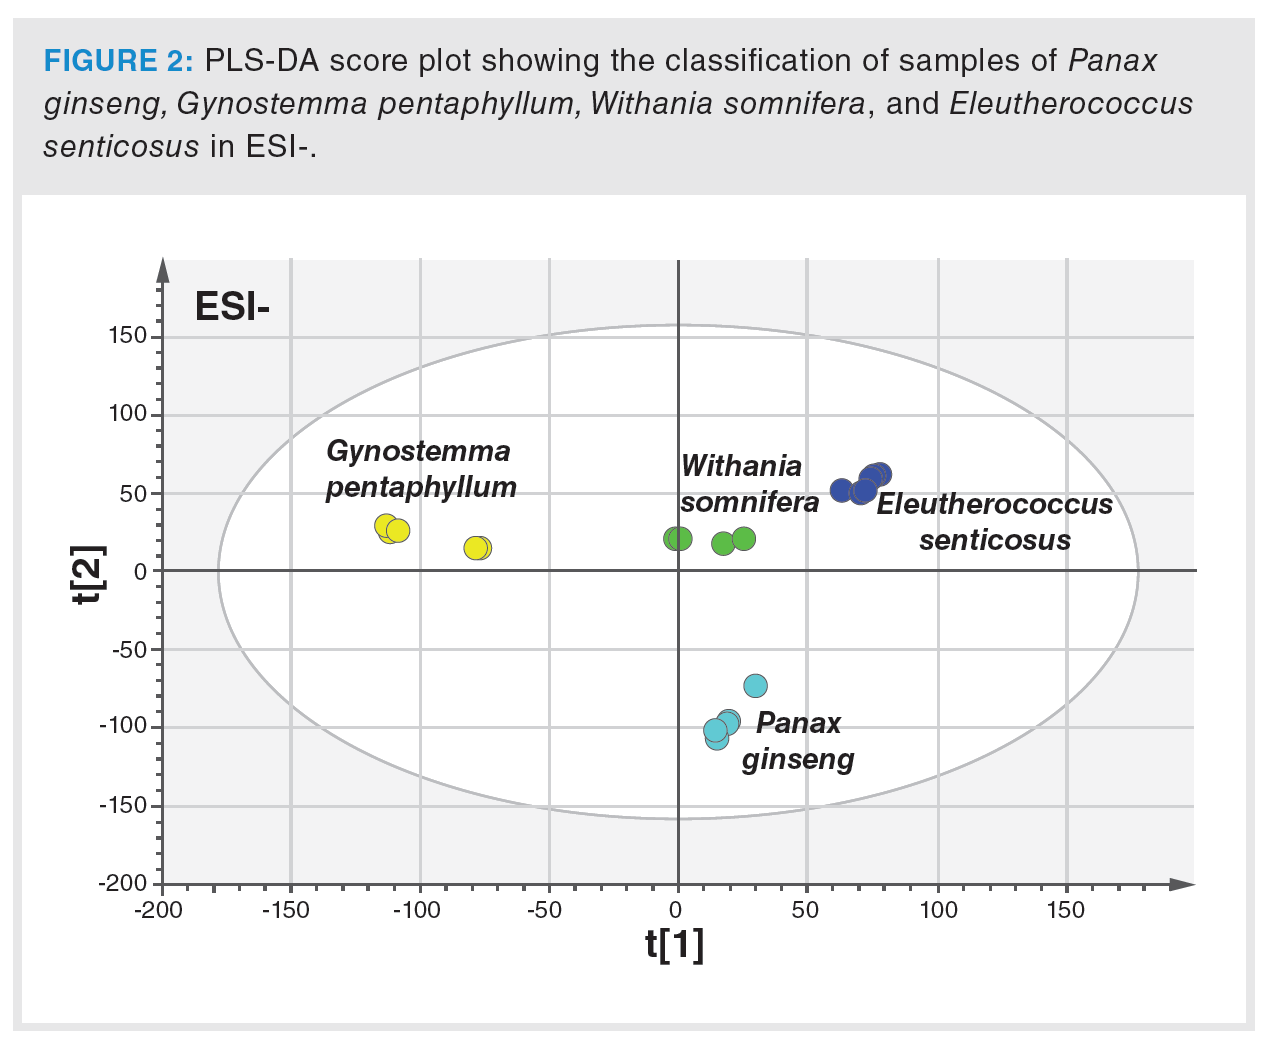
In the first phase, the extraction procedure was optimized to achieve the highest possible representation of metabolites in tested samples. The column used and operated under the conditions described in the Material and Methods section was found to be suitable for sample extracts separation, and the HRMS detector was set for nontarget screening in the range of m/z 50–1200. Figure 1 clearly documents the differences in UHPLC–HRMS fingerprints obtained from the analysis of Panax ginseng, Eleutherococcus senticosus, Withania somnifera, and Gynostemma pentaphyllum extracts, both in the negative and positive ionization mode. The generated data were processed by PCA, an unsupervised statistical tool, to give a first view of the data structure. The PCA score plot showed clustering according to the plant species. In the next step, PLS-DA, a supervised multivariate classification tool, was applied to achieve better visualization of the discrimination of samples. The PLS-DA score plot is presented in Figure 2. Excellent parameters were obtained (recognition ability = 98.5%, prediction ability = 97.2%).
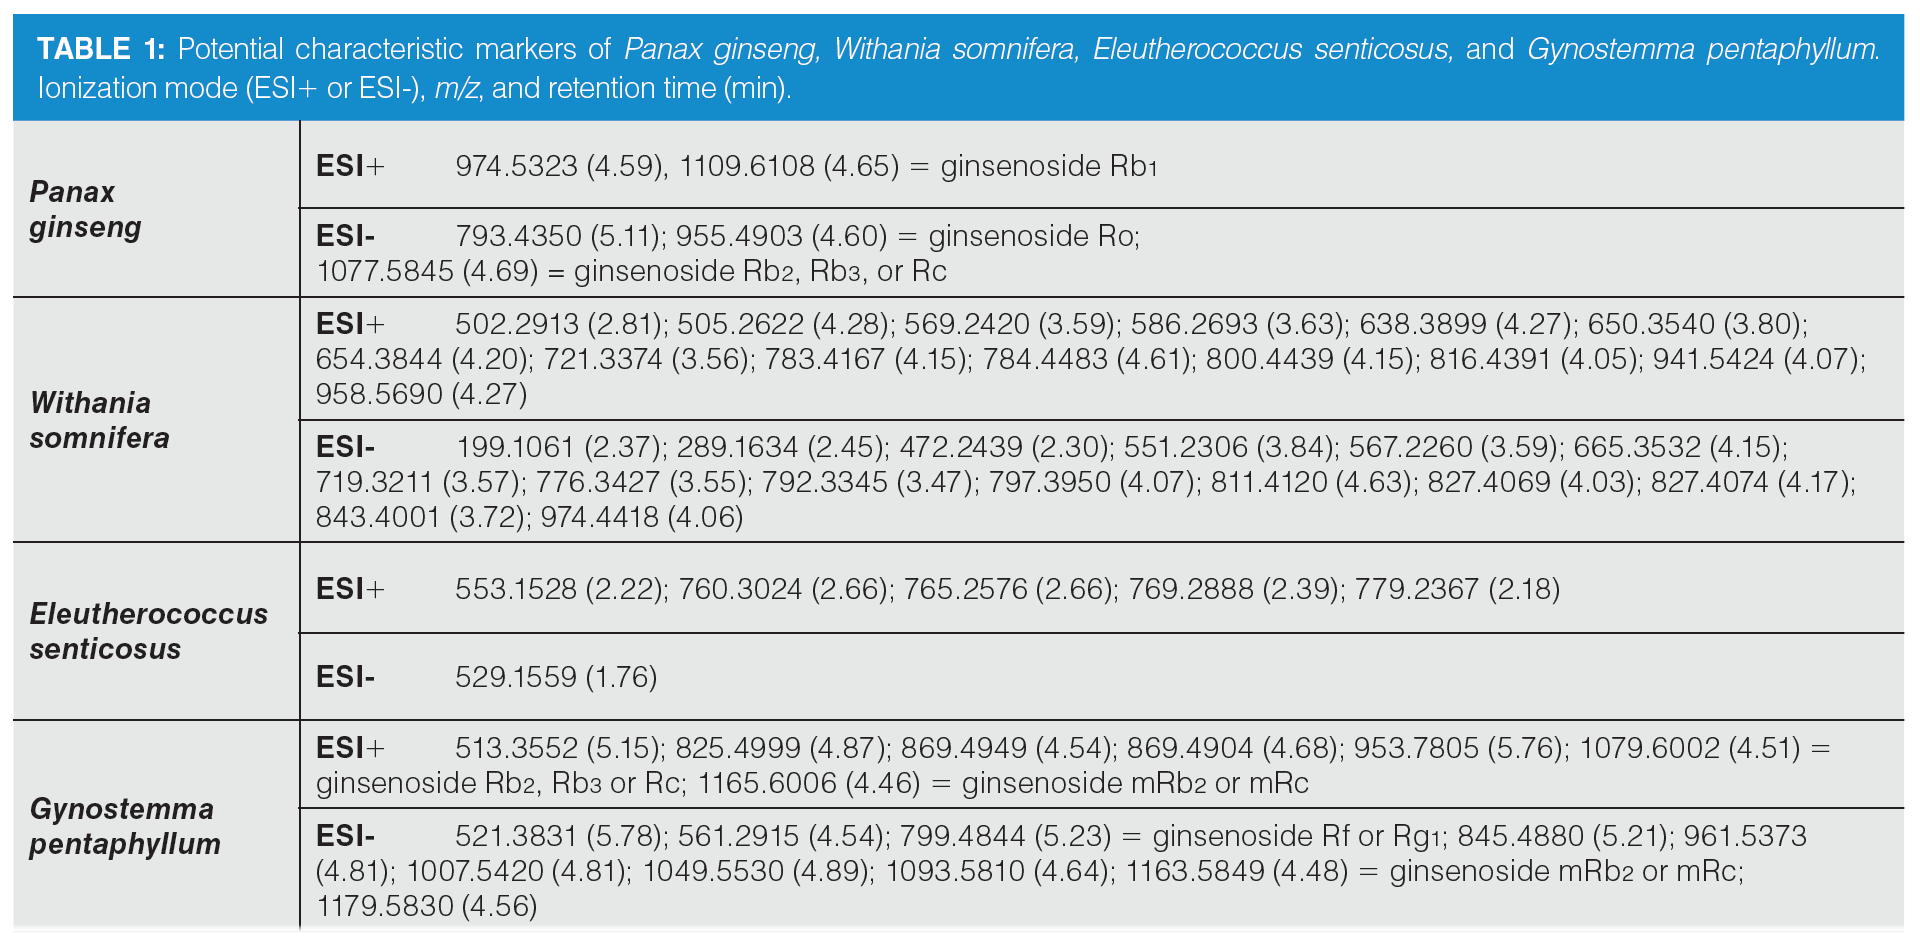
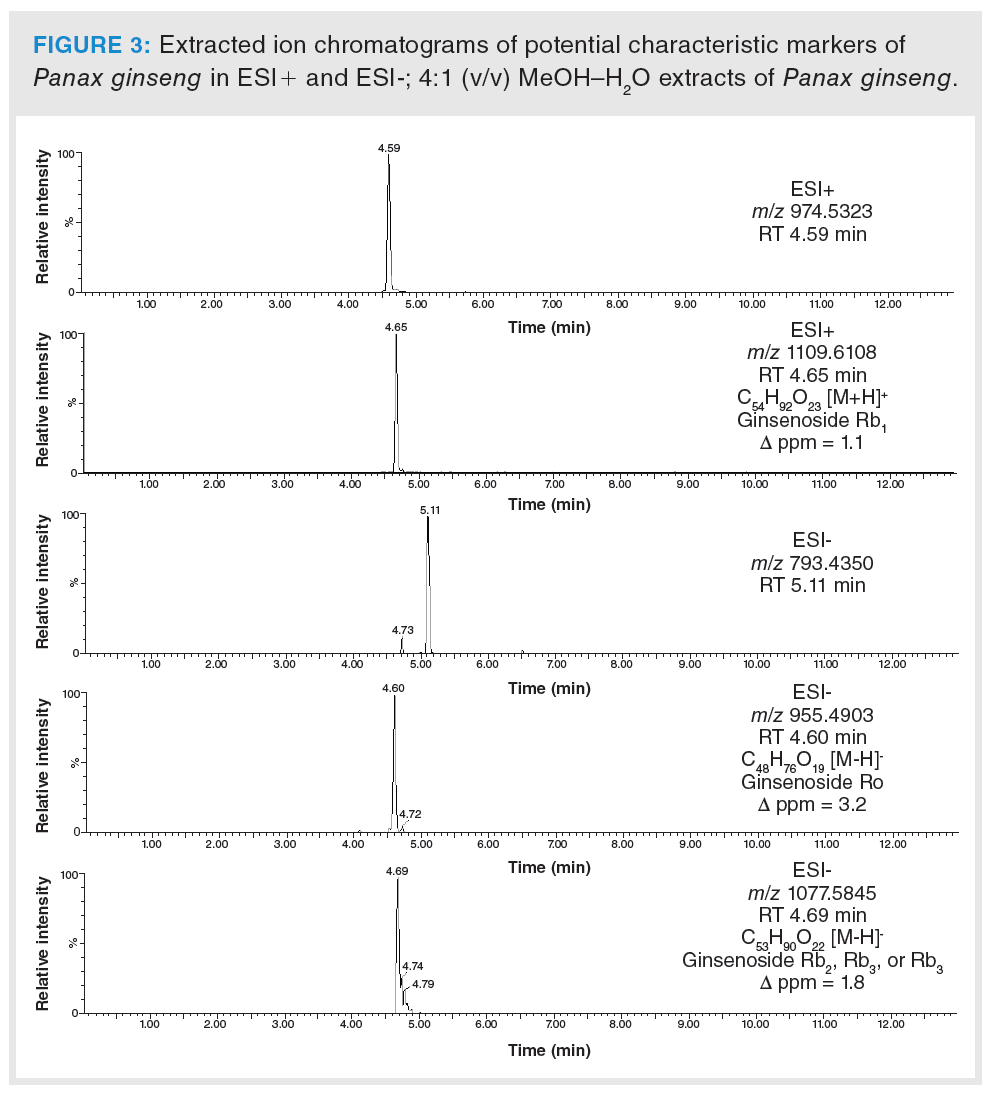
Based on the statistical analysis, possible characteristic marker ions were chosen; specifically, 105 potential unique metabolites of P. ginseng, 120 of W. somnifera, 99 of E. senticosus, and 109 of G. pentaphyllum were found in these individual plant species. However, P. ginseng is a component of herbal teas containing a mixture of different herbs. For this reason, it was necessary to verify the specificity of these “unique” metabolites. All of these compounds were searched in extracts of frequently used ingredients of herbal teas (green tea, ginger, peppermint, lemongrass, rooibos, orange peel, lemon balm, cinnamon, clove, cardamom, black pepper, dead nettle), and also in the extract of Panax notoginseng. Five markers of P. ginseng, 29 markers of W. somnifera, six of E. senticosus, and 17 of G. pentaphyllum were confirmed to be characteristic of ginseng and ginseng-like plant species. The list of potential markers is summarized in Table 1. The extracted ion chromatograms of potential characteristic markers of P. ginseng are shown in Figure 3. Interestingly, a number of other ginsenosides were detected in P. ginseng, nevertheless only three were unique as they were not found in P. notoginseng or other ginseng‑like plant species. The tentative identification of the ginsenosides was based on the estimation/calculation of the elemental formula, accurate mass, isotopic pattern, and mass error for the respective m/z values in MS1. The suggested identification of the ginsenoside was confirmed by MS/MS spectra in online databases. Two P. ginseng unique markers were not possible to identify. No compliance between the measured fragmentation spectra and those in databases was found.
Conclusion
This study has focused on the development of a fast and reliable method for the detection of P. ginseng substitution in products by other plant species. The results are summarized below.
UHPLC–HRMS-based nontarget screening of aqueous methanolic extracts of P. ginseng and its potential adulterants—“ginseng‑like” compounds containing plants represented by W. somnifera, E. senticosus, and G. pentaphyllum—showed differences in metabolomic fingerprints. The number of metabolites (detected as ions thereof), which enable recognition of tested species, was found.
Screening of identified unique metabolites (markers) occurring in the above-mentioned plants but not present in common ingredients of herbal teas allowed the verification of product labelling (declaration of P. ginseng content) or documentation of common adulterants such as W. somnifera, E. senticosus, and/or G. pentaphyllum.
A follow-up study is necessary to identify the minimal amount of W. somnifera, E. senticosus, and G. pentaphyllum that could be documented through the analysis of their potential characteristic markers.
Finally, the developed method will be used to control the declared content of P. ginseng in herbal teas from the Czech market.
Acknowledgement
This work was supported by Metrofood-CZ research infrastructure project (MEYS Grant No: LM2018100) including access to its facilities, and from the grant of specific university research – grant No A1_FPBT_2022_005.
References
- W.E. Court, Med. Aromat. Plants Ind. Profiles 15, 1–249 (2000).
- V. Manzanilla, A. Kool, L. Nhat, et al., BMC Evol. Biol. 18, 1–14 (2018).
- T.K. Yun, J. Korean Med. Sci. 16, 3–5 (2001).
- B. Huang, T. Chen, S. Xiao, et al., R. Soc. Chem. 7, 46839–46851 (2017).
- S. Govindaraghavan, Fitoterapia 121, 64–75 (2017).
- M.C. Ichimand H.J. de Boer, Front Pharmacol. 11, 1–9 (2020).
- M.S. Yangand M.Y. Wu, Nutraceuticals 50, 693–705 (2016).
- T.W.D. Chan, P.P.H. But, S.W. Cheng, et al., Anal. Chem. 72, 1281–1287 (2000).
- J. Moon, H. Jung Han, S. Won Park, et al., Food Sci. Biotechnol. 23, 1433–1440 (2014).
- M. Abashev, E. Stekolshchikova, and A. Stavrianidi, J. Ginseng Res. 45, 246 – 253 (2020).
- J. Kang, S. Lee, S. Kang, et al., Arch. Pharmacal Res. 31, 330–336 (2008).
- H.T. Nguyen, D.K. Lee, Y.G. Choi, et al., J. Pharm. Biomed. Anal. 124, 120–128 (2016).
- G. Li, Y. Chen, R. Wang, et al., J. Appl. Res. Med. Aromat. Plants 18, 1–6 (2020).
- D.U. Yang, M.K. Kim, P. Mohanan, et al., J. Ginseng Res. 41, 31–35 (2017).
- X. Tian, S. Lv, H. Tian, et al., J. Food Compos. Anal. 87, 1–6 (2020).
- W.R. Wu, C.S. Cheng, Q.Q. Cheng, et al., Chin. J. Nat. Med. 18, 770–778 (2020).
- K. Navratilova, V. Hrbek, F. Kratky, et al., J. Food Compos. Anal. 78, 121–128 (2019).
Jana Kvirencova is a Ph.D. student in the Department of Food Analysis and Nutrition, University of Chemistry and Technology (UCT), Prague, Czech Republic. Her research is focused on the application of LC–HRMS in metabolomic studies and also the application of mass spectrometry in the analysis of polar pesticides.
Vojtech Hrbek is a research assistant in the Department of Food Analysis and Nutrition, UCT Prague. His main research interests are the application of mass spectrometry in the analysis of polar pesticides and other contaminants in food, and metabolomic studies concerned with the authenticity of food and feed.
Monika Tomaniova is a research assistant in the Department of Food Analysis and Nutrition, UCT Prague. Her research is focused on developing and validating analytical methods for the determination of organic contaminants in food and environmental compartments. Her research interests also lie in metabolomic studies concerned with the authenticity of food and feed.
Jana Hajšlova is a professor at UCT Prague. She is the head of ISO 17025/2018 accredited laboratory. She is a leader of the research group and is interested in food analysis.

New Study Reviews Chromatography Methods for Flavonoid Analysis
April 21st 2025Flavonoids are widely used metabolites that carry out various functions in different industries, such as food and cosmetics. Detecting, separating, and quantifying them in fruit species can be a complicated process.
Analytical Challenges in Measuring Migration from Food Contact Materials
November 2nd 2015Food contact materials contain low molecular weight additives and processing aids which can migrate into foods leading to trace levels of contamination. Food safety is ensured through regulations, comprising compositional controls and migration limits, which present a significant analytical challenge to the food industry to ensure compliance and demonstrate due diligence. Of the various analytical approaches, LC-MS/MS has proved to be an essential tool in monitoring migration of target compounds into foods, and more sophisticated approaches such as LC-high resolution MS (Orbitrap) are being increasingly used for untargeted analysis to monitor non-intentionally added substances. This podcast will provide an overview to this area, illustrated with various applications showing current approaches being employed.

.png&w=3840&q=75)

.png&w=3840&q=75)


.png&w=3840&q=75)


.png&w=3840&q=75)


