Analysis of Fusarium Toxins Using LC–MS-MS: Application to Various Food and Feed Matrices
LCGC North America
Co-occurrence of several mycotoxins (deoxynivalenol, zearalenone, T-2-toxin, HT-2 toxin) produced by field fungi, such as Fusarium graminearum and Fusarium culmorum, requires several analysis methods for their characterization. A reliable method for the determination of type A- and B-trichothecenes and zearalenone in cereal-based samples is presented. To achieve optimal mass spectrometric detection, electrospray ionization (ESI) and atmospheric pressure chemical ionization (APCI) were compared. Best results were obtained with ESI by implementing a two-period switching for the ionization polarity. The limit of quantification differs for each individual substance within the range 1–10 ppb. Mean recoveries using a standardized clean-up procedure were in the 54–93% range.
Fusarium fungi are capable of producing, to a variable degree, two or more toxins. The major Fusarium mycotoxins are fumonisins, A- and B-trichothecenes, and zearalenone (ZON) (1). Trichothecenes are responsible for a wide range of toxicity in animals, including feed refusal, weight loss and vomiting. In particular deoxynivalenol (DON) can inhibit protein biosynthesis and has been reported as an immunosuppressant (2). To reduce the levels of biogenic toxins, European authorities are currently discussing further regulations on mycotoxins. Within the European Union (EU), harmonized legislation is setting maximum limits for aflatoxins and ochratoxin A in cereals and cereal products. Limits for Fusarium toxins (DON, ZEA, HT2, and T2) are currently being drafted in EU member states; for example, maximum limits for Fusarium toxins (DON 100–500 μg/kg, ZON 20–50 μg/kg) were established in February 2004 (3).
The most common hyphenated methods for the determination of A- and B-trichothecenes include gas chromatography–electron capture detection, gas chromatography–mass spectrometry (GC–MS) or liquid chromatography (LC)–postcolumn derivatization and fluorescence detection (4). Increasingly, LC–tandem MS (MS-MS) has been applied to mycotoxin analysis despite higher costs and the need for experienced personnel. The main advantages of the technique include its general applicability to a broad range of compounds, high sensitivity and outstanding selectivity. Several methods already have been reported for the simultaneous determination of mycotoxins, which offer significant advantages over conventional techniques (5–9).
Here, we present a new method for the analysis of mycotoxins in cereal-based samples using a triple quadrupole LC–MS-MS system (API 2000, Applied Biosystems, Foster City, California). The method analyzes the mycotoxins deoxynivalenol (DON), nivalenol (NIV), fusarenone X (FX), verrucarol (VOL), 3-acetyldeoxynivalenol (3-ADON), 15-acetyldeoxynivalenol (15-ADON), diacetoxyscirpenol (DAS), HT-2 toxin (HT2), T-2 toxin (T2), zeralanone (ZAN), and zearalenone (ZON). For additional verification purposes ochratoxin A and aflatoxins were included in the study. We will briefly discuss our experiences regarding the choice of solvents used, solvent flow, split of LC eluents, negative or positive ionization and a comparison of APCI and ESI interfaces.
Development of the Mass Spectrometric Method
First, an LC–MS-MS method was developed that achieved good separation and sensitivity for the detection of 18 mycotoxins under the same instrumental conditions. The MS data for individual substances were optimized by flow injection with a syringe pump (flow 4–8 μL/min, HPLC flow rate 125 μL/min). The optimized instrumental conditions are summarized in Table I. A standard chromatogram of the
Fusarium
mycotoxins of major interest is shown in Figure 1.
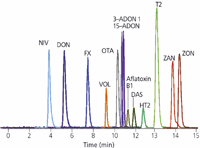
Figure 1: Standard chromatogram of the Fusarium mycotoxins of major interest.
In total, MS data were recorded for a total of 18 mycotoxins, details of which are summarized in Table II. Simultaneous determination of a wide variety of different mycotoxins requires incorporation of two periods of polarity switching into the MS–MS method. In conformity with the results reported by Razzazi and colleagues (7), the best sensitivity was found for type A-trichothecenes (DAS/HT2/T2) with positive ionization in ESI mode, while for type B-trichothecenes, ZAN and ZON, negative ionization is preferred. As is shown in Figure 2, the response for nivalenol is below the limit of detection (at a level of 200 ng/mL) when positive ionization is used. For quantification, two specific mass transitions for each compound were monitored. For all toxins investigated the molecular ions (M+/M–) were used for fragmentation, except for the type A trichothecenes, which predominantly formed sodium adducts. Because of their stability the sodium adducts proved to be suitable as parent ions for further fragmentation. The consequent benefit of using these pseudo parent ions is much higher sensitivity. For example, T-2 toxin produces a 40-times higher response at a 10 ng/mL level compared with the response of DON at 20 ng/mL (Figure 3). Detection limits in sample extracts of 0.2 μg/kg were possible using the signal-to-noise approach with S/N > 10 (Figure 4). Mycotoxins that were detectable under the same instrumental conditions but not integrated in the multimethod are shown in Table III.
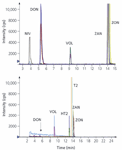
Figure 2: Response of selected mycotoxins in the negative mode (upper) compared with the response in the positive ion mode (lower).
Solvent Influence on the MS Response
The comparison of different solvents demonstrated that for ESI ionization a mixture of methanol–water improved the detector response, while the use of acetonitrile led to much lower signals.

Table I: Instrumental conditions
The use of buffers is very often recommended. However, the use of ammonium acetate (5 mM) for instance, with type-B trichothecenes resulted in the formation of adduct ions which sometimes led to fewer or less significant fragmentation reactions. Here, often only transition of the acetate ion showed a high response. In our situation, as a business laboratory we should have the ability to change LC methods without losing much time during routine analysis. In practice, however, it proved difficult to change, for example, from one solvent containing ammonium acetate to another method using a lower concentrated formate mixture. Consequently, we decided to use, on the one hand, the molecular ions for fragmentation because of more specific mass transitions and, on the other hand, to have the ability to share the instrument with other methods not using ammonium acetate buffer.

Table II: Mass spectrometric data for 12 mycotoxins of the multicomponent method
APCI Versus ESI
APCI ionization is most frequently cited in the literature with respect to mycotoxin analysis. In our laboratory, better responses were achieved by using TurboIonSpray (ESI) compared with Heated Nebulizer (APCI), which is demonstrated in Table IV. Lagana et al. reported similar results for an older type of the API instrument (API 365) (6).

Table III: Mycotoxins which were detectable under the same instrumental conditions but not integrated in the multimethod; method only for verification purposes
In summary, we achieved the best MS response for B-trichothecenes, OTA, ZAN and ZON using the ESI interface and negative ionization, an eluent of methanol/water, and a flow-rate of 250 μL with a split ratio of 1:1.

Table IV: Influences of different solvents and ionization interfaces on the MS response
For every commercial analytical laboratory time is limited and the amount of samples requiring analysis on any one instrument increases steadily. Therefore, a fast chromatography method is desirable to realize maximum sample throughput. To begin with we used an RP18 column (150 mm × 3 mm) with a particle size of 3.5 μm, and a flow-rate of 250 μL/min. One run required 22 min and good separation was obtained. To increase elution times the flow rate was increased to 1 mL/min. To maintain this throughput level an RP 18 column with a larger diameter (150 mm × 4.6 mm, 3 μm) was required to prevent elevated pressures. As can be seen in Figure 5, it was possible to achieve separation of all relevant mycotoxins in a 15-min run, in which the final substance eluted at 7.38 min. Additionally, the toxins T-2 and zearalanon (ZAN) showed better separation on the wider column.

Figure 3: MRM of DON at a level of 20 ng/mL (S/N 5 70) compared with MRM of T-2 toxin at a level of 10 ng/mL (S/N 5 2500).
Validating the Method
For the analysis of food and feed samples an existing clean-up procedure (MycoSep method) was checked for its applicability to MS detection. The sample preparation consists of an extraction of analytes from the sample matrix by shaking 20 g of homogenized ground sample for 1 h with 100 mL of an acetonitrile-water solution (85/15, v/v). Before the extraction step, 0.5 mL of a standard solution containing VOL and ZAN (10 and 5 μg/mL, respectively) in methanol was added. After filtration aliquots of the extract (corr. 1 g dry weight) were used for purification on MycoSep columns 226 (Romer Labs, Austria). Validation of the entire method was performed with wheat flour and obtained recoveries are depicted in Table V.
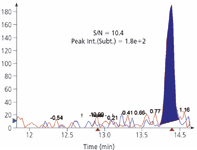
Figure 4: T-2 toxin at a level of 0.2 ng/mL in a babyfood sample extract.
The main task required for the method, which is used for routine food control, is its general applicability and robustness for several different food and feed matrices. Any reduction of sample preparation, as described, resulted in unacceptable high matrix effects as shown in Figure 6 for DON and VOL. As a result of these matrix effects, an effective sample preparation as described is mandatory to achieve a reliable and sensitive determination.
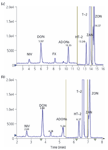
Figure 5: Comparison of two versions of RP18 chromatography; (a) 3 mm i.d. at a flow of 250 μL/min and a split of 1:1, oven temperature: 30 °C, (b) 4.6 mm i.d., flow 1 mL/min, split 5:1.
Because validation for each product matrix is normally not feasible, various recovery trials for the different test materials were performed to cover potential matrix effects. For most cereal commodities including fine ground wheat flour, corn, pasta, bread and pastries virtually no matrix effects were observed. In summary we noticed, that even with MycoSep clean-up strong signal suppression up to 40% were obtained for soy beans or for instance rape-seed (see Figure 3). To take specific matrix effects into account, matrix matched calibration must be performed. Alternatively, a dilution of the sample extract sometimes compensates most effects successfully.
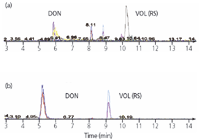
Figure 6: Comparison of sample extract, (a) before and (b) after clean-up with MycoSep 226.
The obtained recoveries for T-2 toxin in the different food and feed commodities were in the range from 60 to 95%. When the clean-up column is additionally rinsed afterwards with the extraction solvent, up to 20% higher recoveries for HT-2 and T-2 were possible.
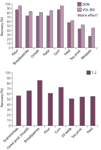
Figure 7: Results of different recovery trials for DON and its internal standards VOL in different commodities. Results of every sample matrix based on average values of various fortified samples (flour: n = 29; bread/pastries: n = 13; cereals: n = 23; pasta: n = 6; corn: n = 14; feed: n = 5; soy products: n = 8; molasses: n = 5).
Therefore, sample extract dilution or alternatively quantification by the use of matrix matched standard calibrations is recommended (see Figure 7).

Table V: Comparison of different detector response for selected mycotoxins by using the APCI and ESI ion source in negative ionization mode
For most cereal commodities including fine ground wheat flour, corn, pasta, bread and pastries, virtually no matrix effects were observed. A stronger effect was observed when soy beans or rapeseed were analysed with signal suppression up to 40% being possible. To take specific matrix effects into account, matrix matched calibration must be performed. A higher difference of the slope of the linear regressions indicates generally effects such as suppression or enhancement of the signal Usually, sample extract dilution compensates most effects successfully; nevertheless for samples close to the limit of quantification only standard addition could verify the quantified concentration.

Table VI: Average recoveries in % of the validation study with MycoSep material 226
Conclusions
The presented study underlines the high potential of tandem mass spectrometry coupled to liquid chromatography. Multiresidue methods for the determination of more or less polar compounds must be based on LC–MS techniques. Such methods are applicable to a wide variety of compounds in various matrices.
While identification of compounds is always possible, reliable and correct quantification remains critical. However, by application of suitable sample preparation procedures prior to LC–MS and through the use of internal standards these critical points can be handled satisfactory. Although the method was not developed primarily for its application to the aflatoxin family, it does offer a suitable secondary method to verify results obtained with classic methods based on fluorescence detection.
Upcoming EU regulations have increased the pressure to develop and validate chemical methods for the simultaneous detection of different Fusarium toxins. The method presented herein shows a high response for T-2 toxin, thereby permitting the analysis of these biogenic contaminants down to low parts-per-billion levels in broad range of commodities. The comparison of various method parameters, including the solvents used, the chosen interface and polarity mode has demonstrated that there are several variables requiring careful evaluation during development of an LC–MS-MS method to achieve optimal chromatographic and mass spectrometric results.
References
(1) J.W. Bennett and M. Klich,
Clin. Microbiol. Rev.
, 497-516 (2003).
(2) Opinion of the Scientific Panel on Contaminants in the Food Chain on a request from the Commission related to Deoxynivalenol (DON) as undesirable substance in animal feed. The EFSA Journal 73, 1-41 (2004).
(3) Myktoxin H�tmengen Verordnung, BGBl, 1248; last rev. 04.02.2004 (1999).
(4) R. Krska and J. Fresenius, Anal. Chem. 371, 285 (2001).
(5) U. Berger, J. Agr. Food Chem. 47, 4240-45 (1999).
(6) A. Lagana et al., Rapid Commun. Mass Spectrom. 17, 1037-1043 (2003).
(7) E. Razzazi-Fazeli et al., J. Chromatogr,. A 968, 129-142 (2002).
(8) W. Langseth, J. Chromatogr., A 815, 103-121 (1998).
(9) T. Rundberget, J. Chromatogr., A 964, 189-197 (2001).
Analytical Challenges in Measuring Migration from Food Contact Materials
November 2nd 2015Food contact materials contain low molecular weight additives and processing aids which can migrate into foods leading to trace levels of contamination. Food safety is ensured through regulations, comprising compositional controls and migration limits, which present a significant analytical challenge to the food industry to ensure compliance and demonstrate due diligence. Of the various analytical approaches, LC-MS/MS has proved to be an essential tool in monitoring migration of target compounds into foods, and more sophisticated approaches such as LC-high resolution MS (Orbitrap) are being increasingly used for untargeted analysis to monitor non-intentionally added substances. This podcast will provide an overview to this area, illustrated with various applications showing current approaches being employed.
Extracting Estrogenic Hormones Using Rotating Disk and Modified Clays
April 14th 2025University of Caldas and University of Chile researchers extracted estrogenic hormones from wastewater samples using rotating disk sorption extraction. After extraction, the concentrated analytes were measured using liquid chromatography coupled with photodiode array detection (HPLC-PDA).


