Aggregation Analysis of Biosimilar EPO (Erythropoietin) Using a BioSep 2000 GFC Column
Gel filtration chromatography is the primary method used to analyze the amount of aggregate and dimer present in a therapeutic protein sample. A BioSep 2000 column is used to analyze EPO samples to determine difference in the amounts of aggregate present.
Gel filtration chromatography is the primary method used to analyze the amount of aggregate and dimer present in a therapeutic protein sample. A BioSep 2000 column is used to analyze EPO samples to determine difference in the amounts of aggregate present.
Next to insulin, erythropoietin is probably the most widely manufactured recombinant biosimilar protein with several companies throughout the world currently developing their version of the recombinant protein. Since protein aggregate is a major concern in the manufacture of any recombinant therapeutic, many groups are currently developing new methods for quantitating dimer and aggregate for EPO and other biosimilar proteins.
Materials and Methods
A BioSep-SEC-S 2000 column (300 × 4.6 mm dimension) was used for all GFC separations (Phenomenex, Torrance, California). All samples were analyzed on an Agilent 1100 HPLC (Palo Alto, California) with an autosampler and variable wavelength detector set at 220 nm; data was collected using Chemstation software (Agilent). Mobile phase was 50 mm sodium phosphate pH 6.8 with 300 mm sodium chloride running at a flow rate of 0.35 mL/min.
Results and Conclusion
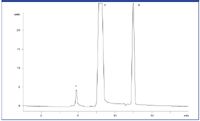
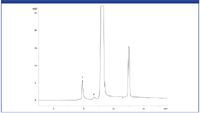
Since EPO is approximately 30 kDa molecular weight in its glycosylated form (approximately 18 kDa for protein), a BioSep 2000 series column was used for all separations as it provides the largest separation window for proteins below 100 kDa molecular weight. Figures 1 and 2 show GFC chromatography on the BioSep 2000 column for two different samples of EPO. Figure 1 is a chromatogram of a freshly-frozen EPO sample and Figure 2 is a chromatogram of an EPO sample that had been frozen for over a year. While one can see peaks for aggregate, monomer EPO, and buffer salts for both samples, note the increase in a dimer peak for EPO for the sample frozen for more than a year. This increase in EPO dimer suggests that the formulation used was less than ideal for this sample.

Figure 1: A freshly-frozen EPO sample run on a BioSep-SEC-S 2000 column. Note the early eluting high molecular weight protein (assumed to be EPO aggregate), the monomer EPO peak at 9 min RT, and the low molecular weight peak at the void of the column (assumed to be buffer salts in the diluent). Little or no dimer appears to be present.
Also note that the chromatography for the EPO sample run on the BioSep 2000 shows good resolution between the monomer and dimer peaks of the EPO sample (in Figure 2) despite the sample being heavily overloaded to visualize the dimer peak. The assigned aggregate peak in both chromatograms is also very low level, but is well recovered and somewhat included into the pores of the BioSep 2000 suggesting that aggregate has a finite size or that the early eluting peak is a different high molecular weight protein impurity in the sample. Regardless, the good peak separation, wide resolution window for low molecular weight proteins, and inertness makes the BioSep 2000 column an excellent GFC solution for aggregate analysis of EPO and other low molecular weight biosimilar proteins.

Figure 2: An EPO sample stored at -20 °C for more than a year run on a BioSep-SEC-S 2000 column. The good resolution between peaks makes the BioSep 2000 column an excellent choice for aggregate analysis of EPO and other biosimilar proteins.
Phenomenex, Inc.
411 Madrid Ave., Torrance, CA 90501
tel. (310) 212-0555; (310) 328-7768
Website: www.phenomenex.com

SEC-MALS of Antibody Therapeutics—A Robust Method for In-Depth Sample Characterization
June 1st 2022Monoclonal antibodies (mAbs) are effective therapeutics for cancers, auto-immune diseases, viral infections, and other diseases. Recent developments in antibody therapeutics aim to add more specific binding regions (bi- and multi-specificity) to increase their effectiveness and/or to downsize the molecule to the specific binding regions (for example, scFv or Fab fragment) to achieve better penetration of the tissue. As the molecule gets more complex, the possible high and low molecular weight (H/LMW) impurities become more complex, too. In order to accurately analyze the various species, more advanced detection than ultraviolet (UV) is required to characterize a mAb sample.


