Where Has My Efficiency Gone? Impacts of Extracolumn Peak Broadening on Performance, Part IV: Gradient Elution, Flow Splitting, and a Holistic View
Dispersion (broadening, or spreading) of analyte zones (peaks) outside of chromatography columns can seriously erode the resolution provided by good columns. In this installment, we focus on the impact of elution mode (isocratic or gradient) and post-column flow splitting on the total level of extracolumn dispersion (ECD) in a liquid chromatography (LC) system, and demonstrate the use of a free, web-based calculator that can be used to guide decision making aimed at reducing ECD during method development.
In the last three installments of “LC Troubleshooting,” we reviewed the basic concepts of extracolumn dispersion (ECD) (1), and discussed the contributions of the injection step (2), connecting tubing, and spectroscopic detectors (3) to the total observed variance in some detail. In this month’s installment, we conclude our discussion of specific contributions to the total variance by addressing how elution mode (that is, isocratic or gradient elution) affects the total level of ECD, and how post-column flow splitting can affect the observed variance. Finally, we demonstrate the use of a free, web-based calculator that leverages the theory discussed in these installments to enable quick and easy estimation of the magnitudes of the different contributions to the total observed variance.
Extracolumn Dispersion under Gradient Elution Conditions
Figure 1 illustrates the different contributions to the total observed peak variance σ2obs. Equation 1 is most relevant when isocratic elution is used, and the solvent composition of the sample matches that of the mobile phase. When this is not the case, then variants of equation 1 are more relevant, where the magnitude of specific contributions to the total variance are either increased or reduced, depending on the specific conditions.

FIGURE 1: Illustration of the contributions of several LC system components to the total variance of peaks observed at the detector, σ2observed as in equation 1. We note that equation 1 is valid using either time- or volume-based variances.

For example, in Part II of this series, we discussed how the impact of the σ2injection term can be reduced by employing different “tricks” during the injection step, including preparing the sample with a low concentration of “strong solvent” compared to the mobile phase composition, and so-called “sandwich injection.” When gradient elution conditions are used, there is the potential to significantly reduce all of the pre-column contributions to the total variance, including the injection and pre-column tubing components. This effect is especially pronounced in cases where the gradient is started at a mobile phase composition that is "weak" relative to the mobile phase composition that an analyte is eluted in (for example, in reversed-phase LC, a low concentration of organic solvent in the mobile phase), and the injected sample also contains a low concentration of “strong” solvent. In these cases, the pre-column contributions to the total variance are very small because any dispersion of the analyte that occurs upstream from the column inlet is effectively “undone” as the analytes all adsorb to the stationary phase at the column inlet and form a very narrow analyte band in the column. This is typically referred to as “focusing” of the analyte at the column inlet. Although this is a fortunate outcome when the separation conditions allow it, this type of outcome is not inevitable, and there certainly are cases where a relatively large injected volume of a sample containing a high concentration of strong solvent can lead to serious peak broadening, even if gradient elution is used (4).
When conditions are favorable for reduction in the pre-column contributions to ECD, the post-column contributions suddenly become more important. This is both because the pre-column contributions to ECD are minimized, and because peak volumes in gradient elution tend to be smaller and more uniform compared to those observed in isocratic separations (see equation 3 of Part I of this series [1]; for gradient separations, k is replaced with ke, the local retention factor at the column exit, which is about 1–3 for most separations). In the case of connecting tubing in particular, reducing the tubing diameter is especially tempting because of the strong fourth-power dependence of this variance contribution on the diameter, and reducing the tubing length is often limited by the physical proximity of instrument components such as the column and detector. However, we should choose tubing diameters carefully, because the pressure required to drive mobile phase through these small tubes also increases strongly with decreasing tubing diameter. Under conditions of optimal particle size and column length, a total pressure of 1500 bar, and gradient elution, Broeckhoven and Desmet found that the optimal post-column tubing diameter roughly doubled from 60 to 120 μm i.d. for target efficiencies of 10,000 or 500,000 plates, respectively (5).
Effect of Post-Column Flow Splitting on Dispersion
Post-column flow splitting is common in contemporary LC work, especially when a mass spectrometric (MS) detector is coupled with an LC separation executed at a higher flow rate than the MS instrument can tolerate. Important applications that involve these conditions are high throughput methods, and two-dimensional LC where flow rates in excess of 0.5 mL/min are frequently used in the second dimension to improve the throughput of that part of the separation. Although sophisticated active splitting devices are sometimes used to control the split ratio, the most common approach is to use a simple tee piece with different lengths and diameters of tubing at the two outlet branches of the tee to control the split ratio. However, in spite of the importance of these applications, the contribution of the flow splitting step to ECD has been the focus of only a few systematic studies published in the literature. We have recently published one of these studies, which was motivated by our frequent observation that peaks were wider than we expected when using post-column flow splitting (6).
During the course of this study, our principal realization was that post-column flow splitting can lead to peak volumes exiting the split point that are very small (for example, much less than 1 μL) compared to those encountered in all other analytical-scale LC separations. This concept is illustrated in Figure 2. These low-volume post-split peaks are then highly susceptible to broadening by dispersion in all of the system elements downstream from the split point, which are typically connecting tubing and the detector. In our work, we did not find any evidence that the splitting process (for example, what happens in the tee piece itself) contributes significantly to the overall variance. Thus, estimation of the impact of the post-split elements is pretty straightforward. The volume of a peak exiting the split point (σv,post–split) is determined by the ratio of the flow rate through the column (Fcolumn) and the flow rate exiting the split point (Fpostsplit), as in equation 2. Then, the total variance observed at the detector (σv,obs = σ2t,obs ∙ F2post-split) is the sum of the post-split tubing and detector variances (see [2] for tubing and detector variances), where the pre-split variance includes contributions from the injector, and pre- and post-column tubing.
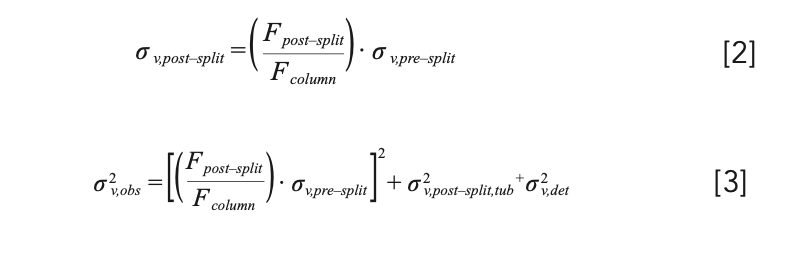
FIGURE 2: Illustration of the idea that analyte mass (indicated in blue) is conserved exiting the split point, which means that the volume of the analyte peak entering the split point is split into portions dictated by the split ratio. The convention used here is that a split ratio of X:Y means that the fraction X/(X+Y) of the peak goes to the detector, and the fraction Y/(X+Y) goes to waste or a second detector. Adapted from reference (6).
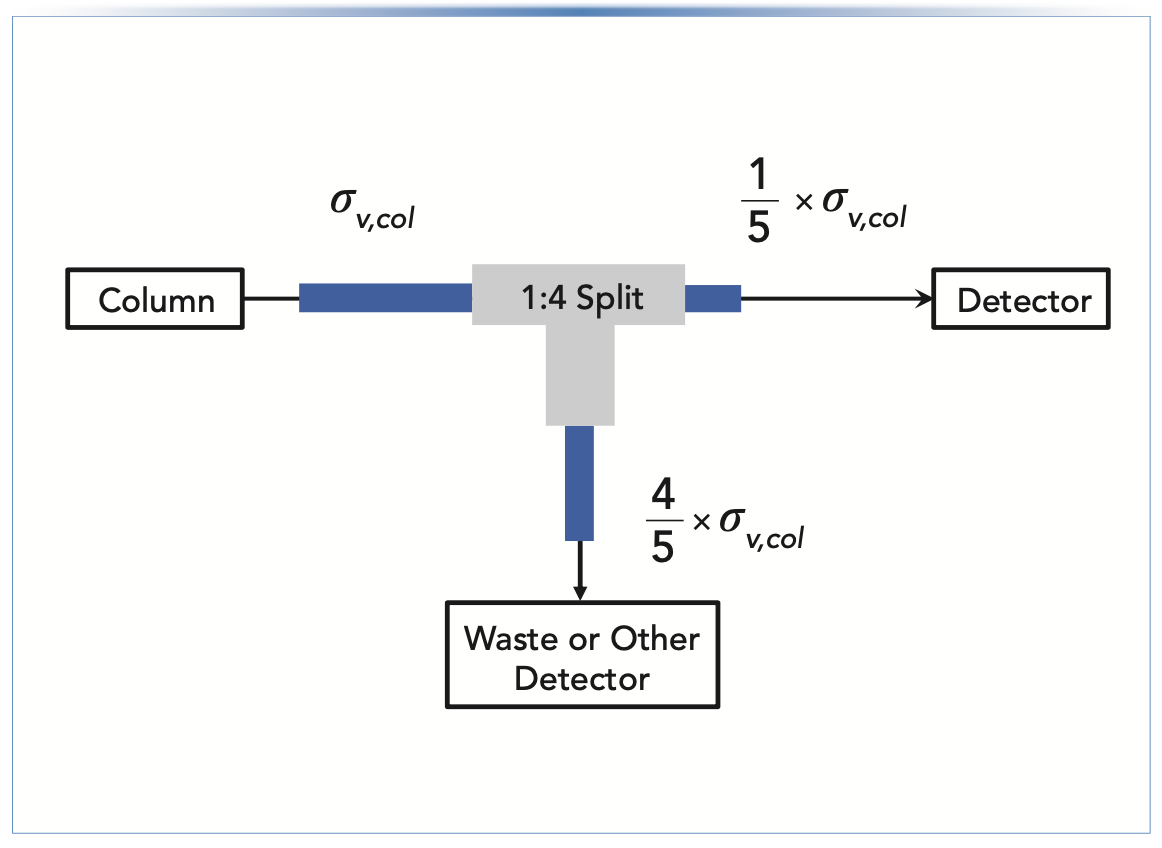
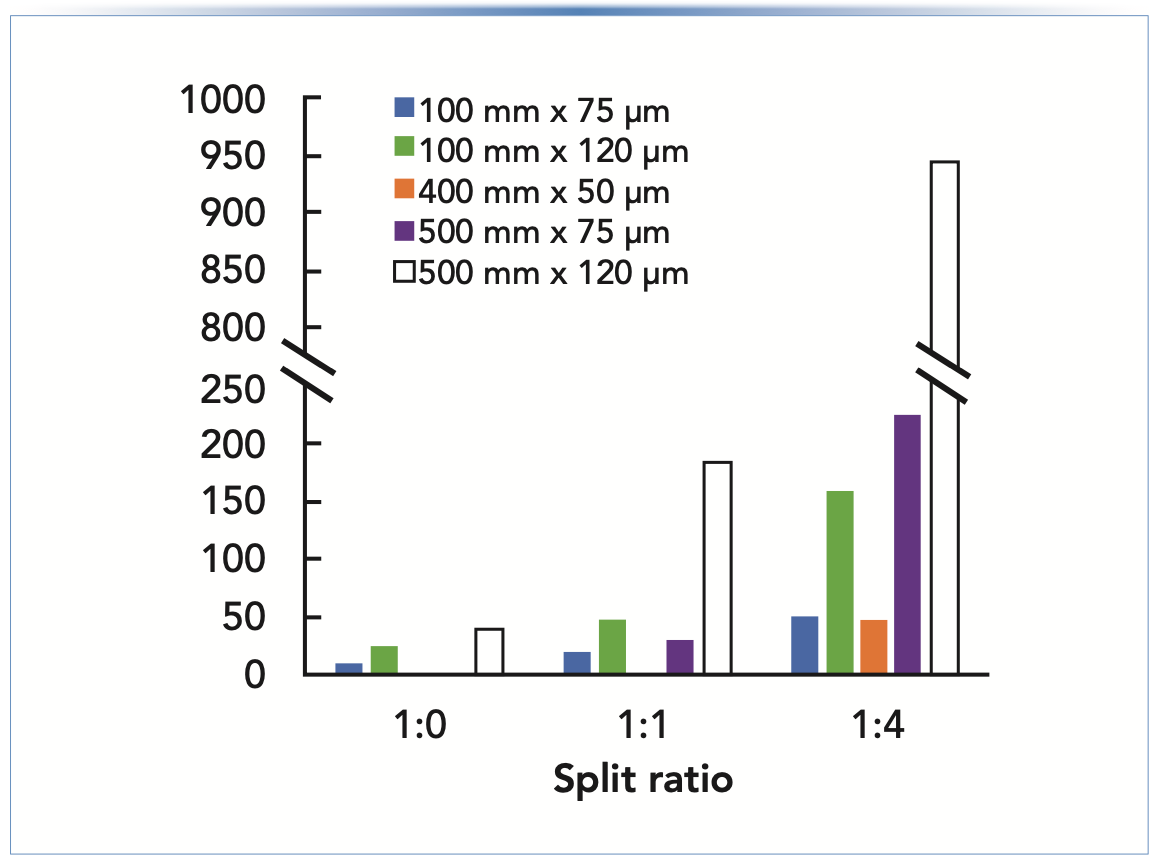
Figure 3 shows a selection of experimental results from our study. The values plotted are percent increases in the observed variance when using different lengths and diameters of post-split tubing and different split ratios, relative to the case where a short (100 mm), narrow (50 μm i.d.) post-split tube is used (which contributes very little to the variance under these conditions). When there is no flow split (that is, 1:0 case), the increases in variance because of the different post-split tubes are modest, with just 30% in the worst case of the 500 mm x 120 μm i.d. tube. However, even at a split of 1:1, the variance increases are significant even when using 75 μm i.d. tubes. In the more challenging case of a 1:4 split, even using a 400 mm length of 50 μm i.d. increases the observed variance by about 35%, robbing the analyst of one-third of the efficiency they expect for their separation. Subsequent comparison of predicted increases in the total observed variance using equations 2 and 3 above with experimental results showed that the predictions are accurate enough to guide method development, with a median error of about 10% of the total variance. This work shows that, when the analyst has a choice, the split point should be located as close as possible to the detector, so that the length of post-split tubing is minimized. Then, once the length has been set, the diameter of the post-split tubing should be decreased as far as possible without significantly increasing the pressure drop across this tube (see next section for more discussion of this point).
FIGURE 3: Effect of post-split tubing dimensions and split ratio on dispersion in the post-split tubing. The values plotted are percent increases in total variance relative to the case where the split point is connected to the detector using a 100 mm x 50 μm i.d. capillary. The peak volume entering the split point was about 2.5 μL. Adapted from reference (6). Please see reference (6) for other details.
Putting It All Together
In this series of installments on ECD, we have aimed to discuss individual contributions to the total observed variance in some detail. Recent research over the last decade has deepened our understanding of some of these contributions, including the injection step, and the contribution of post-column flow splitting. What matters most to the analyst, though, is how all of these contributions taken together impact the quality of their separations. To facilitate use of the theory discussed in these installments, we have built a web-based calculation tool that allows users to visualize the magnitudes of different contributions to the total observed variance. Figure 4 shows a screenshot of the interface for this free tool. We note that in their free Microsoft Excel-based LC simulator, Guillarme and coworkers also estimate some of these values based on similar input parameters (7).
FIGURE 4: Screenshot of web-based calculator for estimating contributions to ECD from different LC system components. http://www.multidlc.org/dispersion_calculator.
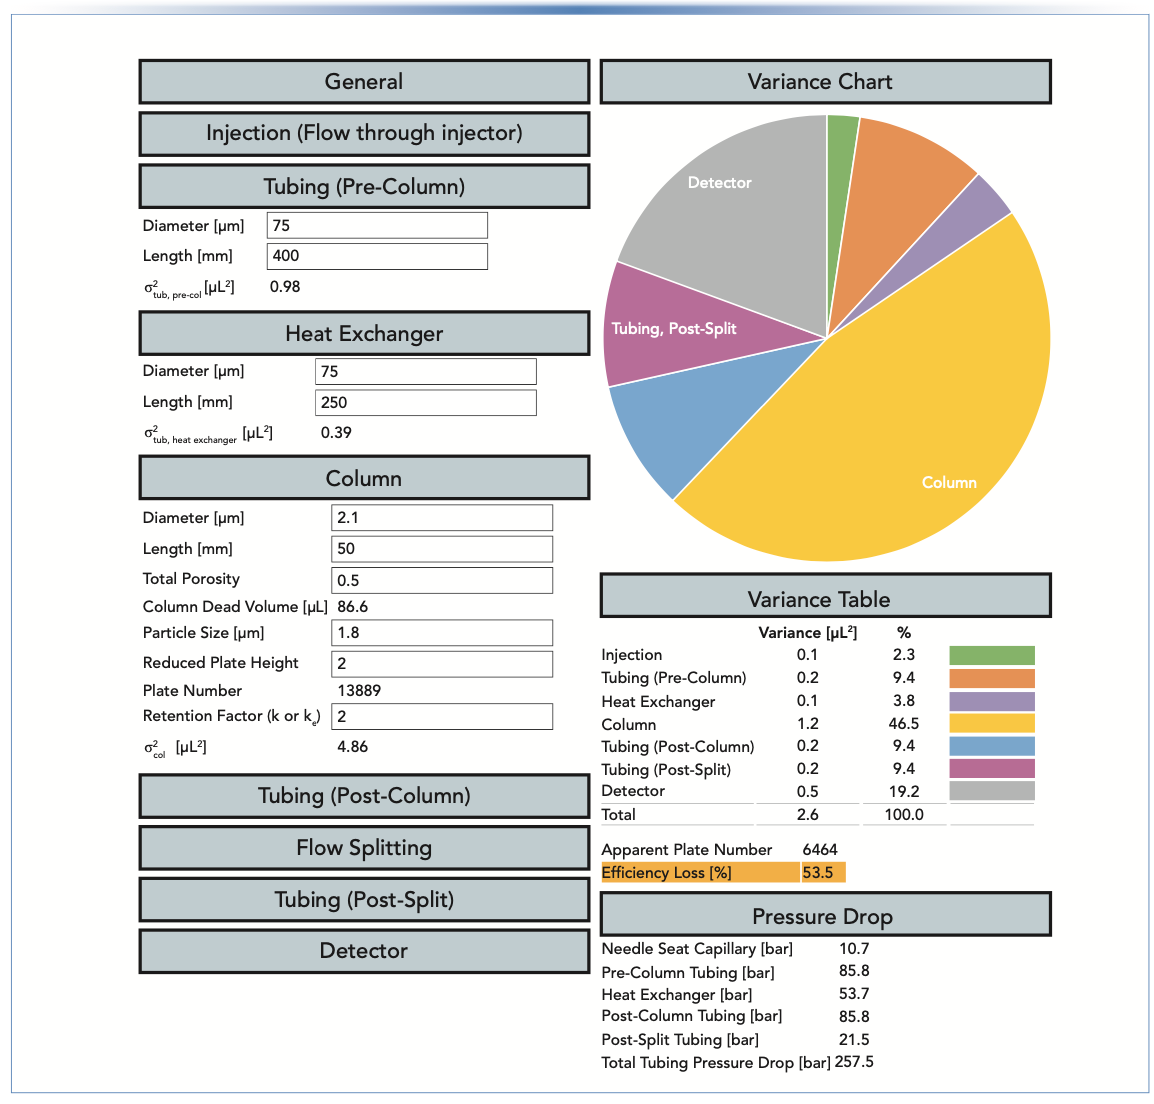
Figure 5 provides examples of how our calculator can be used to guide decisions about different system components (for example, what diameter of post-column tubing should be used) during method development. In Case A, we start with a relatively large column packed with 5 μm particles, operated in a system equipped with “standard” injection, detection, and tubing values. In this case, we see that the total observed variance is dominated by the column contribution (~97%), and the pressure drop across the tubing is modest at 36 bar (that is, 10% of the total available pressure drop in a 400 bar system, or about 3% in a 1200 bar system). In the event that one were to think that replacing all of the tubing in the system with 75 μm i.d. capillaries would help squeeze more performance out of the large column used in Case A, Case B is instructive.
FIGURE 5: (a through d) Comparison of contributions of different components of ECD in different chromatographic scenarios. All pre-column and post-column tubing lengths are 400 mm except in case (d). All heat exchanger tubing lengths are 250 mm. All reduced plate heights are assumed to be 2. Isocratic elution with a retention factor of 2 is assumed in all cases. Dynamic viscosity of the mobile phase is assumed to be 1 cP (appropriate for water at room temperature). Case (d): Post-split tubing is 200 mm x 75 μm i.d.
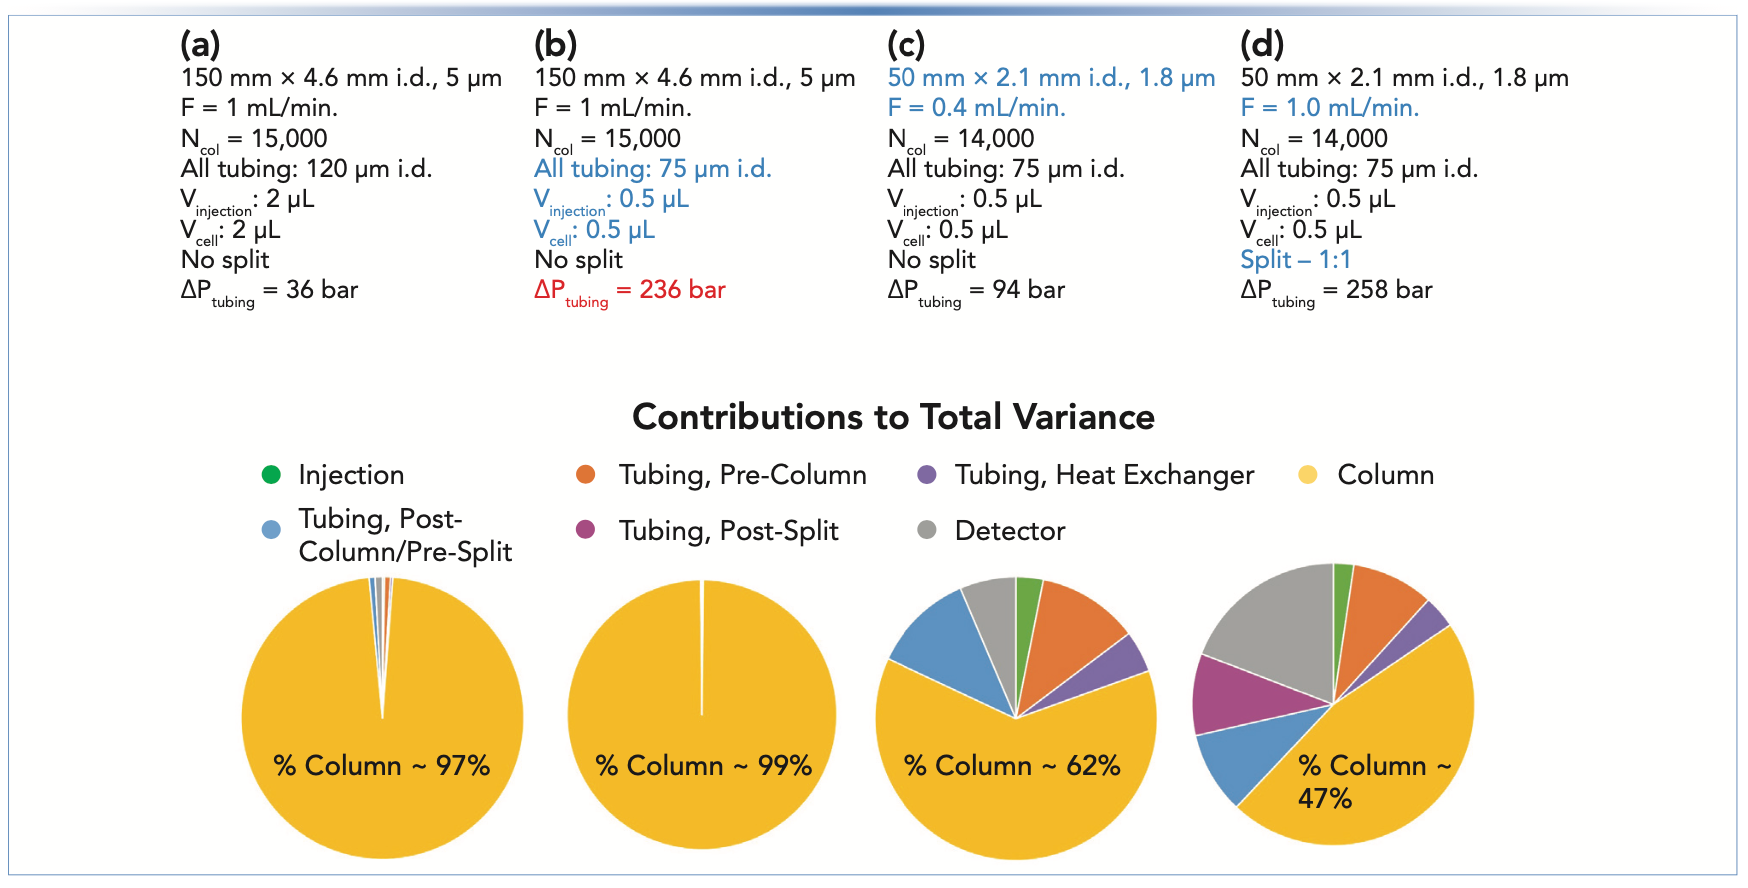
Here, we see that reducing the injection and detection volumes and reducing the capillary diameters does indeed reduce the total level of ECD, but only by about 2%; also, this comes at the cost of a significantly higher pressure drop across the tubing (236 bar). Indeed, on a 400 bar system, this separation may not even be possible, because there would not be enough pressure left to drive the mobile phase through the column under these conditions.
Things become a bit more interesting when we get to Case C. Here, even though we’ve retained “low dispersion” conditions of smaller injection and detection volumes, and smaller 75 μm i.d. capillaries, the contributions of ECD to the total observed variance are about 35%. In other words, the analyst is only realizing about 65% of the expected efficiency of the column, because of dispersion in other parts of the system. The pie chart makes it clear that this situation could be improved by reducing the length and/or diameter of the pre- and post-column tubing, since these are the major contributors to the ECD in this case.
Finally, in Case D, we illustrate the seriousness of the impact of post-column flow splitting when using small columns. This case is the same as Case C, except that: 1) the flow rate through the column is increased slightly; and 2) a 1:1 split has been added with post-split tubing of 200 mm x 75 μm i.d. With these changes, the level of ECD rises to 53% of the observed variance. This is because of the new contribution from the post-split tubing (magenta pie slice), but also to the increased relative contribution from the detector (because the pre-split peak volume is much smaller while the detector volume is unchanged). In this case, the most impactful changes that could be made would be to 1) decrease the detector cell volume (although, this is hard to decrease further without sacrificing signal-to-noise ratio [3]); and 2) decrease the lengths or diameters of the post-split tubing, although this must be done very carefully, given that the pressure drop across the tubing is already 258 bar.
Summary
In this installment of “LC Troubleshooting” we have wrapped up our discussion of details associated with the contributions of specific LC system components to extracolumn dispersion by discussing the impact of elution mode, and post-column flow splitting. More importantly, we have demonstrated the use of a free web-based calculator that can be used to estimate the magnitudes of contributions to ECD from different system components, and shown how these estimates can be used to guide decisions during method development about which system components to use and which can be modified for maximal performance improvement. We hope that this series of installments helps to deepen readers’ understanding of the contributions of specific system components to the total level of ECD, and ultimately avoid surprising apparent efficiency losses because of mismatches between column and LC system characteristics that have nothing to do with the performance of the column per se.
Erratum
In Part III of this series (3), equation 4 was incorrect. The correct version of this equation is given in equation 4 here.

This has been corrected in the online version of Part III of this series.
References
(1) D.R. Stoll and K. Broeckhoven, LCGC North Am. 39(4), 159–166 (2021).
(2) D.R. Stoll and K. Broeckhoven, LCGC North Am. 39(5), 208–213 (2021).
(3) D.R. Stoll and K. Broeckhoven, LCGC North Am. 39(6), 252–257 (2021).
(4) D.R. Stoll, R.W. Sajulga, B.N. Voigt, E.J. Larson, L.N. Jeong, and S.C. Rutan, J. Chromatogr. A 1523, 162–172 (2017). https://doi.org/10.1016/j.chroma.2017.07.041
(5) G. Desmet and K. Broeckhoven, TrAC Trends Anal. Chemi. 119, 115619 (2019). https://doi.org/10.1016/j.trac.2019.115619
(6) C. Gunnarson, T. Lauer, H. Willenbring, E. Larson, M. Dittmann, K. Broeckhoven, and D.R. Stoll, J. Chromatogr. A 461893 (2021). https://doi.org/10.1016/j. chroma.2021.461893
(7) D. Guillarme, B. Bobaly, and J.L. Veuthey, LCGC North Am. 39(3), 144–145 (2021).
ABOUT THE AUTHORS
Ken Broeckhoven received his PhD in 2010 from the Vrije Universiteit Brussel (VUB), in Brussels, Belgium. Following post-doctoral research at VUB and work as a visiting researcher in the separation processes laboratory at ETH Zurich, in Switzerland, he became a research professor at VUB in 2012. He was subsequently promoted to Assistant Professor and then to his current position as an Associate Professor in 2017.

Thomas J. Lauer is currently a student researcher working in Dwight Stoll’s laboratory at Gustavus Adolphus College in St. Peter, Minnesota.

ABOUT THE COLUMN EDITOR
Dwight R. Stoll is the editor of “LC Troubleshooting.” Stoll is a professor and the co-chair of chemistry at Gustavus Adolphus College in St. Peter, Minnesota. His primary research focus is on the development of 2D-LC for both targeted and untargeted analyses. He has authored or coauthored more than 75 peer-reviewed publications and four book chapters in separation science and more than 100 conference presentations. He is also a member of LCGC’s editorial advisory board. Direct correspondence to: LCGCedit@mmhgroup.com


Polysorbate Quantification and Degradation Analysis via LC and Charged Aerosol Detection
April 9th 2025Scientists from ThermoFisher Scientific published a review article in the Journal of Chromatography A that provided an overview of HPLC analysis using charged aerosol detection can help with polysorbate quantification.
Removing Double-Stranded RNA Impurities Using Chromatography
April 8th 2025Researchers from Agency for Science, Technology and Research in Singapore recently published a review article exploring how chromatography can be used to remove double-stranded RNA impurities during mRNA therapeutics production.


