Liquid Chromatography–Mass Spectrometry (LC–MS) Analysis of Hop-Derived Humulone and Isohumulone Constituents in Beer: The Bitter Truth of Hops Utilization During Brewing
The contribution of hops to the bitter flavors in beer is complicated by a number of factors, including the relative concentrations of humulone homologs in hops, the extraction of bittering compounds from hops, and the conversion of humulones to isohumulones during the brewing process. In this study, we describe a rapid liquid chromatography–mass spectroscopy (LC–MS) method using electrospray ionization (ESI) coupled with selective ion monitoring mass spectroscopy (SIM-MS) for analysis of humulone and isohumulone content in beer. Individual beer samples are monitored directly following filtration and decarbonization. Using multiple injections in a single experimental run (MISER), data were collected in as little as 7 min per beer sample. Results were displayed as a single “misergram,” which allowed for the convenient analysis of relative concentrations of humulones and isohumulones or hops utilization in sets of in-house brewed beers and commercial samples.
Beer is one of the most popular beverages in the world, and consistently ranks at the top of the list for consumers of alcoholic drinks. Growth of craft breweries and consumer interest in beer flavor has led to a wealth of readily available beer styles and flavors. In 1984, there were fewer than 100 breweries in the United States (1). The most predominant beer and perhaps the only style available at many locations in the United States was North American lager. By 2019, there were over 8000 breweries offering hundreds and hundreds of beer styles, as defined by the Brewer’s Association “Beer Style Guidelines” (2). This surprising variety of beers can be obtained from four basic ingredients: water, malted grain, spices (hops, fruits, and other consumables), and yeast. Control of the ingredients, brewing process, fermentation, packaging, and storage has a significant impact on the consistency of the final product, and also presents a challenge for brewing scientists monitoring the components contributing to the flavors in beer (3).
Beer bitterness derives from using hops during brewing, providing an important flavor balance to the sweet flavors of malts and grains (4). The dried hop cones or strobile used in brewing contain significant amounts of polyketides, particularly the humulones, or α-acids (AA), which can represent 2–15% of the total mass of the hops. The major homologs of the AAs are the co-, n-, and ad-humulones, which collectively account for greater than 98% of the α-acid or AA content. (5). During the brewing process, the AAs are isomerized to the more water-soluble isohumulones, or iso-α-acids (IAA), via an acyloin rearrangement with ring contraction (Figure 1). Beer bitterness is often described in terms of international bittering units (IBU), with a scale ranging from values of 5 to 100 (6). With the advent of craft brewing and very hoppy beers, some extremely high values of IBU have been claimed. The IBU numeric value has been suggested as approximately equivalent to the concentration of isohumulones in beer in parts per million (ppm). However, actual sensory beer bitterness is more complex and depends on the concentrations of a number of potential bittering agents (7–9).
FIGURE 1: Utilization of bittering components of hops. Extraction of AA from hops and isomerzation to IAA. R = isopropyl (co-); isobutyl (n-); secbutyl (ad-).
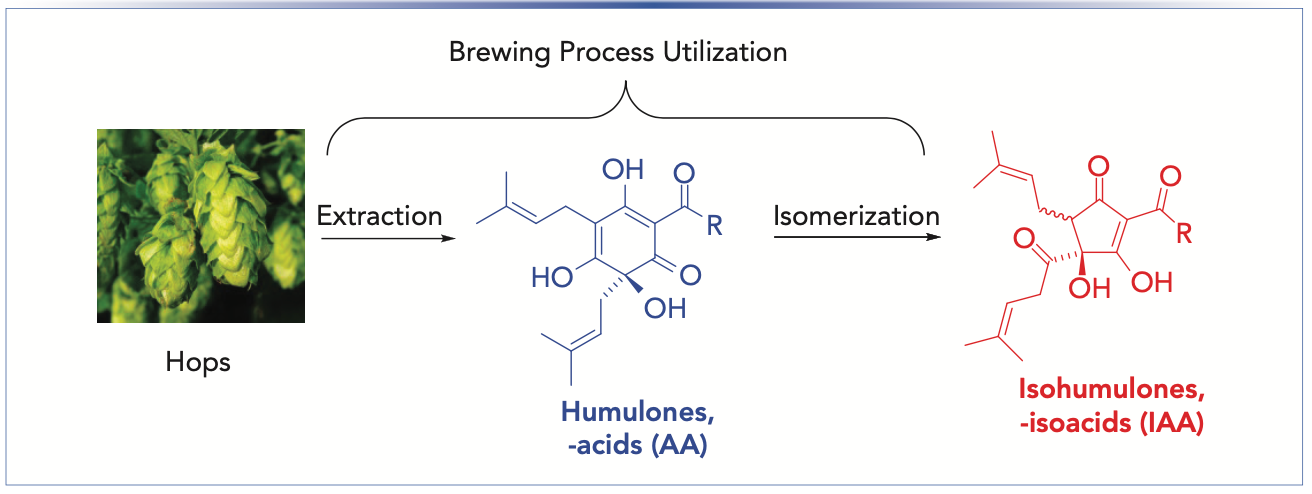
The combination of extraction of humulones AA from hops and conversion to IAA during brewing is described as hops utilization. Predicted values of IBU can be determined by calculating the amount of hops, percent AA content, volume of the wort, sugar concentration, and time of hop addition (10). This is particularly important for design and implementation of new beer recipes. The traditional method of analysis of beer bitterness relies on the spectrophotometric ultraviolet (UV) determination of IAA content of an organic extract of beer at 275 nm (11,12). A disadvantage of the spectrophotometric method is the inability to separate absorption of IAA from interfering components that absorb in the same region of 275 nm, but do not exhibit the same contribution to beer bitterness. The growth of the craft beer industry has led to a marked increase in strongly hopped and flavored beers, resulting in significant changes in the absorption profile of organic extracts of beer. Late- or dry-hopped beers, in which hops are added at the end of the boiling process or after primary fermentation, result in higher concentrations of humulone AA and related oxidized products. Their contribution to UV absorption can result in unexpectedly high values of IBU by the spectroscopic method. Complete analytical separation of all the homologs and isomers of IAA has been achieved by high performance liquid chromatography (HPLC) with UV detection (13–16) and by liquid chromatography–mass spectroscopy (LC–MS) (17,18).
We recently introduced a rapid LC–MS method for determining the AA and IAA content in commercial beer samples using selective ion monitoring (SIM) (19). By employing multiple injections in a single experimental run (MISER), we were able to analyze 70 different beer samples in a total of 74 min. The single misergram allows facile comparison of the relative concentrations of AA and IAA in the beer samples in a single chromatographic display (20,21). MISER analysis has been used in our introductory course at the University of Missouri–St. Louis, “Beer Brewing: Chemical and Biochemical Principles” (22). In this report, we take advantage of a set of beers prepared in our beer brewing course to analyze hops utilization determinants of IBU and measure beer bitterness components. Knowledge of the individual brewing recipes allowed direct comparison of predicted IBU from hops additions, measurement of IBU by spectroscopic analysis, and final determination of the concentration of AA and IAA by SIM LC–MS in the finished beer samples. A sample set of commercial beers from a local brewery are also compared for content of AA and IAA.
Experimental
Reagents
Methanol and acetonitrile (HPLC grade) were purchased from Fisher Scientific. Ammonium formate (NH4HCO2) and formic acid (HCOOH) were purchased from Sigma–Aldrich. Ultrapure water was obtained from a Milli-Q Integral 10 from Millipore. Standards ICS-3 (dicyclohexylamine salts of trans-iso-α-acids) and ICE-3 (hops extract standard) were obtained from the American Society of Brewing Chemists (ASBC Check Sample Service; asbc@scisoc.org).
Unhopped beer, used for preparation of standard solutions, was prepared by addition of 225 g of dry malt extract (DME) to 1 L of boiling water. The mixture held at a boil for 15 min, the hot wort cooled in an ice water bath and subsequently transferred to a 4 L glass fermentation bottle equipped with an air lock. To this mixture, 5 mg of dry yeast (Safale-05) was added. After one week, the beer was transferred to a clean, sanitized 4 L glass fermentation bottle equipped with an air lock. After an additional two weeks, the unhopped beer was transferred to standard beer bottles, capped, and stored in a refrigerator at 4 oC. Humulone and isohumulone standards were prepared by dissolving a suitable amount of AA or IAA in a minimum amount of ethanol and diluted with unhopped beer to provide standard solutions of 5, 10, 25, and 50 ppm.
Sample Preparation
Beer samples were collected immediately upon opening the specific bottle of carbonated beer. Several milliliters were transferred via gravity filtration through Whatman qualitative P8 filter paper into a 15 mL plastic centrifuge tube. Samples were capped, frozen, and stored for several days. Aliquots of the thawed samples were transferred into HPLC analytical vials for placement in the LC–MS autosampler. Samples were analyzed directly without dilution. Standard solutions of known concentration of humulone and isohumulone were prepared in unhopped beer.
Instrument Details
Multiple injections in a single experimental run (MISER) LC–MS experiments were performed on a Shimadzu LC–MS-2010A equipped with two LC-20AD mobile phase pumps and a SIL-10AD autosampler. The mass spectrometer was operated in electrospray (ESI) negative mode with capillary voltage of 1250 V. SIM was conducted to continuously monitor ions at 347 and 361 m/z, corresponding to the deprotonated molecular ions of the AA and IAA homologs. The source and desolvation temperatures were 275 and 250 oC, respectively. Nitrogen nebulizing and drying gas flow rates were optimized at 1.5 L/min and 0.1 MPa, respectively.
Chromatographic separation of AA and IAA was achieved using isocratic conditions with an Agilent Poroshell 120 EC-C18 HPLC column having dimensions of 30 mm x 2.1 mm i.d. and 2.7 μm particle stationary phase. Mobile phase consisted of an isocratic mixture of 2 mM ammonium formate (HCOONH4) in acetonitrile:water (1:1) with a flow rate of 0.20 mL/min. MISER experiments were performed using sequential 5 uL injection volumes for each beer sample at intervals of 5–7 min.
Results and Discussion
Students in our introductory science course on beer brewing (22) have been preparing small batches of beer using recipes developed in class (Table I). Over two semesters with 40 students, we brewed 13 different recipes. Students worked in pairs and some teams chose identical recipes. We obtained a wide range of beer styles from very light ales (2A, 5A, 7A, and 12A) to dark stouts and porters (4A, 8A, and 9A).
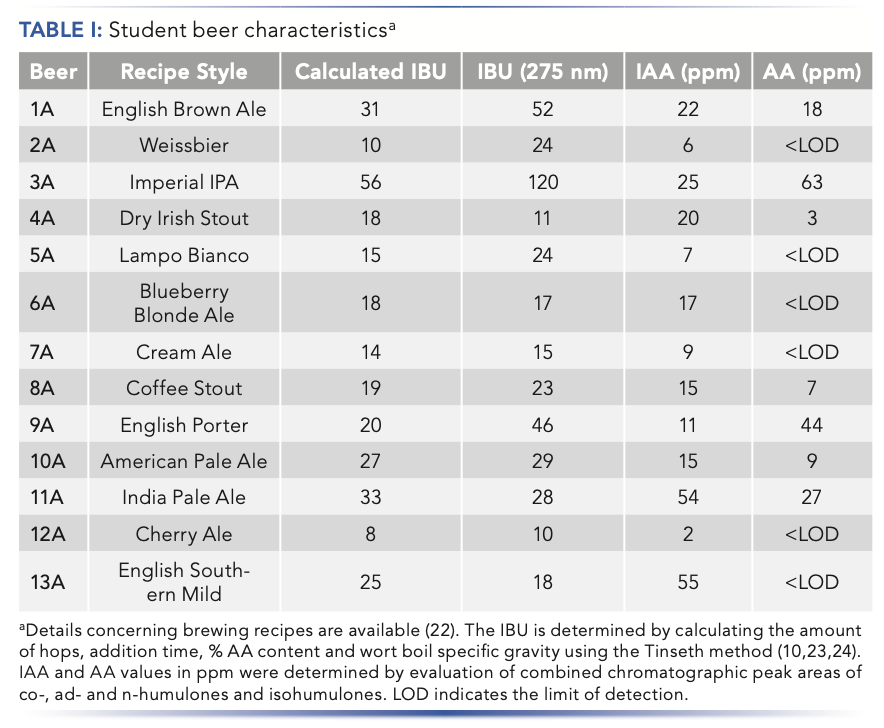
The hop addition sequence is very dependent on the specific recipe. Timing of hops addition during brewing and the amount added has a significant impact on the sensory taste profile of the final beer. Hops added at the beginning of the boil contribute to beer bitterness and undergo comparatively significant conversion from AA to IAA. Additions of hops near the end of the boil contribute to flavor and aroma, but have less impact on beer bitterness because of low levels of conversion of AA to IAA. The sugar concentration of the wort (boil gravity) also has an impact on extraction of AA with higher sugar concentration resulting in less incorporation of bittering components. Hops utilization can be modeled as a function of boil time and wort boil gravity and used to calculate IBU for specific recipes. The calculated IBU value was determined using the Tinseth method from published utilization tables and free online homebrew calculators (10,23,24).
Values of IBU were determined using the industry standard spectroscopic method (11,12). Absorption of an iso-octane extract of acidified, decarbonated beer at 275 nm can be related directly to IBU. For a number of the beer samples, the spectroscopic IBU showed significant deviation from the calculated value. This is not unexpected, because variations can occur because of age and storage of the hops as well as deviations from the brewing process. Aged or improperly stored hops can result in higher concentrations of oxidized products, such as humulinones, that can contribute both to higher UV absorbance of the isooctane extract and higher perceived bitterness in the beer (25). Four of the beer samples, English brown ale, weissbier, imperial IPA, and porter (1A, 2A, 3A, and 9A) exhibited significantly higher spectroscopic IBU measurements compared to the calculated values. The imperial India pale ale (IPA) showed the greatest UV absorption, resulting in an IBU of 120 compared to the calculated value of 48. The solubility of IAA in beer is dependent on the concentrations of sugars and pH but limited to approximately 100 ppm (26). In this case of beer 3A, the unusually high absorbance and IBU value indicates the presence of additional UV absorbent compounds.
Analysis of the beer samples by LC–MS was achieved using MISER. This provides visualization of all of the beer samples in one chromatographic output or "misergram" (20,21). The beer samples were filtered, degassed, and added to sample vials for direct injection and analysis by LC–MS (Figure 2). A single 120 min misergram of beer samples 1A–13A along with IAA and AA standards was obtained using SIM in negative ion mode at 361 m/z. It is worth noting that the chromatographic conditions employing a short column and strongly eluting mobile phase result in the coelution of the homologs co-humulone (MW 348), ad-, and n-humulones (MW 362). However, the isomeric AA and IAA are well resolved because of their inherently different physical properties. Therefore, we observe a single chromatographic peak for the homologs of IAA and a second more retained peak for the homologs of AA. The misergrams obtained from either set of negative parent ions (SIM at 347 or 361 m/z) are very similar in profile and useful for qualitative assessment of relative amounts of IAA and AA. The misergram is divided into 7-min intervals with vertical hash marks differentiating the results for each beer sample.
FIGURE 2: LC–MS “misergram” of isohumulones IAA and humulones AA using SIM at 361 m/z of student beers listed in Table I. The peaks are color coded with IAA shown in red and AA in blue. The last four samples were external standard (5, 10, 25, and 50 ppm) and were prepared in unhopped beer. Column: C18 Poroshell 120; 30 x 2.1 mm; 2.7 μm particle size. Mobile phase: 2 mM ammonium formate in acetonitrile:water (1:1); 0.20 mL/min. Injection: 5 mL sample injection of filtered, decarbonated beer. Injections were “stacked” during chromatographic run at 7-min intervals. LC–MS details are found in experimental section.
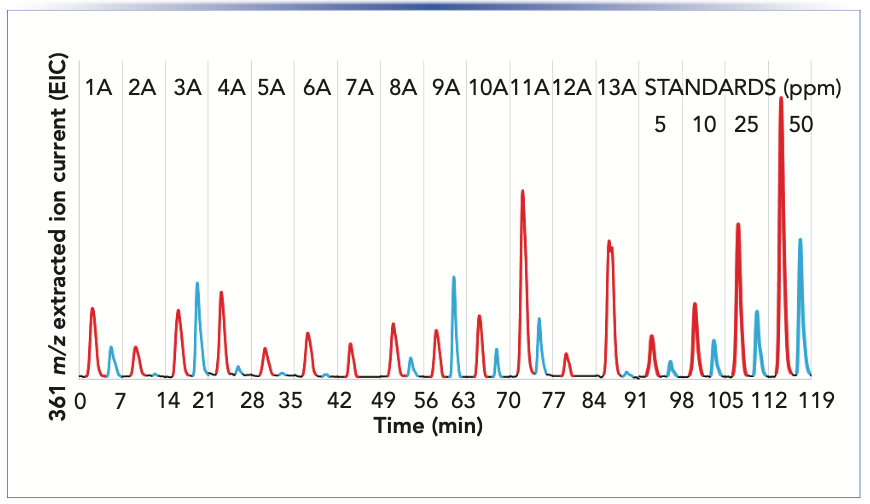
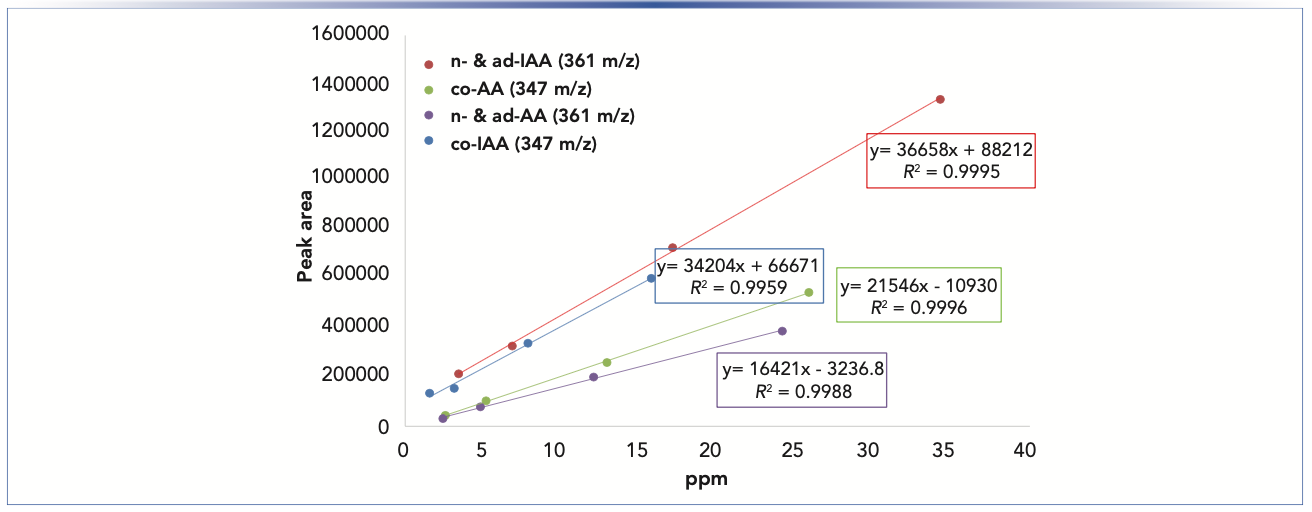
The IPA (11A) contains the greatest amount of IAA, while light ales 5A and 12A contain the least IAA. These chromatograms are also useful for assessing the utilization of hops or conversion of AA to IAA. Imperial IPA (3A) and English porter (9A) show low levels of utilization as reflected by greater residual amounts of AA. Both of these recipes (3A and 9A) included late hops additions during the boil, which would be expected to result in higher concentrations of un-isomerized AA. Quantitation of AA and IAA in each beer sample was determined by combined content of the individual homologs of co-, ad- and n-humulones and isohumlones, respectively. Comparison of each beer sample was made to the standard curves obtained from commercial samples of IAA and AA in unhopped beer, as shown in Figure 3. For instance, the total concentration of AA was obtained by the sum of the ppm concentrations of cohumulone (MW 348) and n-ad-humulone (MW 362) obtained from two separate LC–MS chromatograms. The content of all homologs of AA and IAA was obtained for each beer style using the summation the concentrations in ppm obtained from two misergram plots using SIM of 347 and 361 m/z (Table I).
FIGURE 3: Analysis of standard solutions of IAA and AA prepared in unhopped beer by SIM LC–MS operated in negative ion mode at m/z 347 and 361 for co- and n-/ad-isomers, respectively. Chromatographic conditions were identical to those used for beer samples (see details in Figure 2 caption).
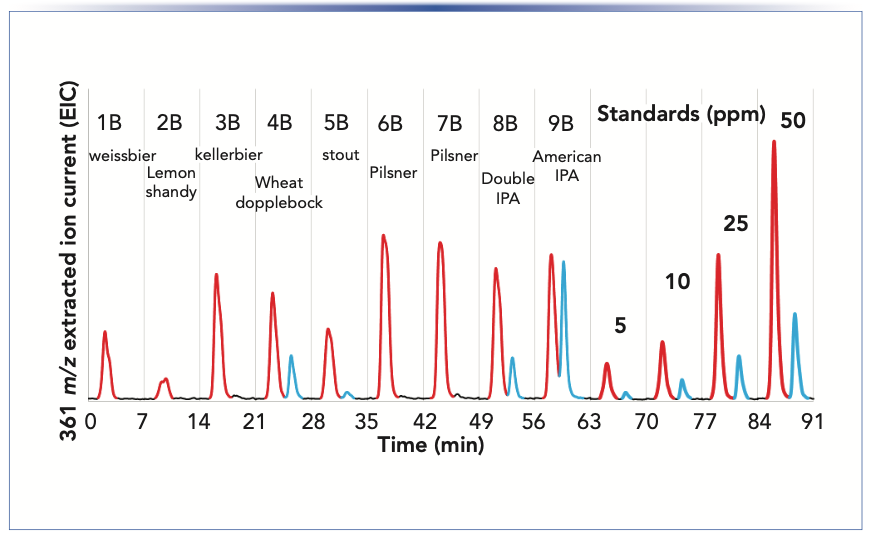
A set of beers was also collected from a local brewery for evaluation using MISER LC–MS (Figure 4). The sample set included a range of products from a lemon shandy prepared from a light lager and lemon soda (2B) to the more bitter pilsners (6B and 7B), double IPA (8B) and American IPA (9B). From this small set of nine beers, the American IPA (9B) shows the greatest amount of AA, as evidenced by the second peak (blue).
FIGURE 4: MISER LC–MS chromatogram of isohumulones IAA (red) and humulones AA (blue) using SIM at 361 m/z of craft beer samples. For chromatographic conditions: see Figure 2 caption.
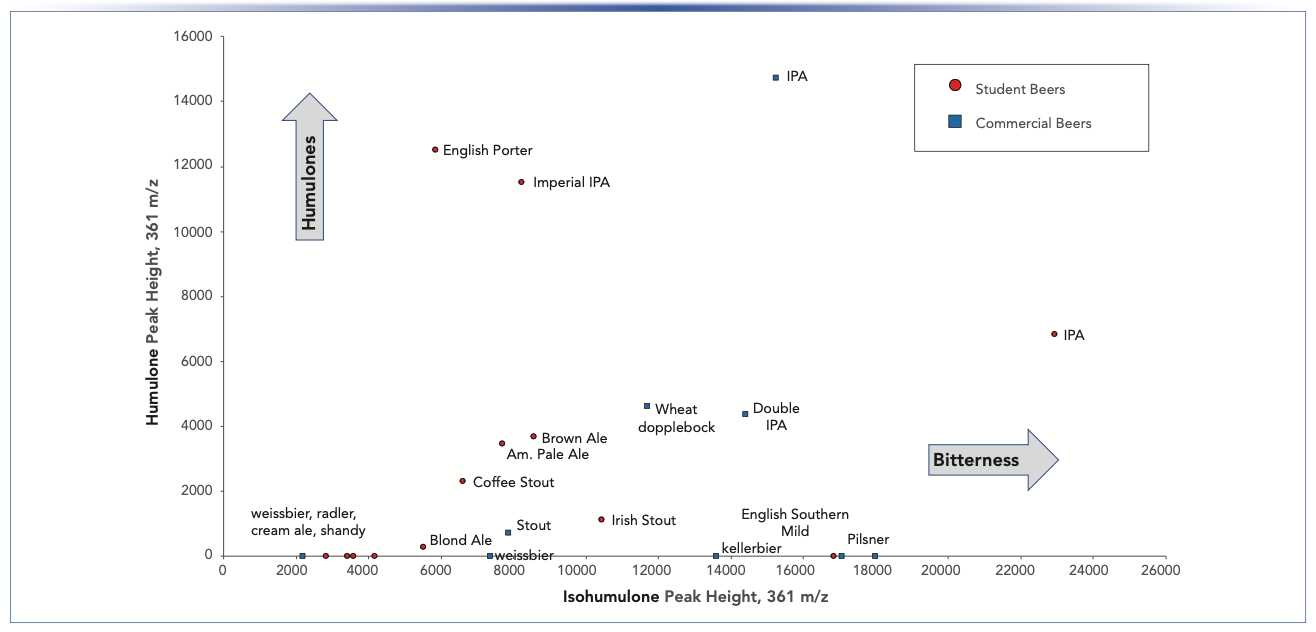
A comparison of peak heights of AA and IAA at 361 m/z in the MISER chromatograms (Figure 2 and 4) can also be displayed as a single scatter plot (Figure 5). This analysis is qualitative in nature because we are comparing peak heights rather than integration values and only the co- and n-IAA and AA at 361 m/z are displayed. However, the scatter plot provides useful visualization of two important aspects: 1) relative amounts of AA and IAA in different samples, and 2) ratios of AA/IAA in a single sample. Similar beer styles also appear as clusters that can help identify features of particular recipes. For example, commercial weissbeer (1B) and lemon shandy (2B), known to have low bitterness and very little hops aroma, appear in the lower left hand corner of the plot. A number of student beers (weissbeer 2A, lampo bianco 5A, cream ale 7A, and cherry ale 12A) were also characterized by its low bitterness and hops aroma, appearing in the same general area of the scatter plot. Using this scatter plot from both the student and commercial samples provides a comparison between our classroom recipes with standard beer styles.
FIGURE 5: Scatter plot of signal intensities for compounds IAA and AA from the combined set of student beers and craft beer samples shown in Figures 2 and 4, respectively.
Conclusions
The results of this investigation illustrate the utility of using multiple injections in a single chromatogram MISER coupled with single ion monitoring LC–MS to obtain graphical, qualitative analysis of humulones/isohumulones ratios (AA/IAA) in sample sets of beers. By comparison to standard curves obtained at both 347 and 361 m/z, it is possible to determine concentrations of the combined homologs of AA and IAA. The technique is rapid, allowing analysis of large sample sets with a minimum of sample preparation. A simple decarbonation and filtration is all that is required prior to transfer to HPLC sample vials. The method is also useful for monitoring the brewing process and hops utilization during the boiling of the wort. Components that interfere with the traditional UV spectroscopic determination of IBU are largely eliminated by SIM and chromatographic separation. The ability to view both AA and IAA concentrations allows direct comparison of hops utilization and the sequence of hops additions in beer brewing recipes.
Acknowledgments
We are grateful to the students who participated and prepared beer samples in the University of Missouri–St. Louis course, “Beer Brewing: Chemical & Biochemical Principles” (CHEM 1021). This three credit hour course is specifically designed to fulfill the Life/Natural Sciences requirement of undergraduate degrees in the College of Arts and Sciences.
References
(1) Brewer’s Association, Historical U.S. Brewery Count. https://www.brewersassociation.org/ statistics-and-data/national-beer-stats/
(2) Brewer’s Association, 2020 Brewers Association Beer Style Guidelines. https://www.brewersassociation.org/edu/brewers-association-beer-style-guidelines/
(3) L.C. Verhagen, in Comprehensive Natural Products II, Vol. 3 (Elsevier, Amsterdam, The Netherlands, 2010), pp. 967–997.
(4) C. Schoenberger and T. Kostelecky, T. J. Institute Brewing 117(3), 259–267 (2011).
(5) S. Hieronymus, For the Love of Hops: The Practical Guide to Aroma, Bitterness and the Culture of Hops (Brewers Publications: Boulder, Colorado, 2012).
(6) R. Barth, The Chemistry of Beer (John Wiley & Sons, Hoboken, New Jersey, 2013), pp. 153.
(7) V. Peacock, In Hop Flavor and Aroma: Proceedings of the 1st International Brewers Symposium, T.H. Shellhammer, Ed. (ASBC/ MBAA, Saint Paul, Minnesota, 2009), pp. 157–166.
(8) C.D. Hahn, S.R. LaFontaine, C.B. Pereira and T.H. Shellhammer, J. Agric. Food Chem. 66, 3505–3513 (2018).
(9) J.P. Maye, R. Smith, and J. Leker, Master Brewers Technical Quarterly 53, 23–27 (2016).
(10) J.J. Palmer, How to Brew, 4th Edition (Brewers Publications, Boulder, Colorado, 2017), the first edition is available free online: http://www.howtobrew.com (accessed Feb 2021).
(11) Beer-23: Beer Bitterness, in ASBC Methods of Analysis (American Society of Brewing Chemists, St. Paul, Minnesota, 14th Ed., 2016).
(12) R.A. Hunter and E.J. Dompkowski, J. Chem. Educ. 95, 2009–2012 (2018).
(13) M. Heidorn, J. Am. Soc. Brew. Chem. 71(3), 109–113 (2013).
(14) S. Schneider, Agilent Application Note: On-Site Quality Control of Beer, 2016. https://www.agilent.com/cs/library/applications/5991-3510EN.pdf
(15) A. Khatib, H.K. Kim, E.G. Wilson, and R. Verpoorte, J. Liq. Chrom. Rel. Tech. 29, 293–302 (2006).
(16) G. Vanhoenacker, D. DeKeukeleire, and P. Sandra, J. Chromatogr. A. 1035, 53–61 (2004).
(17) L. Ceslova, M. Holcapek, M, Fidler, J. Drstickova, and M. Lisa, J. Chromatogr. A. 1216, 7249–7257 (2009).
(18) D. Intelmann, G. Haseleu, and T. Hofmann, J. Agric. Food Chem. 57, 1172–1182 (2009).
(19) B.C. Hamper, K. Zawatzky, V. Zhang, and C.J. Welch, J. Am. Soc. Brew. Chem. 75(3), 333–338 (2017).
(20) C.J. Welch, X. Gong, W. Schafer, E.C. Pratt, T. Brkovic, Z. Pirzada, J.F. Cuff, and B. Kosjek, Tetrahedron: Asymmetry 21(13–14), 1674–1681 (2010).
(21) C.J. Welch, E.L. Regalado, C. Kraml, E.C. Welch, M.J. Welch, H. Semmelhack, D. Almstead, A.S. Kress, N.A. Hidalgo, and M.H. Kress, LCGC N. Am. 33, 262–269 (2015).
(22) B.C. Hamper and J.A. Meisel, J. Chem. Educ. 97(5), 1289–1294 (2020).
(23) Hop Utilization Page, Glenn’s Hop Utilization Numbers. https://www.realbeer.com/hops/ research.html (accessed Jan 2021).
(24) Bitterness (IBU) Calculator, Hopsteiner: Determine Bitterness for your Beer. https://www.hopsteiner.com/ibu-calculator/ (accessed Jan 2021).
(25) J.P. Maye and R. Smith, Master Brewers Assoc. Am. Tech. Quarterly 53(3), 134–136 (2016).
(26) M. Mosher and K. Trantham, Brewing Science: A Multidisciplinary Approach (Springer, Cham, Switzerland, 2017), pp. 252–255.
ABOUT THE AUTHORS
Bruce C. Hamper, Nicholas Viriyasiri, Aaron Boland, Lorna Espinosa, Hunter J. Campbell, and Michael McKeever are with the Department of Chemistry and Biochemistry at the University of Missouri–St. Louis in St. Louis, Missouri. Kurt Driesner is with the Urban Chestnut Brewing Company in St. Louis, Missouri. Direct correspondence to: hamperb@umsl.edu
Analytical Challenges in Measuring Migration from Food Contact Materials
November 2nd 2015Food contact materials contain low molecular weight additives and processing aids which can migrate into foods leading to trace levels of contamination. Food safety is ensured through regulations, comprising compositional controls and migration limits, which present a significant analytical challenge to the food industry to ensure compliance and demonstrate due diligence. Of the various analytical approaches, LC-MS/MS has proved to be an essential tool in monitoring migration of target compounds into foods, and more sophisticated approaches such as LC-high resolution MS (Orbitrap) are being increasingly used for untargeted analysis to monitor non-intentionally added substances. This podcast will provide an overview to this area, illustrated with various applications showing current approaches being employed.
Extracting Estrogenic Hormones Using Rotating Disk and Modified Clays
April 14th 2025University of Caldas and University of Chile researchers extracted estrogenic hormones from wastewater samples using rotating disk sorption extraction. After extraction, the concentrated analytes were measured using liquid chromatography coupled with photodiode array detection (HPLC-PDA).
Silvia Radenkovic on Building Connections in the Scientific Community
April 11th 2025In the second part of our conversation with Silvia Radenkovic, she shares insights into her involvement in scientific organizations and offers advice for young scientists looking to engage more in scientific organizations.


