What Can Two-Dimensional Liquid Chromatography Offer the Pharmaceutical Industry?
Special Issues
The evolution of two-dimensional liquid chromatography (2D-LC) instruments along with improved software capabilities has transferred 2D-LC from the hands of experienced researchers to functioning analytical laboratories in the pharmaceutical industry. 2D-LC offers chromatographers novel solutions to problems ranging from analyzing complex samples requiring excessively large peak capacities to separating simple compounds that are difficult to resolve. Recent developments in 2D-LC and 2D-LC–MS have demonstrated the potential of this technique in practice and 2D-LC is set to become an essential tool in the pharmaceutical sector to address problems ranging from coelution, peak purity assessment, simultaneous achiral-chiral analysis, genotoxic impurities, and more.
The evolution of two-dimensional liquid chromatography (2D-LC) instruments along with improved software capabilities has transferred 2D-LC from the hands of experienced researchers to functioning analytical laboratories in the pharmaceutical industry. 2D-LC offers chromatographers novel solutions to problems ranging from analyzing complex samples requiring excessively large peak capacities to separating simple compounds that are difficult to resolve. Recent developments in 2D-LC and 2D-LC–MS have demonstrated the potential of this technique in practice and 2D-LC is set to become an essential tool in the pharmaceutical sector to address problems ranging from coelution, peak purity assessment, simultaneous achiral-chiral analysis, genotoxic impurities, and more.
The pharmaceutical industry is one of the most regulated industries because the pharmaceutical products have to be safe and efficacious. From a chemistry, manufacturing and controls (CMC) perspective, the level of actual and potential impurities and degradation products in active pharmaceutical ingredients (APIs) and drug products has to comply with International Conference on Harmonization (ICH) guidelines to ensure quality and safety. According to ICH guidelines, the reporting, identification, and qualification thresholds for the impurities in APIs are 0.05%, 0.10%. and 0.15%, respectively, assuming a maximum daily dose of less than 2 g of drug substance (1). In the case of a chiral drug substance developed as a single enantiomer, the enatiomeric purity has to be controlled because there have been cases of severe adversity resulting from inadequate control of undesired enantiomers (2–3). Additionally, genotoxic impurities constitute another class of impurities that have to be limited to low parts per million (ppm) based on daily dosing and duration of exposure, making it extremely challenging to analyze (4).
High performance liquid chromatography (HPLC) with a diode array detector (DAD) and mass spectrometry (MS) has been the technique of choice to assess the chemical purity of drug substances and drug products. DAD relies on comparing the UV profile of the main component at multiple time points (front, apex, and tail of peak) to assess peak purity and cannot discern small spectral differences between structurally similar compounds that are often comparable, especially ones coeluting in proximity to the main component. Similarly, MS cannot differentiate or detect coeluting isomers (isobaric) and neutral compounds, as a result of spectral similarity and poor ionization, respectively. In addition, ion suppression of minor components in the presence of major components can significantly limit MS detection capabilities even if the spectra are distinct. Recently, the advantages and disadvantages of assessing potential coelution (peak purity) in LC using chromatographic data system software, and the use of multivariate curve resolution and two-dimensional liquid chromatography (2D-LC) were published in a series of three articles in LCGC (5–7).
In general, developing chromatographic methods of the desired selectivity and sensitivity to resolve structurally similar impurities such as regioisomers, desâhalogenated and nitroâsubstituted APIs, and degradation products from the API can be challenging because they often elute close to the main component. Additionally, the ageing of the chromatographic columns, the long-term impact of modifiers, and minor changes to column chemistry by vendors could impact column selectivity. This could sometimes result in the resolution of previously coeluting impurities during the longâterm stability of the drug substance or drug product. This could have a significant bearing on the clinical programme with new unqualified impurities or degradants in the drug substance or drug product. Similarly, assessing chiral purity of the API with multiple chiral centres can be a daunting task. Considering these challenges, it is surprising that the pharmaceutical industry is just beginning to adopt and embrace 2D-LC–MS. In the past few years, several applications of 2D-LC in pharmaceutical analysis have been reported and are beginning to change the landscape (8–21). Dwight Stoll et al. captured the recent advances in 2D-LC for pharmaceutical and biopharmaceutical analysis in LCGC North America (22). The following article presents several applications of 2D-LC and 2D-LC–MS in the pharmaceutical industry.
Results and Discussion
Application 1: Simultaneous Achiral-Chiral Analysis by 2D-LC–MS: Developing a chiral HPLC method of the desired selectivity and sensitivity for an API with multiple chiral centres can be challenging because the number of potential stereoisomers increases by 2n, where n is the number of chiral centres. In addition, the chiral HPLC method should have selectivity for the desired enantiomer and other stereoisomers from process-related impurities such as a des-halogenated API or a nitroâsubstituted API. 2D-LC can offer a simple, yet effective, solution for these challenging problems. Some of the earliest adoption of 2D-LC in the pharmaceutical industry has been for the analysis of chiral pharmaceuticals (17,23–24).
Results of the simultaneous achiralâchiral analysis of an API with three chiral centres are presented in Figure 1. A 2D-LC–MS method was developed to overcome the shortcomings of one-dimensional (1D) chromatography. The primary achiral column resolves the API (and its enantiomer) from potential diastereomers and process-related impurities, whereas the secondary chiral column resolves the desired enantiomer (RRR) from undesired enantiomer (SSS). A single heartâcut of the primary column eluent highlighted in Figure 1 (dashed box) was transferred to the chiral secondary column to resolve the enantiomers. By presenting a simple mixture to the secondary chiral column, components of interest were baseline resolved. Attaining similar separation (resolution of potential stereoisomers and processârelated impurities from the desired API) would be impractical by oneâdimensional chiral chromatography. Using 2D-LC, the enantiomer excess (ee) was determined with ease: 99.8%. Since enantiomers perfectly coelute (are unresolved) on the achiral column, a single heart-cut around the peak apex is adequate to determine the %ee. We demonstrated the comparability and appropriateness of single heart-cutting 2D-LC to selective comprehensive 2D-LC and conventional HPLC in our earlier work on simultaneous, sequential quantitative achiral-chiral analysis (17). For projects in early stages of development with multiple chiral centres, we have been using 2D-LC–MS to assess enantiomer purity until a conventional HPLC method(s) of desired selectivity is developed. We have also successfully coupled reversed-phase HPLC with normal-phase supercritical fluid chromatography (SFC) (2DâLC–SFC) to enable simultaneous achiralâchiral analysis of compounds with multiple chiral centres, extending the capability of multidimensional separation as the majority of chiral compounds are amenable to normal phase chiral chromatography (18).
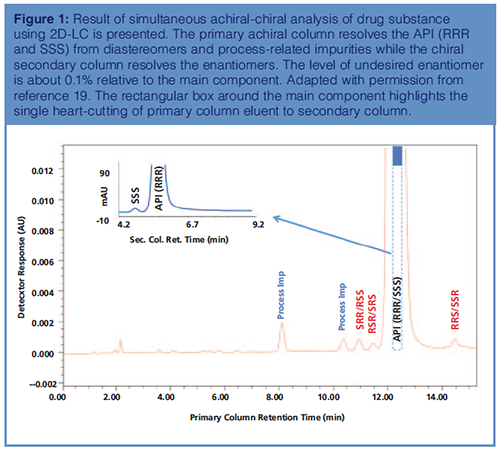
Recently, we encountered a scenario where differences in cellâkilling assay were observed between GMP and GLP tox lots of linker drug intermediates (LDIs) impacting the regulatory filing. We used 2D-LC–MS to determine the enantiomer purity of GMP and GLP tox lots, a potential cause for the anomaly in cell-killing assay. Unlike the example shown in Figure 1, where the four-diastereomer pairs are baseline resolved in an achiral column, in the case of an LDI with three chiral centres, only two of the four-diastereomer pairs would be resolved in the achiral column, as a result of structural similarities. Similarly, the chiral chromatography lacked selectivity and specificity to resolve stereoisomers and process-related impurities thereby limiting its applicability. Using achiralâchiral 2D-LC–MS, two of the four diastereomers were resolved in the primary dimension and the primary column peaks were sampled into a chiral HPLC column for further separation. The secondary chiral HPLC column resolved each peak into four individual stereoisomers (results not presented). In this example, although the individual dimensions had limitations, by effectively coupling the two dimensions, chiral purity of LDI was determined. The 2D-LC–MS results along with other test results demonstrated the comparability of the two lots (GMP and GLP) to enable successful regulatory filing.
Application 2: Addressing the Dynamic Range Issue with 2D-LC: Realizing complementary or orthogonal separation in reversed-phase 2D-LC–MS requires columns of different selectivity and different operating conditions. In reversedâphase LC, finding complementary columns of different selectivity, especially for structurally similar compounds, can be challenging because hydrophobic interaction usually dominates the separation and differences in column chemistries are usually inadequate to resolve structurally similar compounds. There are examples where the same column chemistry could be used in both dimensions to resolve the coeluting components, although the separation is not orthogonal (19). Figure 2(a) shows overlay plots of diluent blank and three sample components. When the relative levels of the sample components are comparable, they are baseline resolved. However, as the concentration of component #2 is increased by a 1000-fold relative to other components, the resolution between component #2 and component #3 is lost. This is a common problem encountered in the pharmaceutical industry where the relative level of main component to potential impurities differs by several orders of magnitude, which obscures the detection of minor components. Given the structural similarity, the peakâpurity tools commonly used in HPLC with a diode array detector or a mass spectrometer are often inadequate to discern residual coeluting impurities. However, because the relative level of the coeluting impurities and the main component at the peripheral of the abundant peak are comparable, re-injecting fractions of the abundant peak (front and or tail) could resolve these coeluting components. The dynamic range issue commonly encountered in the pharmaceutical industry can be readily addressed using 2D-LC, a simple yet powerful application with significant bearing.
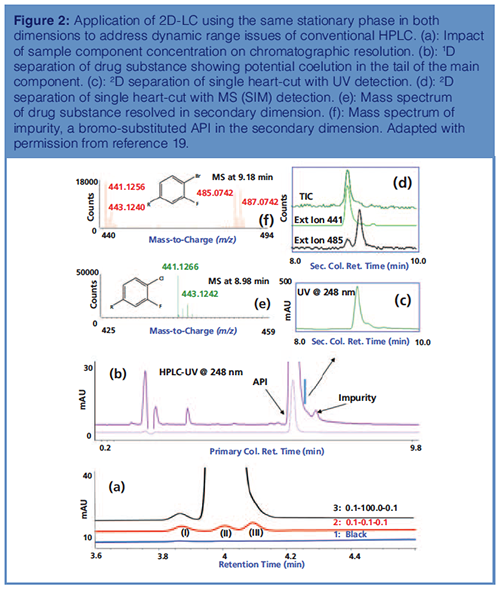
A real-world application involving same column chemistry using 2D-LC is shown in Figure 2. The 1D separation of the API on a 15 cm × 4.6 mm, 3-μm cyano column at 248 nm is shown in Figure 2(b). Careful assessment of the chromatogram shows a shoulder peak in between the API and the impurity peak in the tail of the main component. A single fraction of the primary column eluent (100 μL) corresponding to the elution of the potential impurity was transferred to a 5 cm × 3.0 mm, 1.8-μm cyano 2D column. The 2D chromatogram of the transferred fractions (UV and MS) shows partial separation of the API and the impurity as the relative level of the two components is comparable (~10:1) as demonstrated in Figures 2(c) and 2(d). This is more obvious in the extracted ion chromatogram shown in Figure 2(d). Based on MS data (timeâof-flight [TOF]), the peak eluting at retention time 8.98 min corresponds to the API with M+H ion of 441.12 [Figure 2(e)], whereas the MS of the peak eluting at 9.18 min is a bromoâsubstituted API (Figure 2[f]). The bromo- and chloro-substituted API was inferred by comparing the relative intensities of M+1 and M+3 ion. For the API (Figure 2[e]), the intensity of M+3 ion is about one third of M+1 ion, thus confirming the presence of a single chloro-substituent in the API, whereas for the bromo-substituted API (Impurity, Figure 2[f]), the relative intensity of the M+1 and M+3 ions are comparable, suggesting the presence of the bromoâsubstituent. The bromoâimpurity originates from the regulatory starting material (RSM, 5-chloro, 2,4-difluorobenzoic acid) and if its level is not controlled, it undergoes similar chemistry as the RSM and is difficult to purge in the downstream manufacturing process. Controlling the level of bromoâimpurity in the RSM is critical in limiting the formation of bromoâsubstituted API impurity in the drug substance. Upfront monitoring of the RSM by 2D-LC for structurally similar impurities, including isomers using similar columns, is a prudent approach in limiting the formation of difficult to purge impurities downstream. The above example is a simple, yet effective, application of 2D-LC–MS to resolve and identify potential coeluting impurities in the RSM and API. This strategy could also be used to assess the stabilityâindicating method for potential coeluting impurities, either in the front or tail of API peaks as some of these impurities could potentially grow during stability (degradation products) and show up during long-term stability with the ageing or modification of chromatographic columns or as a result of small changes to column chemistry deemed trivial by vendors.
Application 3: High-Resolution Analysis of Linker Drug Intermediates (LDIs) Used in Antibody-Drug Conjugates (ADCs) Using 2D-LC–MS: The following example demonstrates the application of selective comprehensive 2D-LC–MS analysis of extremely complex LDIs used in the synthesis of ADCs, selective modern chemotherapeutics often used along with radiotherapy and chemotherapy treatments. The unique selectivity of the antibody is exploited to deliver the drug (toxin) to the targeted cells that upon internalization results in the drug release (toxin) directly into the cytoplasm, killing the cancerous cells.
Synthesis of linker drugs, a key intermediate in ADCs, is extremely challenging because it is a multistep process involving more than 20 chemical transformations. The relatively high-molecular-weight of LDIs (over one kDa), the high reactivity, and chemical instability make it challenging, if not impossible, to analyze the structurally similar compounds coeluting with the main compound. Furthermore, significant differences in the concentration ranges of potential impurities relative to the LDI (~ two or more orders of magnitude) aggravates the issue. Upfront control of impurities in LDIs is extremely critical because many of these impurities could potentially conjugate with the antibody in the downstream process and could be difficult to purge and analyze.
Developing a chromatographic method for the LDI was challenging because excessive tailing at low pH and chemical instability at high pH limited the practical pH range of the method from 4.5 to 8.0. A gradient HPLC method was developed on a 15 cm × 3.0 mm, 2.7-μm superficially porous C3 column using 5-mM phosphate buffer at pH 7.0 and acetonitrile. Compared to C8 and C18 stationary phases, a short chain C3 column offered the desired selectivity and retention for hydrophobic LDI, enabling their elution with relatively low organic content. A 2D-LC method was developed using a C3 column in the primary and a C18 column in the secondary dimension. Among various columns assessed in the second dimension, the C18 column offered good peak shape and resolution. The 2D-LC system was operated in high-resolution sampling (HRS) mode enabling complete transfer of the main component to the complementary secondary column.
A 2D-LC separation of three lots of LDIs is shown in Figure 3. The overlay plots of the blank and three sample lots in the primary dimension (Figure 3[a]) show lotâtoâlot variability, with the purity of the main component ranging from 88.6% to 94.5% (20). The complexity of LDIs is obvious from these chromatograms with several sample components either coeluting or being partially resolved from the main component. Changing the column selectivity or its operation did not improve the overall separation. The fractions of primary column eluent transferred to the secondary column using HRS is highlighted in Figure 3(a) with a blue rectangle. The full-scale and expanded 2D separations are shown in Figures 3(b) and 3(c), respectively. Although the fractions were analyzed in reverse order of parking, the results are presented in the order sampled to enable better visualization and interpretation of the results. The overlay plots of the three development lots show lot-toâlot variability, with over 15 coeluting peaks resolved from the main component in sample lot #3. Based on 2D peak shapes, some of the resolved components are probably multiple components substantiating the analytical challenges and sample complexity. The blank chromatogram shows carryover of the main component in some of the fractions from previous injections. As expected, the resolving power of 2D-LC is much pronounced in the contour plots of the sample shown in Figure 3(d) to 3(f) (bottom), where each spot represents a sample component.
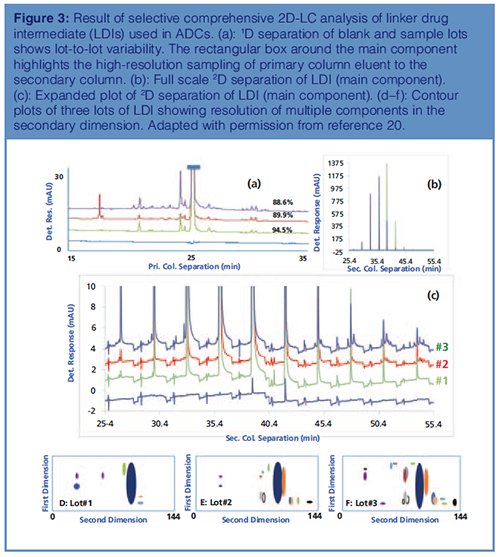
With the exception of an impurity in sample lot #3, the levels of other impurities were below 0.05%. Effective peak focusing and highâspeed separation in the secondary dimension resulted in sharper peaks in the secondary dimension, resulting in lower detection limits.
The secondary dimension purity of the main component ranged from 99.57% to 99.93%, resulting in an overall purity of 88.25% to 94.47% for the LDI. The overall purity of the main component is determined from the product of primary and secondary dimension peak purity.
Using 2D-LC–MS, we were able to assess lot-to-lot variability of development lots with good precision and detection limits well below 0.01%. These levels are well below the limits mandated by ICH guidelines. This application clearly demonstrates the power of 2D-LC in detailed characterization of structurally similar, coeluting impurities in LDI that is impractical by conventional 1D-LC.
Repeatability of 2D-LC Separation of Linker Drug Intermediate Used in ADCs: Repeatability of 2D-LC is often questioned because of the complexity in the design and operation of the 2D-LC system with multiple valves including the parking deck(s). To demonstrate the repeatability of 2D-LC, an aged sample of LDI was prepared in triplicate and analyzed. The results of this study are presented in Figure 4. The expanded and fullâscale 2D separations are shown in Figures 4(a) and 4(b), respectively. Stack plots of replicate sample analysis are shown in Figures 4(c), 4(d), and 4(e). From these chromatograms, it is obvious that the 2D-LC separation of LDIs is reproducible with the multiple valves in sync between runs. The %RSD for the main component from triplicate injections of the sample was less than 0.1%, which is comparable to conventional LC separation.
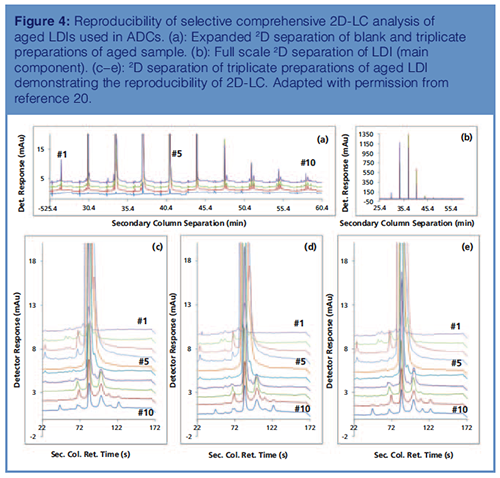
Additionally, the absolute difference in the percentage peak areas of impurities less than 0.1% was within +/-0.01 and for impurities greater than 0.1% was within +/-0.02, demonstrating the reproducibility of 2D-LC for the quantitative analysis of complex linker drug intermediates. Effective peak focusing resulted in enhanced sensitivity in the secondary dimension (20).
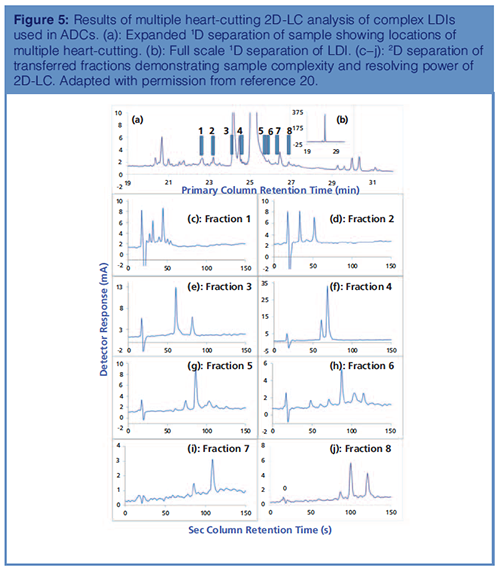
Assessing Sample Complexity Using 2D-LC–MS: The resolving power of 2D-LC–MS in the analysis of complex LDIs is highlighted in Figure 5, where multiple heartâcutting from the primary column was analyzed using a complementary stationary phase in the secondary dimension. What appears to be partially resolved components in the primary dimension is resolved into multiple components in the secondary dimension. This is most obvious in fractions 1 and 6. Most of these impurities are well below 0.05%, the reporting level mandated by the health authorities. Resolving these many components using 1D-LC would be impossible, which demonstrates the power and practicality of 2D-LC (20).
Application 4: Ultra-Trace Analysis of Genotoxic Impurities by 2D-LC–MS: Genotoxic impurities (GTIs) are an important class of compounds, which when present in drug substances could significantly impact patient safety and health by binding to the DNA or protein, causing gene mutation. The levels of these impurities need to be controlled to low ppm as mandated by ICH M7 guidance based on duration of exposure and daily dosing of drug product (4).
Given the significant differences in the volatility, reactivity, and polarity of these compounds, the analysis of GTIs is extremely challenging. This is further compounded by relatively high concentrations of the sample (mg/mL). Compared to conventional impurities that are often limited to a few tenths of a percentage in a drug substance, the GTIs have to be limited to low ppm, therefore requiring techniques of high selectivity and specificity like LC or gas chromatography (GC) coupled to highâend mass spectrometry.
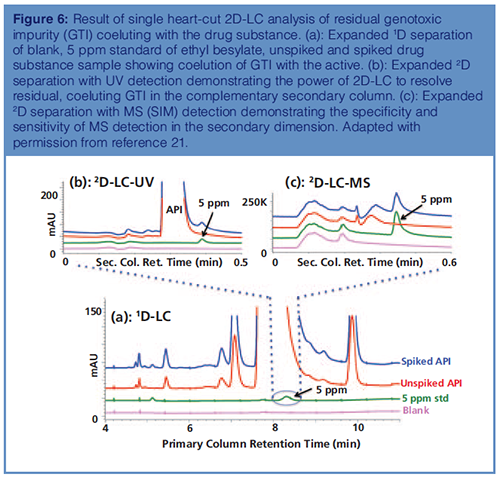
Application of 2D-LC–MS in the analysis of ethyl besylate, a potential GTI, is shown in Figure 6. Ethyl besylate coelutes with the API in the primary column (Figure 6[a]) but is resolved in the complementary secondary column. The results of LC–UV and LC–MS detections are shown in Figures 6(b) and 6(c). Compared to UV, MS with selective ion monitoring (SIM) offers both sensitivity and specificity for residual GTIs, eliminating the impact of the API peak present at much higher concentrations (21).
Conclusions
Several applications of 2D-LC–MS in “real-world” pharmaceuticals have been demonstrated, ranging from simultaneous achiral-chiral analysis of an API with multiple chiral centres, to addressing dynamic range issues commonly encountered in API analysis, to assessing peak purity of complex LDIs with several coeluting impurities in the midst of the main component, to residual GTI analysis (ppm). These examples highlight the challenges commonly encountered in the pharmaceutical industry along with simple, yet novel, solutions provided by 2D-LC. The key attributes of 2D-LC separation, such as linearity, precision, accuracy, detection, and quantitation limits, are comparable to conventional HPLC. This is critical for the transitioning of 2D-LC from R&D to a GMP environment. The misnomer that the application of 2D-LC is limited to complex samples has also been addressed. In reality, 2D-LC can also provide novel solutions to simple but challenging problems that are difficult to address by conventional HPLC. The advent of active solvent modulation should enable easier coupling of “difficult-to-couple” separation mechanisms as a result of solvent mismatch between the two dimensions. For example, reversed phase and hydrophilic interaction chromatography (HILIC), or sizeâexclusion (SEC) and reversed phase chromatography. Additionally, with 2D-LC it is practical to use an MS-incompatible mobile phase in the primary dimension. In conclusion, the author believes it is a matter of “when” and not “will” 2D-LC and 2D-LC–MS dominate contemporary chromatography to provide novel solutions to the increaasing challenges and needs of the pharmaceutical and other industries.
Acknowledgements
The author would like to thank M. Al-Sayah, S.R. Huang, Ila Patel, Jacob Kay, and Larry Wigman for their contributions, and Genentech Inc., for its continued support and opportunity
References
- International Conference on Harmonization, Impurities in New Drug Substances Q3A (R2), (ICH, Geneva, Switzerland, 2017).
- N. Chhabra, M. Aseri, and D. Padmanabhan, Int. J. Appl. Basic Med. Res.3(6), (2013).
- S.K. Teo, W.A. Colburn, W.G. Tracewell, K.A. Kook, D.I. Stirling, M.S. Jaworsky, M.A. Scheffler, S.D. Thomas, and O.L. Laskin, Clin. Pharmacokinet.43, 311–327 (2004).
- International Conference on Harmonization, Assessment and control of DNA reactive (mutagenic) impurities in pharmaceuticals to limit potential carcinogenic risk M7 (R1) (ICH Geneva, Switzerland, 2017).
- S.C. Rutan, C.J. Venkatramani, and D.R. Stoll, LCGC Europe31(2), 74–81 (2018).
- D.W. Cook, S.C. Rutan, C.J. Venkatramani, and D.R. Stoll, LCGC Europe31(6), 318–324 (2018).
- D.R. Stoll, C.J. Venkatramani, and S.C. Rutan, LCGC North America36(6), 356–361 (2018).
- P. Sandra, G. Vanhoenacker, M. Steenbeke, F. David, K. Sandra, C. Brunelli, and R. Szucs, LCGC Europe29(11), 610–617 (2016).
- G. Vanhoenacker, I. Vandenheede, F. David, P. Sandra, and K. Sandra, Anal. Bioanal. Chem. 407, 355–366 (2015).
- Y. Li, C.D. Medley, K. Zhang, L. Wigman, and N. Chetwyn, J. Pharmaceut. Biomed.92, 114–118 (2014).
- I.A. Haidar Ahmad, A. Blasko, A. Clarke, and S. Fakih, Chromatographia81, 401–418 (2018).
- C.L. Barhate, E.L. Regalado, N.D. Contrella, J. Lee, J. Jo, A.A. Makarov, D.W. Armstrong, and C.J. Welch, Anal. Chem.89, 3545–3553 (2017).
- L. Dai, G.K. Yeh, Y. Ran, P. Yehl, and K. Zhang, J. Pharm. Biomed. Anal. 137, 182–188 (2017).
- Y. Li, C. Gu, J. Gruenhagen, K. Zhang, P. Yehl, N.P. Chetwyn, and C.D. Medley, J. Chromatogr. A, 1393, 81–88 (2015).
- Y. Li, D. Hewitt, Y. Lentz, J. Ji, T. Zhang, and K. Zhang, Anal. Chem.86, 5150–5157 (2014).
- J.G. Shackman and B.L. Kleintop, J. Sep. Sci.37, 2688–2695 (2014).
- C.J. Venkatramani, L. Wigman, K. Mistry, and N. Chetwyn, J. Sep. Sci. 35, 1748–1754 (2012).
- C.J. Venkatramani, M. Al-Sayah, G. Li, M. Goel, J. Girotti, L. Zang, L. Wigman, P. Yehl, and N. Chetwyn, Talanta148, 548–555 (2016).
- C.J. Venkatramani, J. Girotti, L. Wigman, and N. Chetwyn, J. Sep. Sci.37, 3214–3225 (2014).
- C.J. Venkatramani, S.R. Huang, M. Al-Sayah, I. Patel, and L. Wigman, J. Chromatogr A1521, 63–72 (2017).
- C.J. Venkatramani and M. Al-Sayah, Amer. Phar. Review17(5), (2014).
- D.R. Stoll and T.D. Maloney, LCGC North America35(9), 680–687 (2017).
- K.R. Ing-Lorenzini, J.A. Desmeules, M. Besson, J. Veruthey, P. Dayer, and Y. Dalli, J. Chromatogr. A1216(18), 3851–3856 (2009).
- L. Silan and P. Jadaud, J. Chromatogr.532(2), 22–36 (1990).
C.J. Venkatramani is a senior scientist at Genentech USA and has more than 15 years experience in the pharmaceutical industry. He was a key member of the Genentech technical team instrumental in the successful launch of Genentech’s first small molecule, Erivedge, leading from development to commercial. Erivedge is currently approved in several countries around the world for the treatment of advanced basal cell carcinoma (BCC). His area of interest includes 2D-LC, 2D-LC-SFC, and ultratrace analysis of geneotoxic impurities. Over the years, he has successfully used multidimensional chromatography to address challenging problems encountered in the pharmaceutical industry.


.png&w=3840&q=75)

.png&w=3840&q=75)


.png&w=3840&q=75)


.png&w=3840&q=75)


