Valves for Gas Chromatography: Fundamentals
LCGC North America
The first installment in this series on valves presents basic concepts, applications, and implementations.
Chromatographers have employed valves for sample injection and flow redirection since the beginnings of gas chromatography (GC). In this issue, John Hinshaw begins a series of articles on valves for GC.
Analysts have employed valves in gas chromatography (GC) since its beginnings. Today, requirements for precise control of gas streams are much more stringent than they were at the onset. From simple gas-sampling valves to electronic pressure control and flow-switched GC×GC modulators, valving and flow switching systems play a crucial role in any modern GC instrument. This "GC Connections" series on valves for gas chromatography will review and examine some of the ways in which valves enable classical as well as leading-edge applications. The first installment presents some basic concepts, applications, and implementations.
Why Use a Valve?
Chromatographers did not always use the gas-sampling valves that are familiar to modern practitioners. The early pioneers of column-based gas separations — but not necessarily partition GC as we know it today — used instruments that were self-built out of laboratory glass and tubing. Any valves that were employed were simple two- or three-way stopcock types that controlled gas direction and flow. In modern elution chromatography a discrete sample is introduced into the column to start a separation, but the early gas separation systems used displacement or frontal elution. A relatively large sample of 1 L or more was adsorbed onto the head of a column and then was displaced with a heavy solvent or with mercury vapor. The requirement to inject a defined sample plug that would generate discrete narrow peaks came with the development of GC — albeit based on retention by adsorption–desorption — in the second half of the 1940s at the University of Innsbruck, Austria, by E. Cremer and F. Prior. Their system used a collection of stopcock valves to introduce a discrete gas sample into a column that then produced recognizable peaks under carrier gas flow. In some other systems of that time a calibrated gas burette provided a measured sample volume; others used crude sample vaporizing inlets. It was not until commercial gas chromatographs became available in the early to mid 1950s that the first modern gas-sampling valves appeared (1). These were of two types: a rotating tubular valve that has largely disappeared today, and the more familiar concentric rotary valve that now predominates.
The ability to switch gas streams as well as use interchangeable sample loops to inject small sample volumes with a single movement of a valve actuator ensured the rapid adoption of dedicated gas-sampling valves nearly 60 years ago. A high degree of repeatability along with very low dead volumes and nonexistent sample carryover made the valves ideally suited for the (then) narrower 1/4- and 1/8-in. coiled columns. In the time since, rotary valves have undergone significant development in material, construction, and application range — including their crossover to liquid chromatography (LC) applications — but they remain fundamentally the same and would easily be recognizable today by the chromatographers of that time.
Other classes of flow switching devices and applications arose later, in the 1960s and onward. These can be divided into two groups. First came the onset of devices that would lead eventually to what today we take for granted in electronic pressure control (EPC) and related systems. Second was the development of fluidic switching devices, often attributed to David Deans, that have made possible multidimensional and comprehensive GC×GC as well as a number of interesting ancillary flow switching applications. Work in these last areas currently occupies much of the ongoing research in GC; this series will finish with a discussion on the topic. Now let's get started with a look at the basics of rotary valves and their applications.
Gas Stream Switching Applications
Two types of gas stream-switching applications will serve to sketch the capabilities of rotary gas valves. There are many other possibilities for combinations of multiport valves, columns, inlets, and detectors. This brief introduction will pave the way for a look at some more involved applications in the next installment of this series.
Detector switching: One of the simplest valved applications is switching the outlet of one column between two detectors. Such a scheme might be used, for example, to change from thermal conductivity detection (TCD) of early, nonhydrocarbon peaks eluted from a porous polymer or molecular sieve column to using more sensitive flame ionization detection (FID) for later hydrocarbon peaks. Figure 1 illustrates a connection diagram for switched detectors. In Figure 1a a single pressure controller supplies carrier gas to a column and to a matched restrictor. The column exit is routed to the TCD system and the restrictor is connected to the FID system. The restrictor provides roughly the same flow rate as the column during isothermal or temperature-programmed operation, which minimizes flow-related detector baseline upsets caused by switching between detectors. An injection device such as a sample loop or heated inlet, located between the carrier gas source and the column, has been omitted to simplify the illustration.
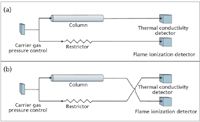
Figure 1: Schematic diagram of detector selection by flow switching.
In Figure 1b the detector connections have been switched. The column eluant now flows to the FID system and the restrictor to the TCD system. Peaks eluted from the column will be directed to the FID system until the detector flows are switched back to their original positions. So, early peaks such as nitrogen, oxygen, or carbon dioxide could be detected by TCD, and later peaks such as methane, ethane, and higher hydrocarbons could be detected by FID. Little baseline upset would be expected when switching because the matched restrictor would provide about the same carrier gas flow rate as the column. Of course, if the detectors were switched mid-peak then the signals would change abruptly.
An implementation of this detector switching scheme can be realized with a multiport rotary valve. Figure 2 shows an exploded view of the inner parts of a simplified six-port rotary valve. The valve consists of a stationary body with small holes on a highly polished surface drilled through to zero-dead-volume connections that are positioned around the periphery of the valve body. A rotating valve core with three cut-away slotted arcs is pressed onto the stationary body and is made to rotate back and forth between two positions, driven by an external actuator shaft (not shown). The holes in the upper surface of the stationary body match up with the ends of the slots so that adjacent pairs of holes are connected by the slots. In one position — as shown in the figure — gas flows from connections 1→2, 3→4, and 5→6. When the core rotates 60° then gas flows from connections 1→6, 2→3, and 4→5. Other common arrangements include four-, eight-, and 10-port varieties.
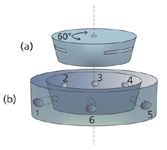
Figure 2: Beveled rotary valve diagram: (a) A beveled rotating core with slots fits into (b) a stationary valve body with holes. The slots in the rotating core match adjacent pairs of holes in the stationary body. For a six-port valve the core moves back and forth across a 60° angle. Low-dead-volume connections are drilled through the stationary valve body into the internal holes.
Rotary valve actuation is accomplished by a pneumatic or electronic valve actuator. A pneumatic actuator uses air pressure to move a rotor through the degrees of arc required by the particular valve in use. Table I lists the degrees of rotation for commonly used rotary valves. Valve actuators have limited degrees of rotation that should match the valve requirements. Although it is possible to use an actuator with a greater degree of rotation than the valve requires, such a configuration will wear out the valve and actuator prematurely due to stress on the actuator as well as on the valve shaft. An electronic actuator substitutes a stepper motor for the pneumatic motor and can provide more precise control as well as positive positional feedback. Electronic actuators can be controlled with encoded binary signals or by serial communications.
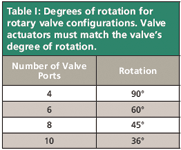
Table I: Degrees of rotation for rotary valve configurations. Valve actuators must match the valve's degree of rotation.
The surface-to-surface seal between the rotating valve core and stationary body is critical both in preventing outward leaks from the gas streams to the atmosphere as well as in blocking atmospheric gases from leaking into the internal passageways. Locking out atmospheric gases is particularly important when analyzing trace gas levels with extremely sensitive detectors. The sealing surfaces are angled in a way that increases gas pressure upper limits while reducing the force required to rotate the core, unlike a simple planar face-to-face arrangement of the rotating and stationary elements.
Rotary valves are available in a wide variety of configurations with various pressure and temperature ratings. Typical maximum GC valve working pressures range from 100 psig (689 kPa) up to 400 psig (2.76 MPa). Maximum temperatures range from 75 °C up to as high as 350 °C, although long-term operation at elevated temperatures will shorten the valve lifetime. Some valves, mostly the types rated for high temperatures, may not work well at subambient temperatures due to hardening of the valve-core material. In general, higher upper pressure limits are associated with reduced temperature ratings. Similar designs are used for LC applications, but with much higher pressure ratings of up to 5000 psi (34.5 MPa) for conventional high performance liquid chromatography (HPLC) and as high as 20,000 psi (138 MPa) for ultrahigh-pressure liquid chromatography (UHPLC).
Figure 3 illustrates the detector switching application with a four-port rotary valve. In position A the four-port valve connects ports 1→2 and 3→4. With the column connected to valve port 1 and the TCD system to port 2, the flow from the column is directed to the TCD system while the restrictor flow goes to the FID system. When the valve core is rotated by 90°, the port connections are exchanged. Now, the column flow leaves the valve at port 4 and goes to the FID system, and the restrictor flow leaves the valve at port 2 and goes to the TCD system. Returning the valve to its original position restores the initial flow conditions.
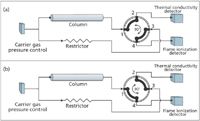
Figure 3: Detector selection by flow switching: implementation with a four-port rotary valve.
Loop injection: Sample loop injection onto the beginning of a column is another common application for stream switching. A six-port rotary valve works quite well for this purpose; Figure 4 shows how this is accomplished. With the valve in position A, ports 1→2, 3→4, and 5→6 are connected. The carrier gas supply and column are attached to ports 1 and 2, respectively, so the carrier gas flows directly into the column in this valve position. A gas-sampling loop with a volume of about 10 μL to 5 mL is attached to the valve at ports 6 and 3, which then allows a gaseous sample to be introduced into the loop via ports 4 or 5. A gas-sampling syringe, a calibration gas cylinder, or another source of gas can be attached to the valve or to an external fitting that connects to the valve.
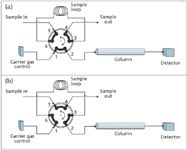
Figure 4: Loop injection onto a single column with a six-port rotary valve.
When filling the loop it is a good idea to allow at least 10 times the loop volume to flow through to fully purge the loop and connecting tubing of the existing gas content. Back-diffusion of atmospheric gases toward the loop can be mitigated by adding about 12 in. (30 cm) of 0.010-in. (0.25-mm) i.d. tubing at the sample outlet connection. For the best repeatability allow the loop pressure to decay for a few seconds after filling, so that the loop always reaches atmospheric pressure before injection. In some cases a back-pressure regulator can be installed at the sample outlet to create a controlled, elevated loop pressure. Be sure, however, that the loop pressure always is less than the carrier-gas inlet pressure.
Injection occurs when the six-port valve is moved to the position shown in Figure 4b. Now the carrier gas flows first through the sample loop and then into the column, flushing the sample loop into the column inlet. The loop contents will be compressed to the carrier-gas inlet pressure, which can help to form a narrower injection profile. The valve must remain in that position for sufficient time to flush the loop completely. At a column flow of 10.0 mL/min with a loop size of 1.0 mL and an inlet pressure of 30 psig (207 kPa), an injection time of 12 s would provide barely enough carrier-gas volume to flush the loop once. Although this time interval represents a carrier-gas volume of 2.0 mL at the column-exit pressure and room temperature, at the inlet pressure it would represent only about half this volume. It could be argued that because the sample is compressed to about half its original volume the amount of gas needed to flush the loop is also halved, but this point of view ignores the flow of pressurized carrier gas into both ends of the sample loop, from the pressurized column inlet as well as from the gas supply. In most cases it is better to leave the valve in the position shown in Figure 4b as long as possible or even until the end of the analysis.
For the best accuracy, record the atmospheric pressure and then adjust the results to a standard pressure of 14.696 psia (101.3 kPa). It isn't necessary to compensate for the loop temperature if the sample loop is positioned inside the GC oven and always at the same temperature. If the sample loop is outside the GC oven and it experiences temperature changes greater than about 10 °C over the course of a day then record the loop temperature and adjust the results to a standard temperature such as 0 °C (273.15 K). The adjustment to standard temperature and pressure conditions (STP) must be done in the same way for calibration as well as sample runs.
Equation 1 can be used to adjust results for both temperature (T) and pressure (P); some data handling systems will perform the adjustments given the correct loop temperature and pressure. Note that the adjustments are applied to the peak area (A) (or height if used) before calculating response factors or concentrations.

Here, the superscript "0" refers to the standard conditions and the subscript "a" refers to the ambient conditions in the sample loop; pressures must be expressed in the same units and temperatures must be converted to Kelvin. For example, if the local atmospheric pressure is 14.3 psia (98.6 kPa) and the loop is at 27 °C (300.15 K) then the correction factor to STP conditions would be

Using this correction will help reduce variability in calibration and results. In comparison to syringe injection techniques, however, loop injection generally delivers significantly lower relative standard deviations.
Much smaller injection volumes can be accommodated by using the internal volume of the rotary valve itself as the entire sample loop. This technique is applied mainly in valves for LC applications down to as little as 0.1 μL — in the GC realm 10 μL is a practical lower limit for most applications.
More-Complex Applications
This first series installment has explored the basics of rotary valves for GC. Detector selection and loop injection are two of the most important applications for gas-stream switching. Modern rotary valves make the setup and use of these configurations simple and robust. The next installment will address rotary valve configurations for multiple column switching and for sample-stream selection.

John V. Hinshaw
John V. Hinshaw "GC Connections" editor John V. Hinshaw is senior Research Scientist at Serveron Corp., Hillsboro, Oregon, and a member of LCGC's editorial advisory board. Direct correspondence about this column to the author via e-mail: lcgcedit@lcgcmag.com.
References
(1) L.S. Ettre, Chapters in the Evolution of Chromatography (Imperial College Press, London, 2008), pp. 259–290.

Detecting Hyper-Fast Chromatographic Peaks Using Ion Mobility Spectrometry
May 6th 2025Ion mobility spectrometers can detect trace compounds quickly, though they can face various issues with detecting certain peaks. University of Hannover scientists created a new system for resolving hyper-fast gas chromatography (GC) peaks.
Altering Capillary Gas Chromatography Systems Using Silicon Pneumatic Microvalves
May 5th 2025Many multi-column gas chromatography systems use two-position multi-port switching valves, which can suffer from delays in valve switching. Shimadzu researchers aimed to create a new sampling and switching module for these systems.
New Study Reviews Chromatography Methods for Flavonoid Analysis
April 21st 2025Flavonoids are widely used metabolites that carry out various functions in different industries, such as food and cosmetics. Detecting, separating, and quantifying them in fruit species can be a complicated process.

.png&w=3840&q=75)

.png&w=3840&q=75)


.png&w=3840&q=75)


.png&w=3840&q=75)


