Using Thermodynamics and Simulations to Understand Selectivity and Retention in Gas Chromatography
Retention and selectivity in gas chromatography (GC) occur because of the thermodynamics of the phase transition from the vapor phase following sample injection to the solution phase of being dissolved in the stationary phase. Analytes then move along the column because the vapor phase is flowing. In this installment, we quickly review the basic thermodynamics underlying separation in GC, and we see how this impacts selectivity and retention. Last month, we saw how seemingly large differences in column polarity may still generate little, or even the opposite, effect on retention and generate confusion and difficulty in method development. This month, we explore this challenge more in-depth using thermodynamics and a freely available online GC simulator.
Like all separation and extraction techniques, gas chromatography (GC) relies on the equilibrium between two distinct phases. These two phases are a gas phase, which is moving, and a liquid or solid phase, which is stationary. The equilibrium process and its relation to retention times is discussed in the literature (1–3). A quick summary, establishing the relationship between thermodynamic constants and retention times, is provided here. The phase equilibrium and equilibrium constant expression for an analyte partitioning between the mobile and stationary phases is shown in equation 1:

Equation 2 shows the relationship between the partition coefficient, K, and retention time. The gas hold-up time is tM and the phase ratio, β, is the volume ratio of the mobile phase and stationary phase. As seen in equation 2, there is a linear relationship between retention time and partition coefficient:

Equation 3 is the classical van ’t Hoff equation, which relates the partition coefficient to the standard enthalpy and entropy of a reaction. In our case, this would be ΔHo and ΔSo of the phase transition described in equation 1. Equation 4 is the classical Gibbs’ equation, gas phase, which relates the partition coefficient and the standard free energy change.
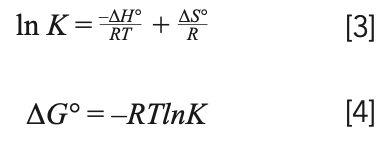
As seen from equations 2 and 3, the thermodynamic constants, ΔHo and ΔSo, and the temperature determine the partition coefficient, which, along with the gas hold-up time, determines the retention time. For a given stationary phase and analyte combination, these thermodynamic constants are easily measured by plotting ln K versus (1/T), with the slope of the resulting line being -ΔHo/R and the y-intercept being ΔSo/RT.
Optimizing selectivity is usually the goal of stationary phase selection. Selectivity, shown in equation 5, is seen as the ratio of adjusted retention time, retention factor, or partition coefficient, which is usually determined for adjacent peaks in a chromatogram. If equation 5 is combined with equation 4, it can be seen that selectivity originates from the difference in the standard free energy change, ΔΔGo, for the phase transition seen in equation 1. A larger ΔΔGo indicates a greater ratio of partition coefficients and therefore a greater selectivity.

In the 1980s, Dose coined the term thermodynamic retention indexes to describe how thermodynamic constants can be used to predict retention times under any conditions for a given analyte and stationary phase combination. Rijks and others also used this concept for the determination of temperature-programmed retention indexes and Snow extended it further to multi-ramp temperature programs (4–7). Thermodynamic retention indexes provide the basis for today’s online tools for predicting retention times (8).
We can use the online tool ProEZGC, whose web address is provided in reference (8) and which employs thermodynamic retention indexes, to explore some factors that impact selectivity and retention and to follow up on our discussion of stationary phase polarity and retention from last month’s installment (9).
Retention Examples Using Traditional Stationary Phases
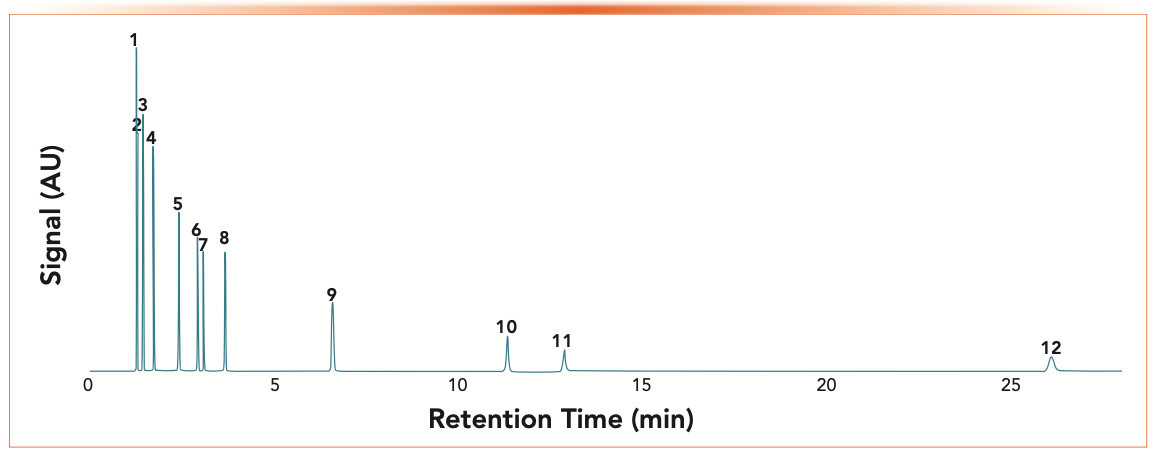
Figures 1 and 2 show chromatograms of hydrocarbon mixtures on two classical stationary phases simulated using ProEZGC: 100% polydimethylsiloxane (PDMS) and polyethylene glycol (PEG). The two columns have identical length, inside diameter, and film thickness. The inlet pressure and the flow rates are also identical. The temperature was also identical for both at 40 oC isothermal with a total run time of 30 min for PEG and 60 min for PDMS. Identical column dimensions and separation conditions allow for direct comparison of all chromatographic parameters.
FIGURE 1: Simulated chromatogram of alkanes and test probes on PDMS. Peak identification: 1) ethanol; 2) pentane; 3) hexane; 4) benzene; 5) heptane; 6) pyridine; 7) octane; 8) nonane; 9) decane; and 10) undecane.
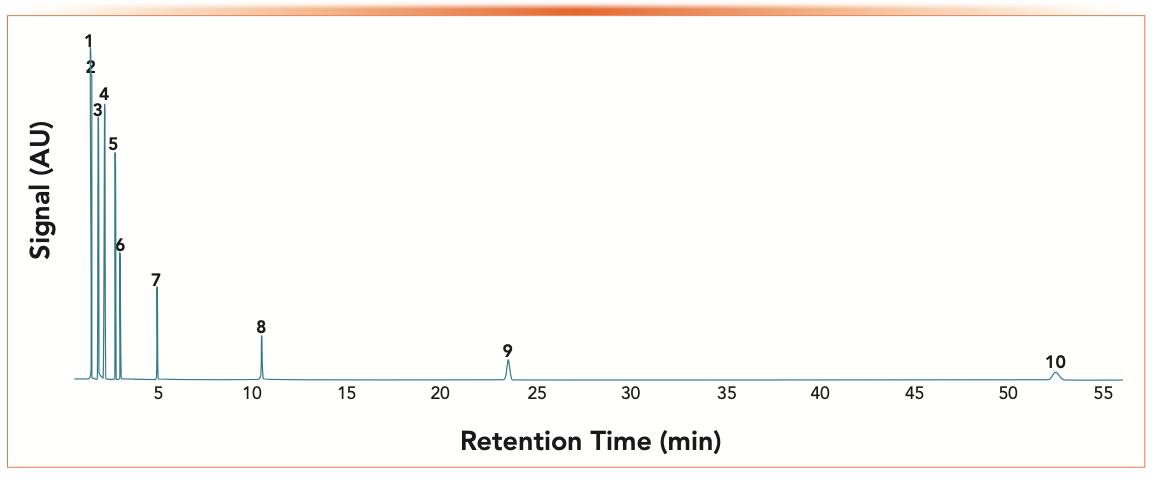
FIGURE 2: Simulated chromatogram of alkanes and test probes on PEG. Peak identification: 1) pentane; 2) hexane; 3) heptane; 4) octane; 5) nonane; 6) benzene; 7) ethanol; 8) decane; 9) undecane; 10) pyridine; 11) dodecane; and 12) tridecane.
The mixtures consisted of a homologous series of n-alkanes and three additional compounds often used in stationary phase polarity determinations: benzene, which measures pi–pi interactions; ethanol, which measures hydrogen bonding; and pyridine, which measures acid–base interactions. The two stationary phases are expected to exhibit different intermolecular interactions with PDMS showing almost entirely dispersive interactions and PEG showing mostly hydrogen bonding.
Examining retention of the homologous series of n-alkanes, several observations related to the fundamental thermodynamics and the differences in intermolecular interactions are seen. First, note that within the 30 min time window for the separation at 40 oC, on PEG, tridecane (C13) is eluted in approximately 26 min, whereas on PDMS undecane (C11) it requires approximately 52.5 min, and it is eluted on PEG in approximately 6.5 min. Alkanes undergo almost entirely dispersive interactions. This demonstrates that the dispersive interactions are much stronger on PDMS than on PEG.
Next, examine the spacing of the n-alkanes on both stationary phases. Adding methylene (-CH2-) units to a straight chain hydrocarbon has a roughly linear effect on the standard free energy of vaporization. This leads to an exponential effect on the partition coefficient, resulting from the classical Gibbs’ equation and a resulting exponential effect on the retention time, as seen in equation 2. We see this in the peak spacing for the n-alkanes on both columns.
Finally, examine the three non-alkane compounds. Table I shows retention time data, partition coefficients and partition coefficients, for these three compounds. Using the retention factor k, we can examine how the change in stationary phase affects the retention of each analyte based on intermolecular interactions.
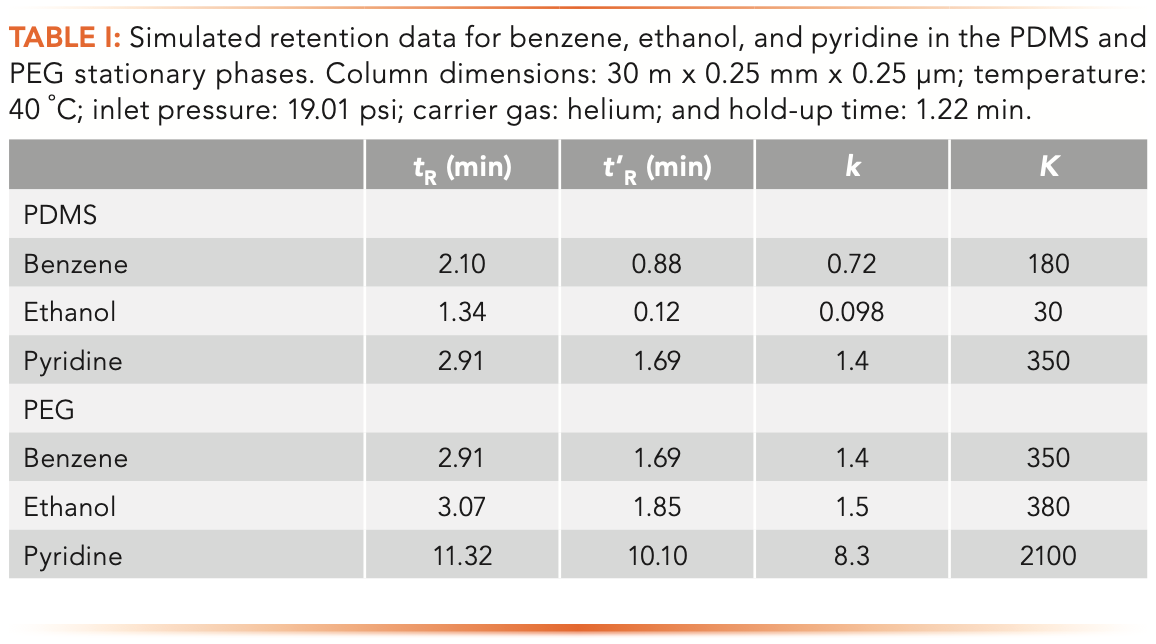
Ethanol shows the least retention of all compounds in the mixture on PDMS, with a retention factor of approximately 0.1, indicating that approximately 10% of the ethanol molecules are dissolved in the stationary phase at any moment in during the separation. The equilibrium shown in equation 1 lies strongly to the left, favoring the mobile phase. On PEG, ethanol shows a retention factor of approximately 2, indicating that approximately two-thirds, or 67%, of the ethanol molecules are dissolved in the stationary phase at any point in the separation. This equilibrium lies to the right, favoring the stationary phase. Because the PEG stationary phase exhibits primarily hydrogen bonding, it is no surprise that ethanol would be 6–7 times more strongly retained on PEG than PDMS.
Benzene is more strongly retained on PEG than ethanol with a retention factor of 1.2 indicating that slightly more benzene is dissolved in the stationary phase; the equilibrium shown in equation 1 lies slightly to the right. On PDMS, benzene shows a retention factor of 0.7, indicating that more benzene is vaporized in the mobile phase and the equilibrium lies to the left. Benzene is generally considered non-polar or moderately polar, but is polarizable, leading to stronger interactions with the polar PEG stationary phase and greater retention.
Pyridine is most strongly retained of these three analytes on both stationary phases. On PDMS, k for pyridine is 1.4 and on PEG, k is 8.3. On PDMS, the equilibrium shown in equation 1 lies slightly to the right and on PEG it lies far to the right, both favoring the stationary phase, but PEG favoring it much more. Being basic, pyridine is expected to strongly bond with the slightly acidic PEG, which is seen in the much higher retention factor.
Thermodynamics and Selectivity
Figure 3 shows van ’t Hoff plots for benzene and ethanol on PDMS (Figure 3a) and PEG (Figure 3b), generated using simulations of the separations of each in a temperature range from 40–120 oC. Thermodynamic values, determined from the slope and y-intercept of the lines are included on the plots. These values are the thermodynamic retention indexes described originally by Dose in 1987 and used in ProEZGC and other programs to predict retention times.
FIGURE 3: The van ’t Hoff plots for (a) benzene and ethanol on PDMS, and (b) PEG from simulated chromatograms. Column dimensions: 60 m x 0.32 mm x 1.00 μm.
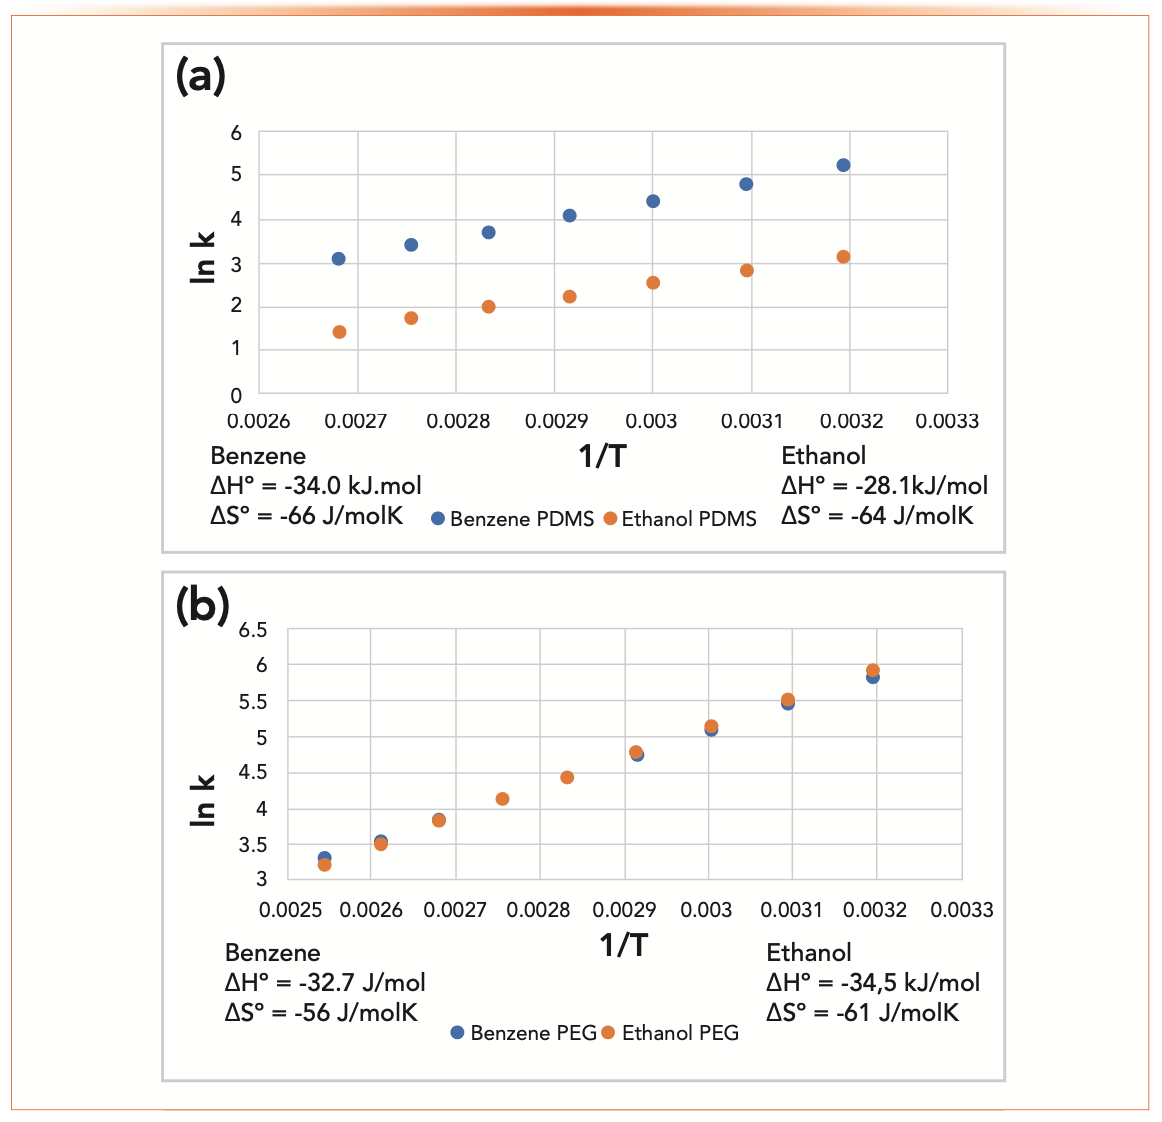
In Figure 3a, the two lines are spaced far apart, indicating high selectivity in the temperature range shown on the plot. Note that as the temperature increases (reading the x-axis on the plot from right to left), the two lines converge slightly, indicating that selectivity decreases with increasing temperature, as expected. The high selectivity for ethanol and benzene, indicated in Figure 3a, is also seen in Table I, with the retention factor of benzine being 0.72 and ethanol 0.098, for a selectivity, as calculated using equation 5, of approximately seven. Therefore, PDMS is highly selective for benzene and ethanol.
In Figure 3b, showing lines for benzene and ethanol on the PEG stationary phase, the lines are much closer together, indicating much lower selectivity. Using the data in Table I, we see that the selectivity for benzene and ethanol on PEG is approximately 1.1, much lower than on PDMS. From Table I, note that the retention times for both are higher, indicating that PEG is more retentive but less selective than PDMS for these two compounds. Finally, note that the position of the lines also predicts the elution order. Reading up from the bottom of the graph, the earlier eluting compound is shown by the line closer to the x-axis.
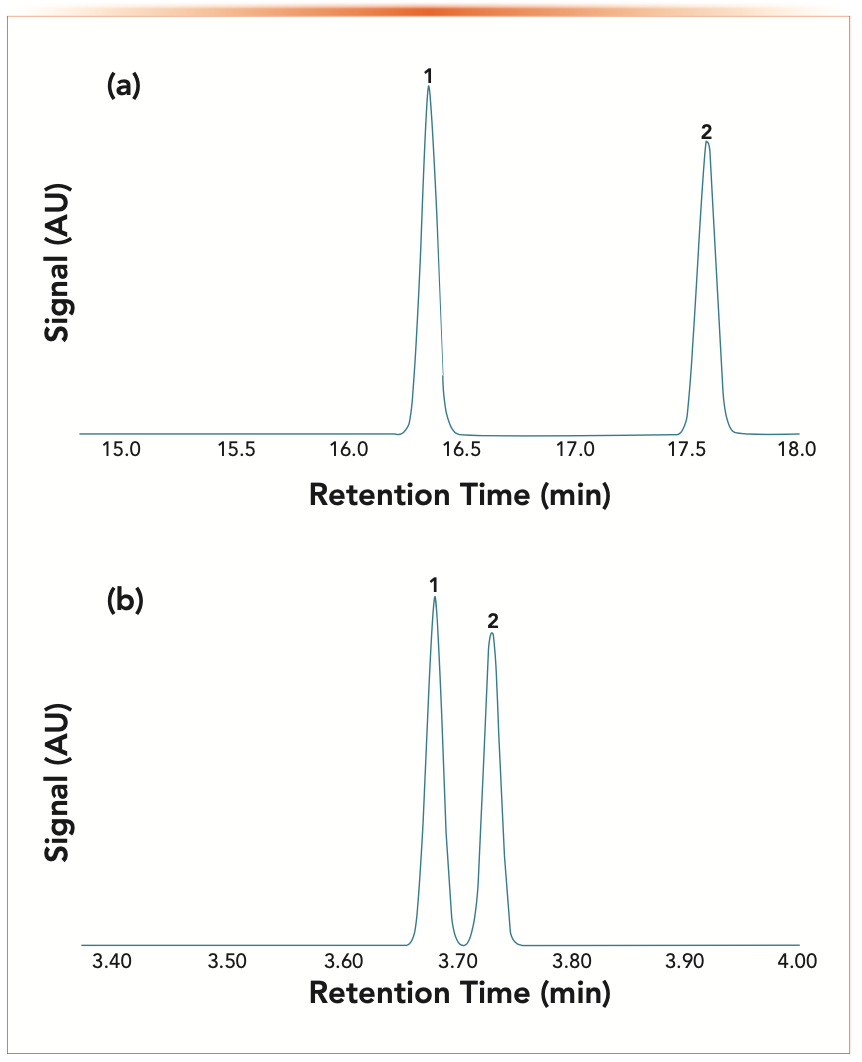
Figure 4a shows a simulated separation of benzene and ethanol on a PEG stationary phase at 40 oC and Figure 4b shows the same separation at 120 oC. First, note the impact of temperature on selectivity as seen by the spacing of the peaks calculated from the adjusted retention times and Equation 5, 1.1 at 40 oC and 1.05 at 120 oC, except with the order of the peaks reversed. There is almost no selectivity at 90 oC, as seen in Figure 3, with the data points for benzene and ethanol almost fully overlapped. Generally, since higher temperatures favor the mobile phase, pushing the equilibrium seen in equation 1 back to the left, selectivity decreases as the temperature increases. See also the change in elution order. At 40 oC, benzene is eluted first and at 120 oC ethanol is eluted first. This can be explained by the difference in slope of the two lines in Figure 4b.
FIGURE 4: Crossover separations of benzene and ethanol on PEG. (a) temperature: 40 oC; peak identification: 1) benzene and 2) ethanol; (b) temperature: 120 oC; peak identification: 1) ethanol and 2) benzene.
The difference between the lines generates selectivity, the larger the spacing between the lines, the greater the selectivity. Retentiveness can also be predicted from this plot or from simply estimating partition coefficients. A larger partition coefficient, K, or a more negative ΔGo indicates stronger retention and longer retention times. For two compounds, a larger difference in K or in ΔGo indicates greater selectivity.
Conclusions
Retention and selectivity in GC are based on thermodynamic values for the phase transition between the mobile and stationary phases. By examining the basic thermodynamics and equilibrium constants for this process, we can systematically compare retention on the same stationary phase with changing conditions or across stationary phases. We see that strong retention does not always mean high selectivity and that selectivity changes with temperature, sometimes resulting in changes in elution order on the same stationary phase. Larger differences in partition coefficients or in standard free energy changes generate higher selectivity. Larger partition coefficients and more negative standard free energy changes generate longer retention.
References
(1) Snow, N. H. Determination of Free-Energy Relationships Using Gas Chromatography. J. Chem. Educ. 1996, 73 (6), 592–597. DOI: 10.1021/ed073p592
(2) Vitha, M. F. Short Gas Chromatography Experiment That Richly Connects Thermodynamics to the Intermolecular Interactions That Govern Solute Retention. J. Chem. Educ. 2022, 99 (5), 1923–1930. DOI: 10.1021/acs.jchemed.2c00039.
(3) McNair, H. M.; Miller, J. M.; Snow, N. H. Basic Gas Chromatography (John Wiley and Sons, Hoboken, NJ, 2019).
(4) Dose, E. Simulation of Gas Chromatographic Retention and Peak Width Using Thermodynamic Retention Indexes. Anal. Chem. 1987, 59 (19), 2414–2419. DOI: 10.1021/ac00146a020
(5) Curvers, J.; Rijks, J.; Cramers, C. et al. Temperature Programmed Retention Indices: Calculation from Isothermal Data. Part 1: Theory. J. High Resolut. Chromatogr. 1985, 8 (9), 607–610. DOI: 10.1002/jhrc.1240080926
(6) Curvers, J.; Rijks, J.; Cramers, C. et al. Temperature Programmed Retention Indices: Calculation from Isothermal Data. Part 2: Results with Nonpolar Columns. J. High Resolut. Chromatogr. 1985, 8 (9), 611–617. DOI: 10.1002/jhrc.1240080927
(7) Snow, N. H.; McNair, H. M. A Numerical Simulation of Temperature-Programmed Gas Chromatography, J. Chromatogr. Sci. 1992, 30 (7), 271–275. DOI: 10.1093/chromsci/30.7.271
(8) Restek, ProEZGC Chromatogram Modeler, https://ez.restek.com/proezgc (Accessed January 2023).
(9) Snow, N.; Rana, H. Does High Polarity Mean High Retention on Stationary Phases in Gas Chromatography? LCGC North Am. 2023, 41 (1), 18–22.
ABOUT THE AUTHOR
Nicholas H. Snow is the Founding Endowed Professor in the Department of Chemistry and Biochemistry at Seton Hall University, and an Adjunct Professor of Medical Science. During his 30 years as a chromatographer, he has published more than 70 refereed articles and book chapters and has given more than 200 presentations and short courses. He is interested in the fundamentals and applications of separation science, especially gas chromatography, sampling, and sample preparation for chemical analysis. His research group is very active, with ongoing projects using GC, GC–MS, two-dimensional GC, and extraction methods including headspace, liquid–liquid extraction, and solid-phase microextraction. Direct correspondence to: LCGCedit@mmhgroup.com


Fundamentals of Benchtop GC–MS Data Analysis and Terminology
April 5th 2025In this installment, we will review the fundamental terminology and data analysis principles in benchtop GC–MS. We will compare the three modes of analysis—full scan, extracted ion chromatograms, and selected ion monitoring—and see how each is used for quantitative and quantitative analysis.
Study Examines Impact of Zwitterionic Liquid Structures on Volatile Carboxylic Acid Separation in GC
March 28th 2025Iowa State University researchers evaluated imidazolium-based ZILs with sulfonate and triflimide anions to understand the influence of ZILs’ chemical structures on polar analyte separation.


